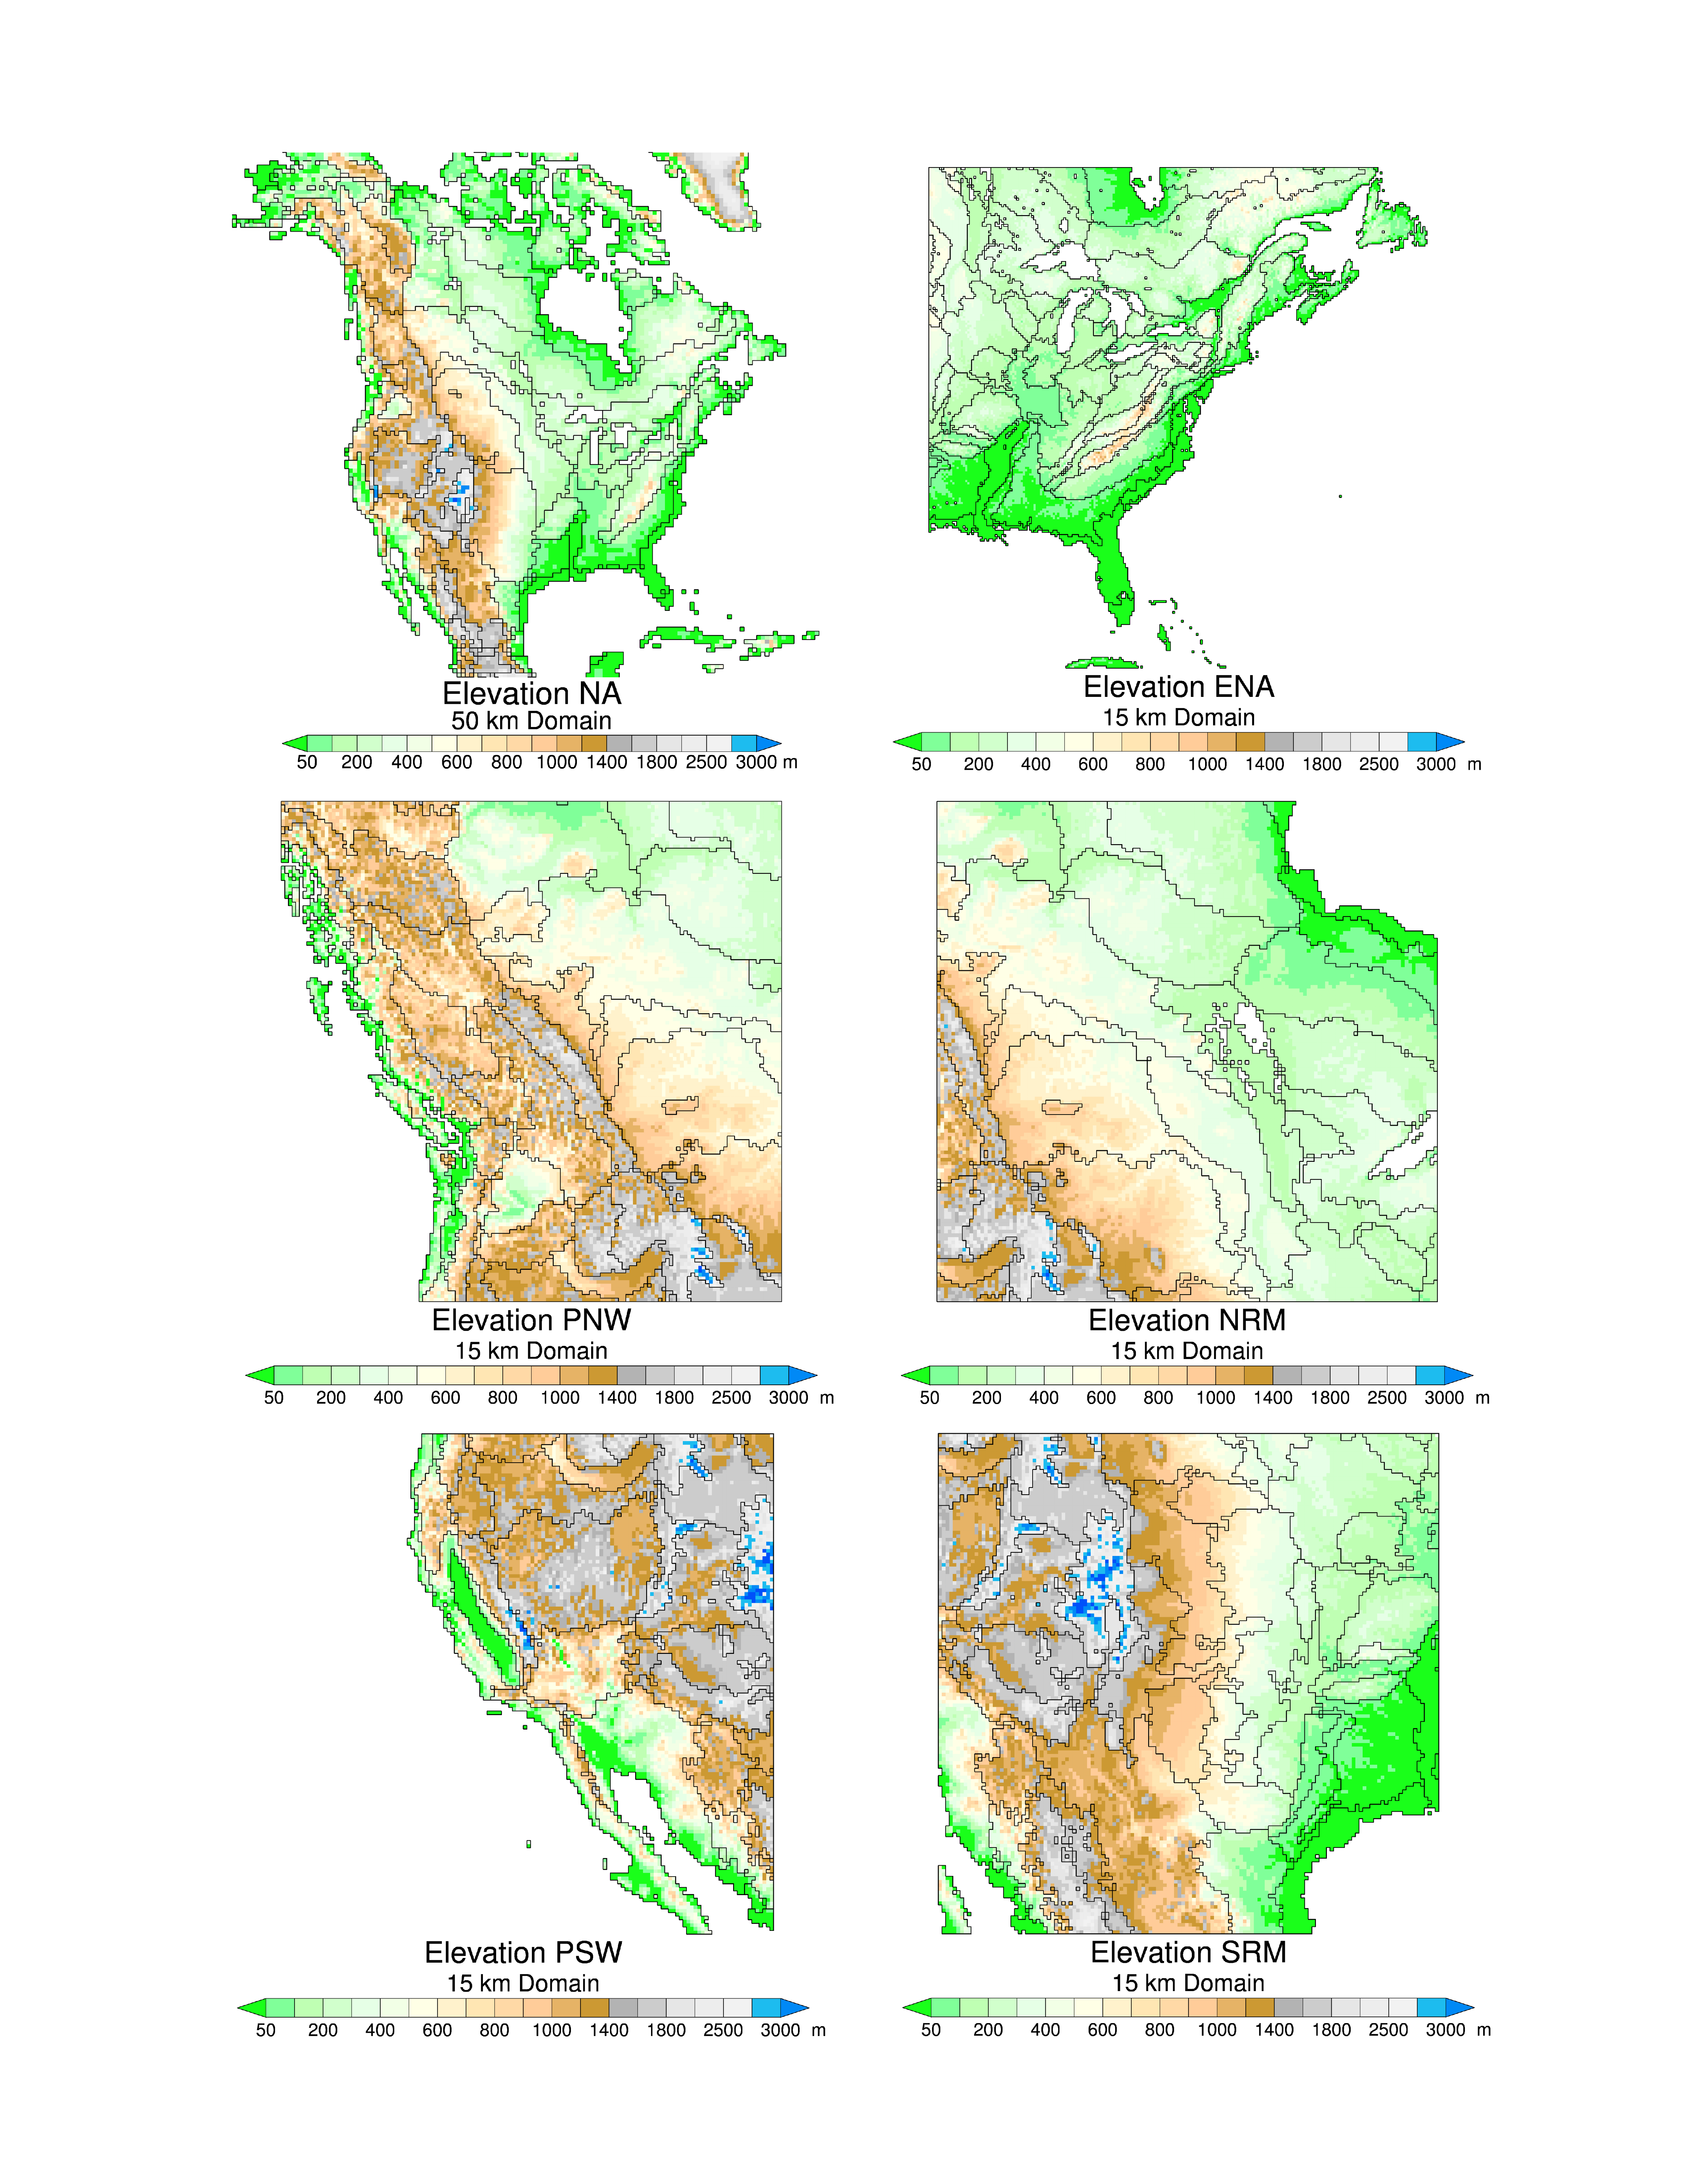
Our climate simulations include six regions or model domains (fig. 2, domains). The North American (NA) domain has a horizontal grid spacing of 50 km and 23 vertical levels, the Eastern North America (ENA) domain has a horizontal grid spacing of 15 km and 23 vertical levels and the Western North America (WNA) domain has a horizontal grid spacing of 15 km and 18 vertical levels. We found that it was necessary to divide the West into four overlapping domains in order to achieve the necessary balance between boundary forcing, regional dynamics and the quality of the simulations over the complex topography of the region. The model produced an unacceptable cold bias over a single, large WNA domain due to a combination of complex topography and the large horizontal distances from the center of the model to the GCM boundary forcing.
The 50-km simulations over the NA domain are intended to provide atmospheric and surface fields to allow analysis of large-scale circulation and modes of variability (for example, the Pacific–North American teleconnection, pattern, PNA) in the past, present, and future. The 15-km simulations provide high resolution of weather and surface fields that better reflect topographic forcing that dominates the West. Together, the 50- and 15-km simulations allow joint analysis of synoptic‑scale circulation variations and the resulting surface responses.
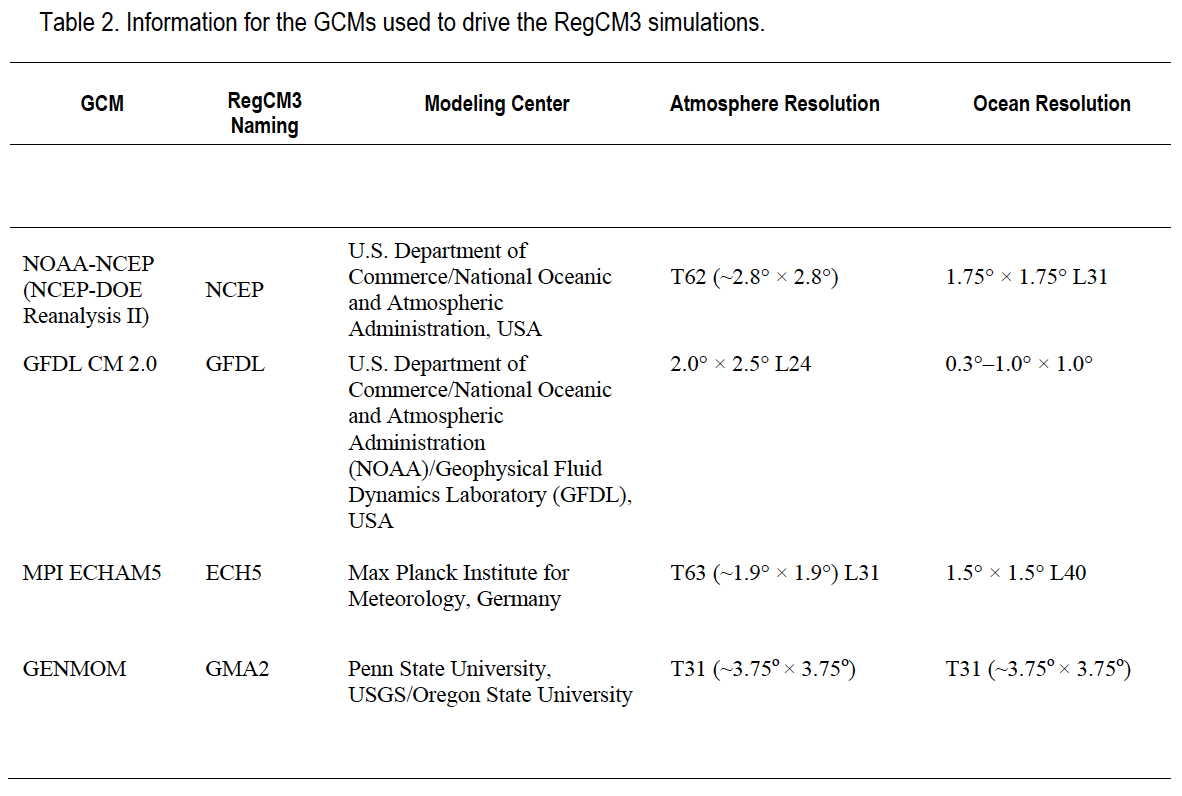
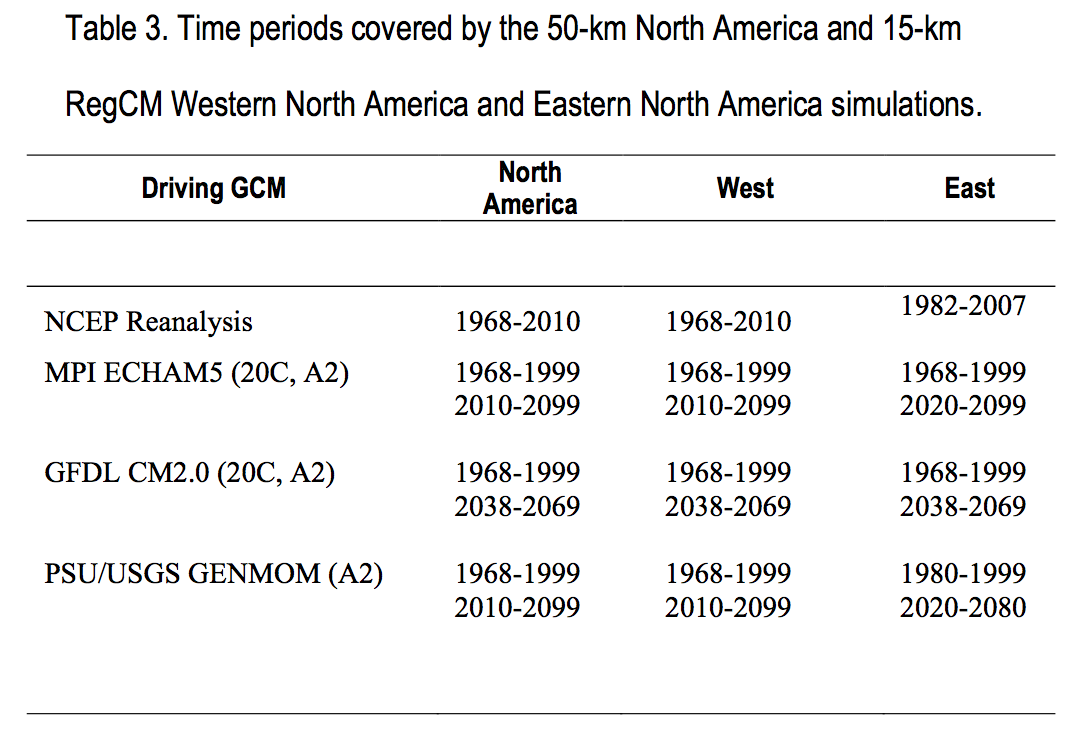
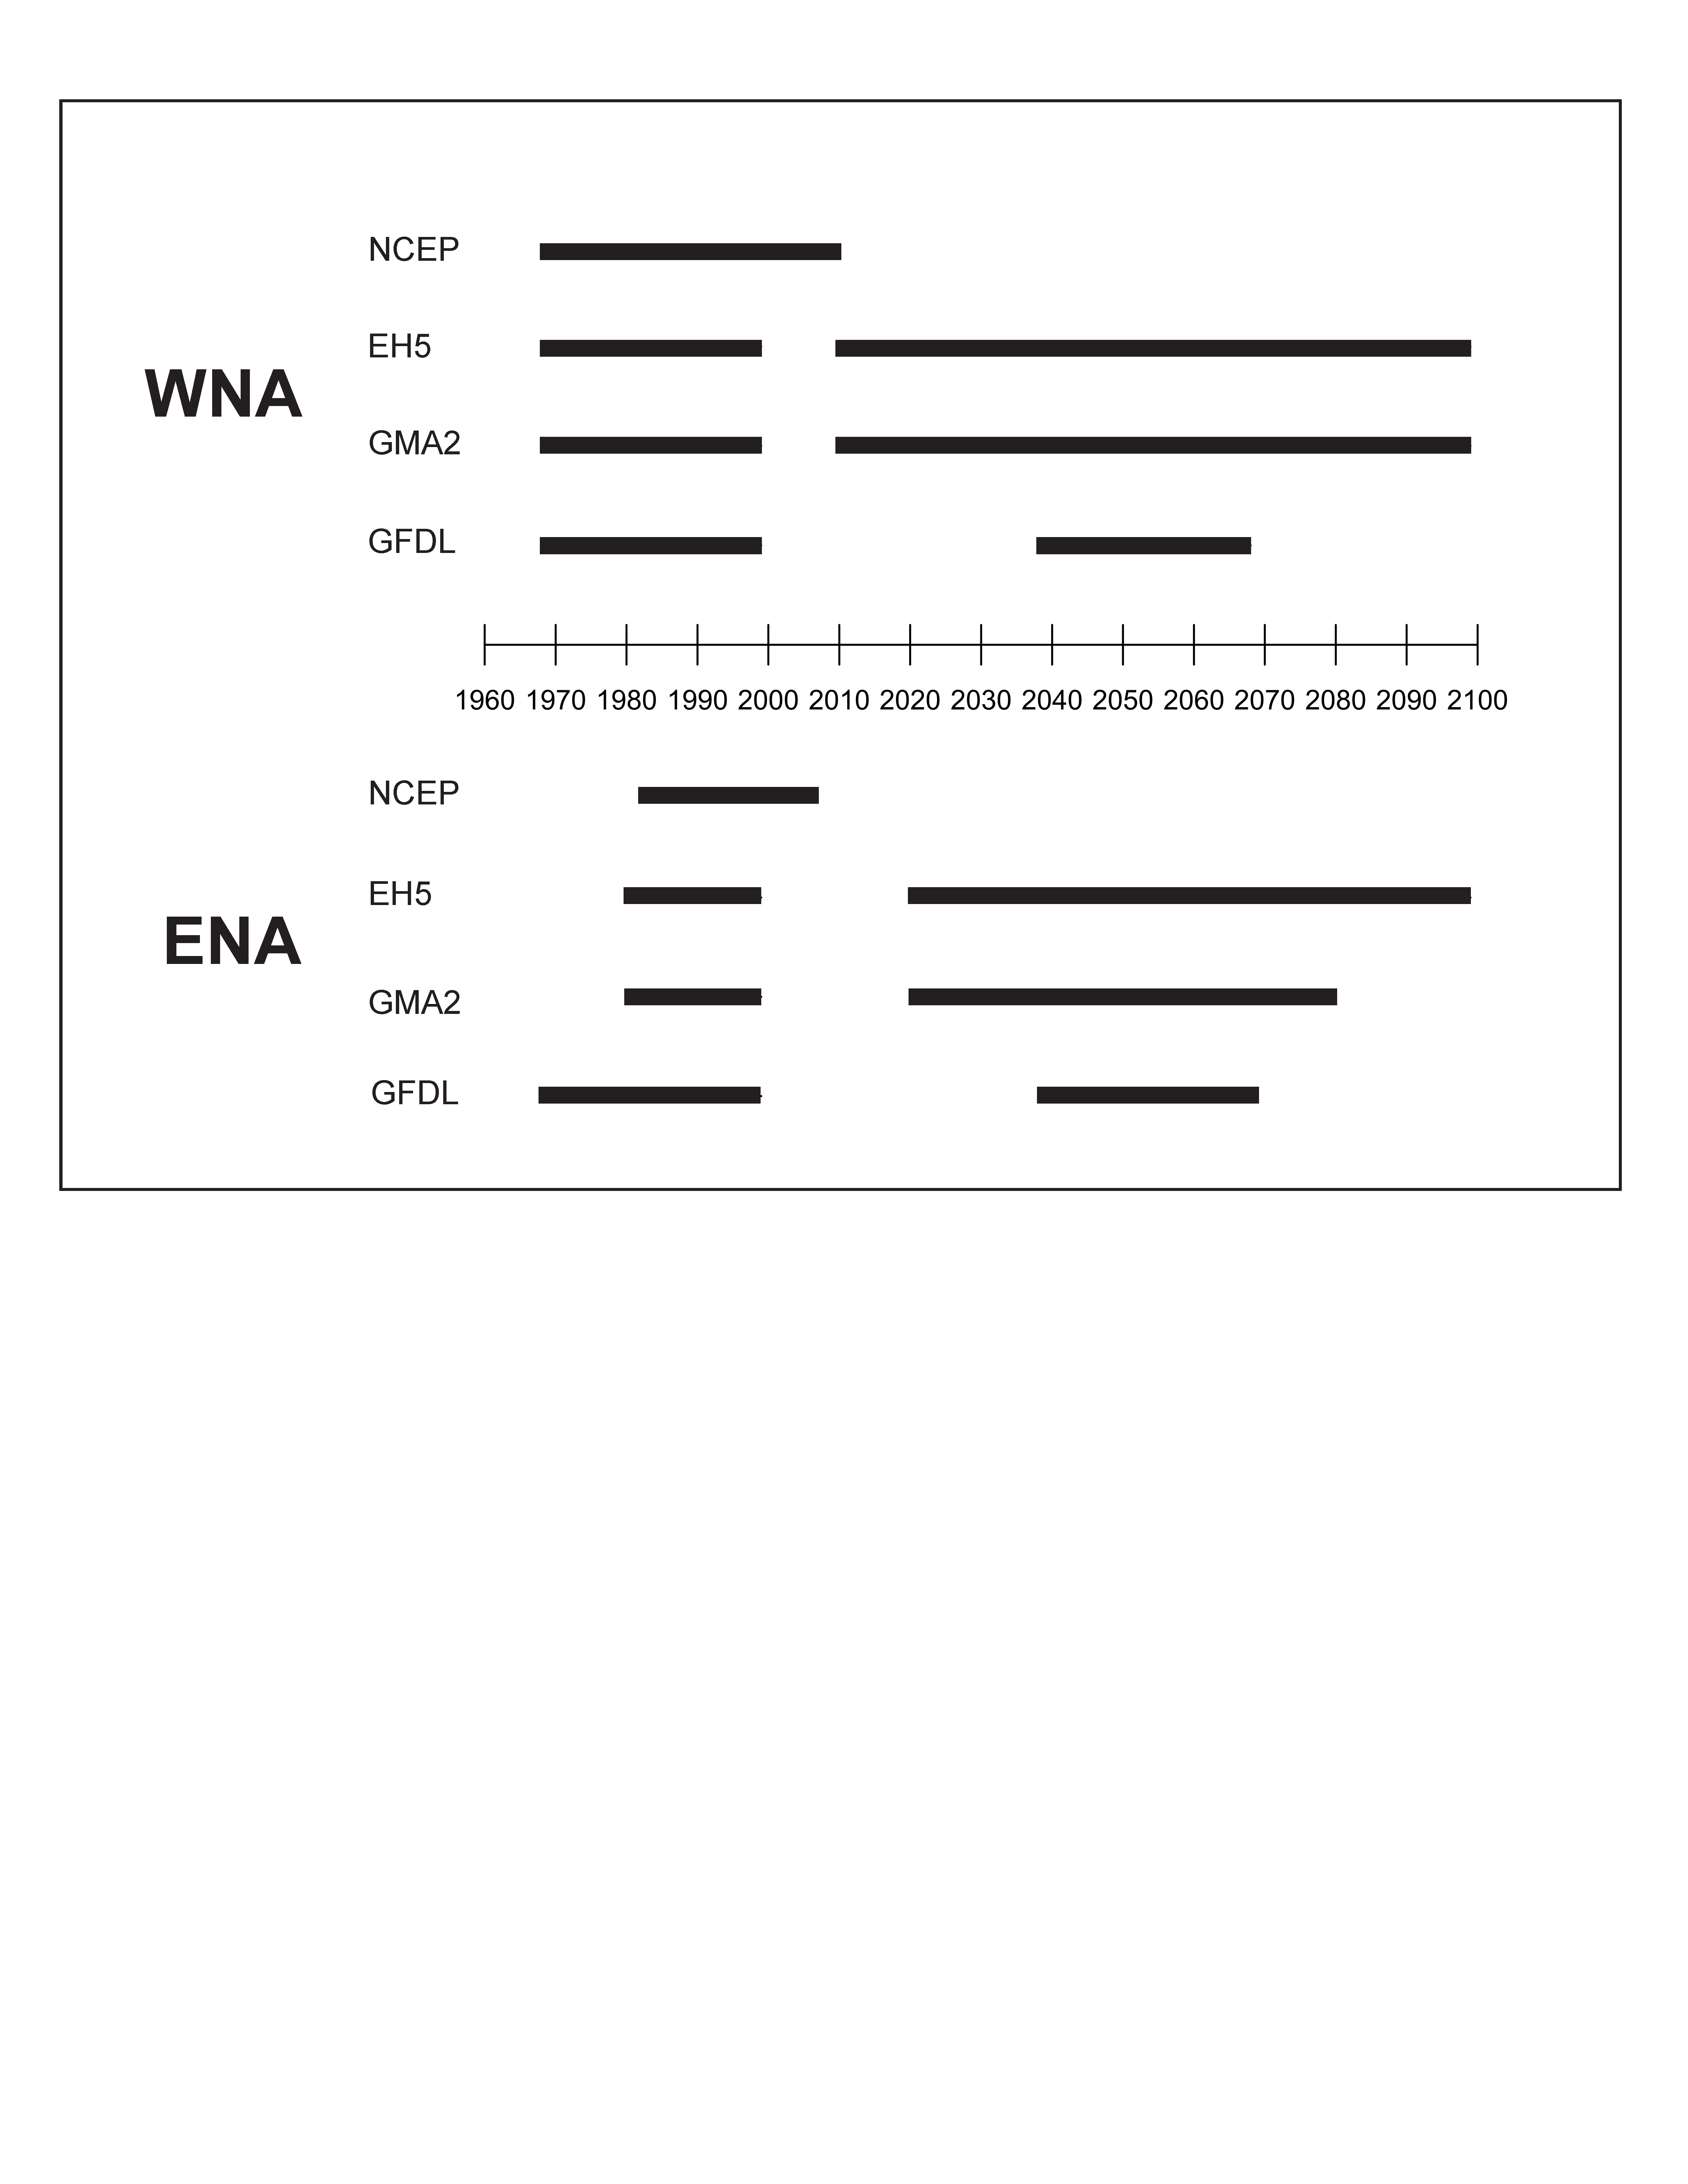
We used output from four GCMs to derive boundary conditions for the RegCM3 (table 2, table 3, fig. 3). The NCEP RegCM3 simulation is driven by atmospheric and surface fields derived from the NCEP-NCAR Reanalysis project that is run by NOAA (Kistler and others, 2001). The reanalysis project assimilates a large array of observed atmospheric and surface data into the NOAA AGCM, which is run simultaneously to produce spatially and temporally continuous global datasets. The NCEP Reanalysis data thus provide a gridded, optimal estimate of climate variables that are constrained by observations (for example, temperature and precipitation). It is standard practice in regional climate modeling to use reanalysis products as driving boundary conditions because, in theory, the resulting RCM simulations should be in the best agreement with observations. Additionally, the NCEP simulations provide spatially and temporally complete and internally consistent gridded sets of climate and surface variables that can be used “off line” to calibrate process models.
Global climate simulations from the GFDL CM 2.0 and the MPI ECHAM5 were part of a suite of model output used in the Climate Model Inter-comparison Project (CMIP‑3) and the IPCC AR4. Both GCMs have long development histories and have been widely applied to climate research. More information can be found on the CMIP‑3 website (http://www‑pcmdi.llnl.gov/ipcc/model_documentation/ipcc_model_documentation.php), IPCC Data Distribution Centre website (http://www.ipcc-data.org ) and the web pages of the individual modeling centers. We gratefully acknowledge the individual modeling centers for providing the history files needed to derive boundary conditions for the RegCM3.
GENMOM (GMA2 in table 2 and table 3) is a recently developed GCM comprised of the GENESIS V3.0 atmospheric GCM and the MOM V2.0 oceanic GCM. Both component GCMs have been applied extensively to climate research. The model is relatively low resolution (T31, ~3.75° × 3.75°) by design, a compromise that allows long simulations to be made in reasonable time so that the model can be applied to paleoclimate and future experiments that commonly are run for multiple decades and centuries. GENMOM is not part of the CMIP‑3 or CMIP‑5 model evaluations. We are participating with GENMOM simulations in the Paleoclimate-Modelling Inter-comparison Project (PMIP), which is part of CMIP‑5.
The GENMOM simulations of future climate were produced as an additional downscaled data set under the A2 emissions scenario. The A2 simulations are part of a larger data-model comparison effort aimed at evaluating the ability of our GCM and RCM to simulate North American climate and climatic variability in response to changes in global boundary conditions (for example, insolation, atmospheric composition, continental ice sheets, sea level, and paleogeography). The simulations span the last glacial maximum (LGM, 21,000 years ago) through the Holocene. Details and an evaluation of the GENMOM simulation of present-day climatology are given in Alder and others (2010).