Figure 1. Nesting of the RegCM3 within a GCM (NOAA, NCEP).
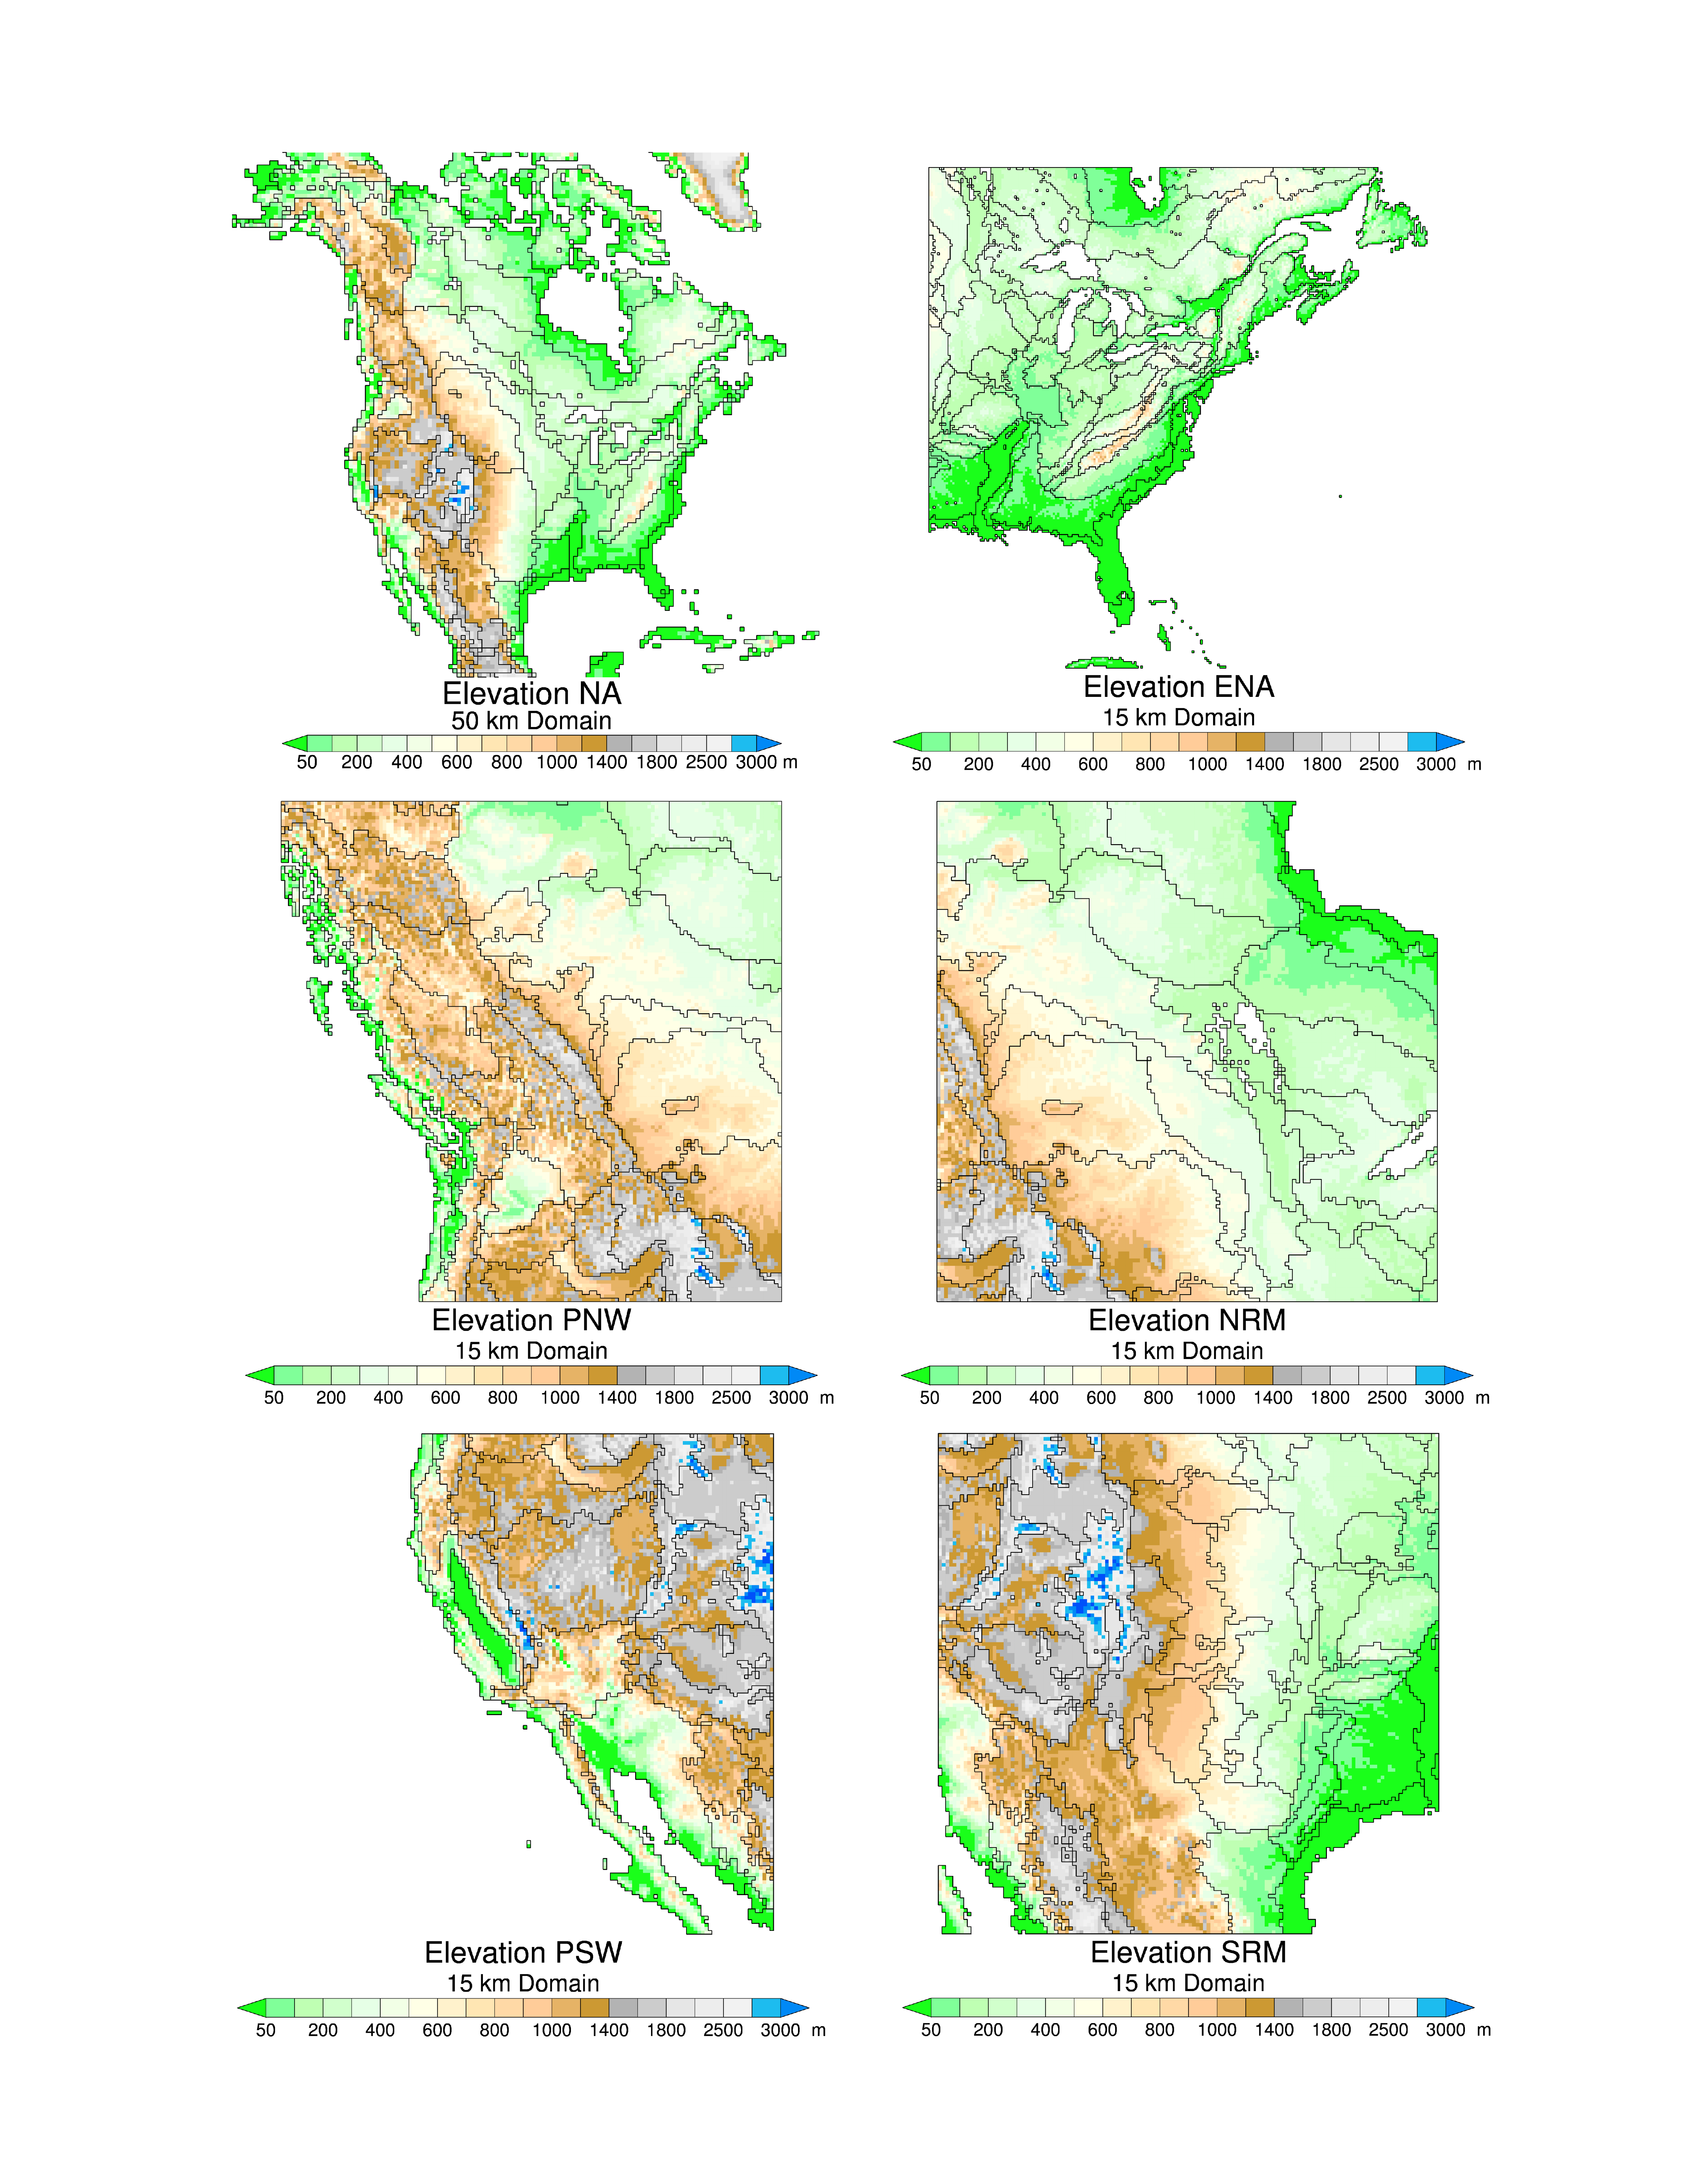
Figure 2. Topography and extent of the 6 RegCM3 domains.
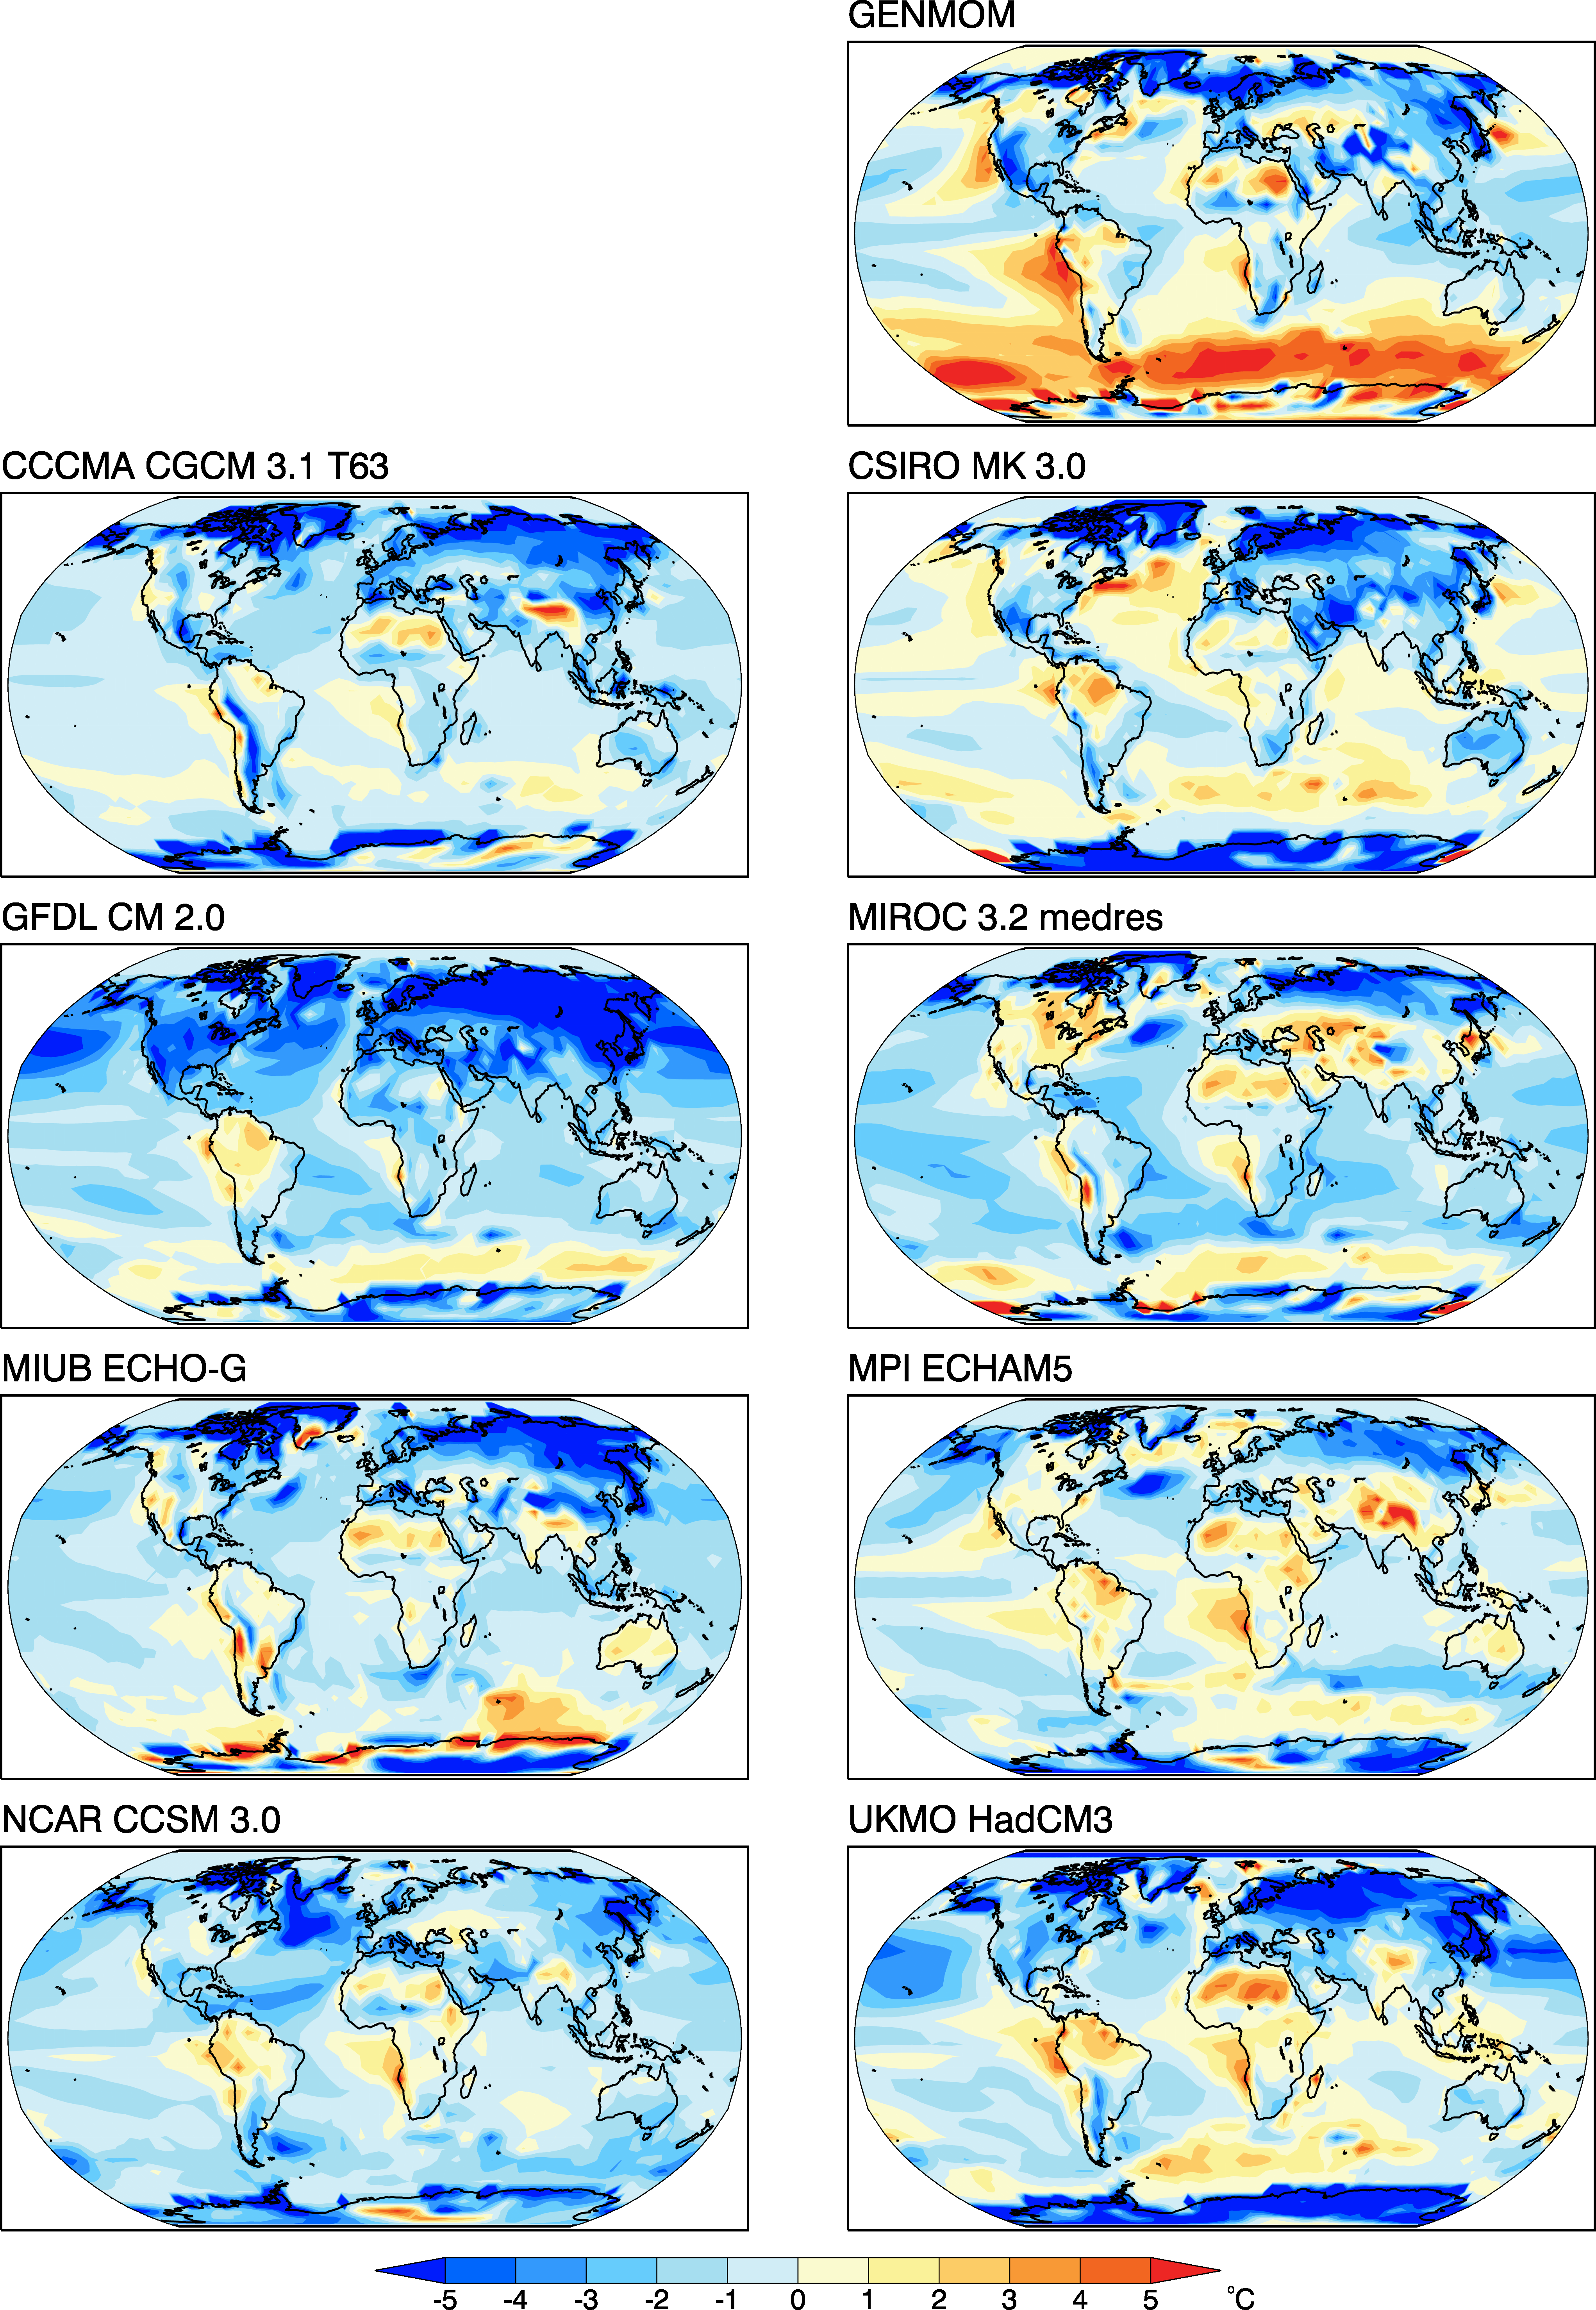
Figure 5. Differences (anomalies) between the simulated mean annual 2-m temperature climatologies and the NOAA NCEP Reanalysis II for GENMOM and a selected subgroup of eight global climate models used in the IPCC AR4. Model names are given in figure 4.
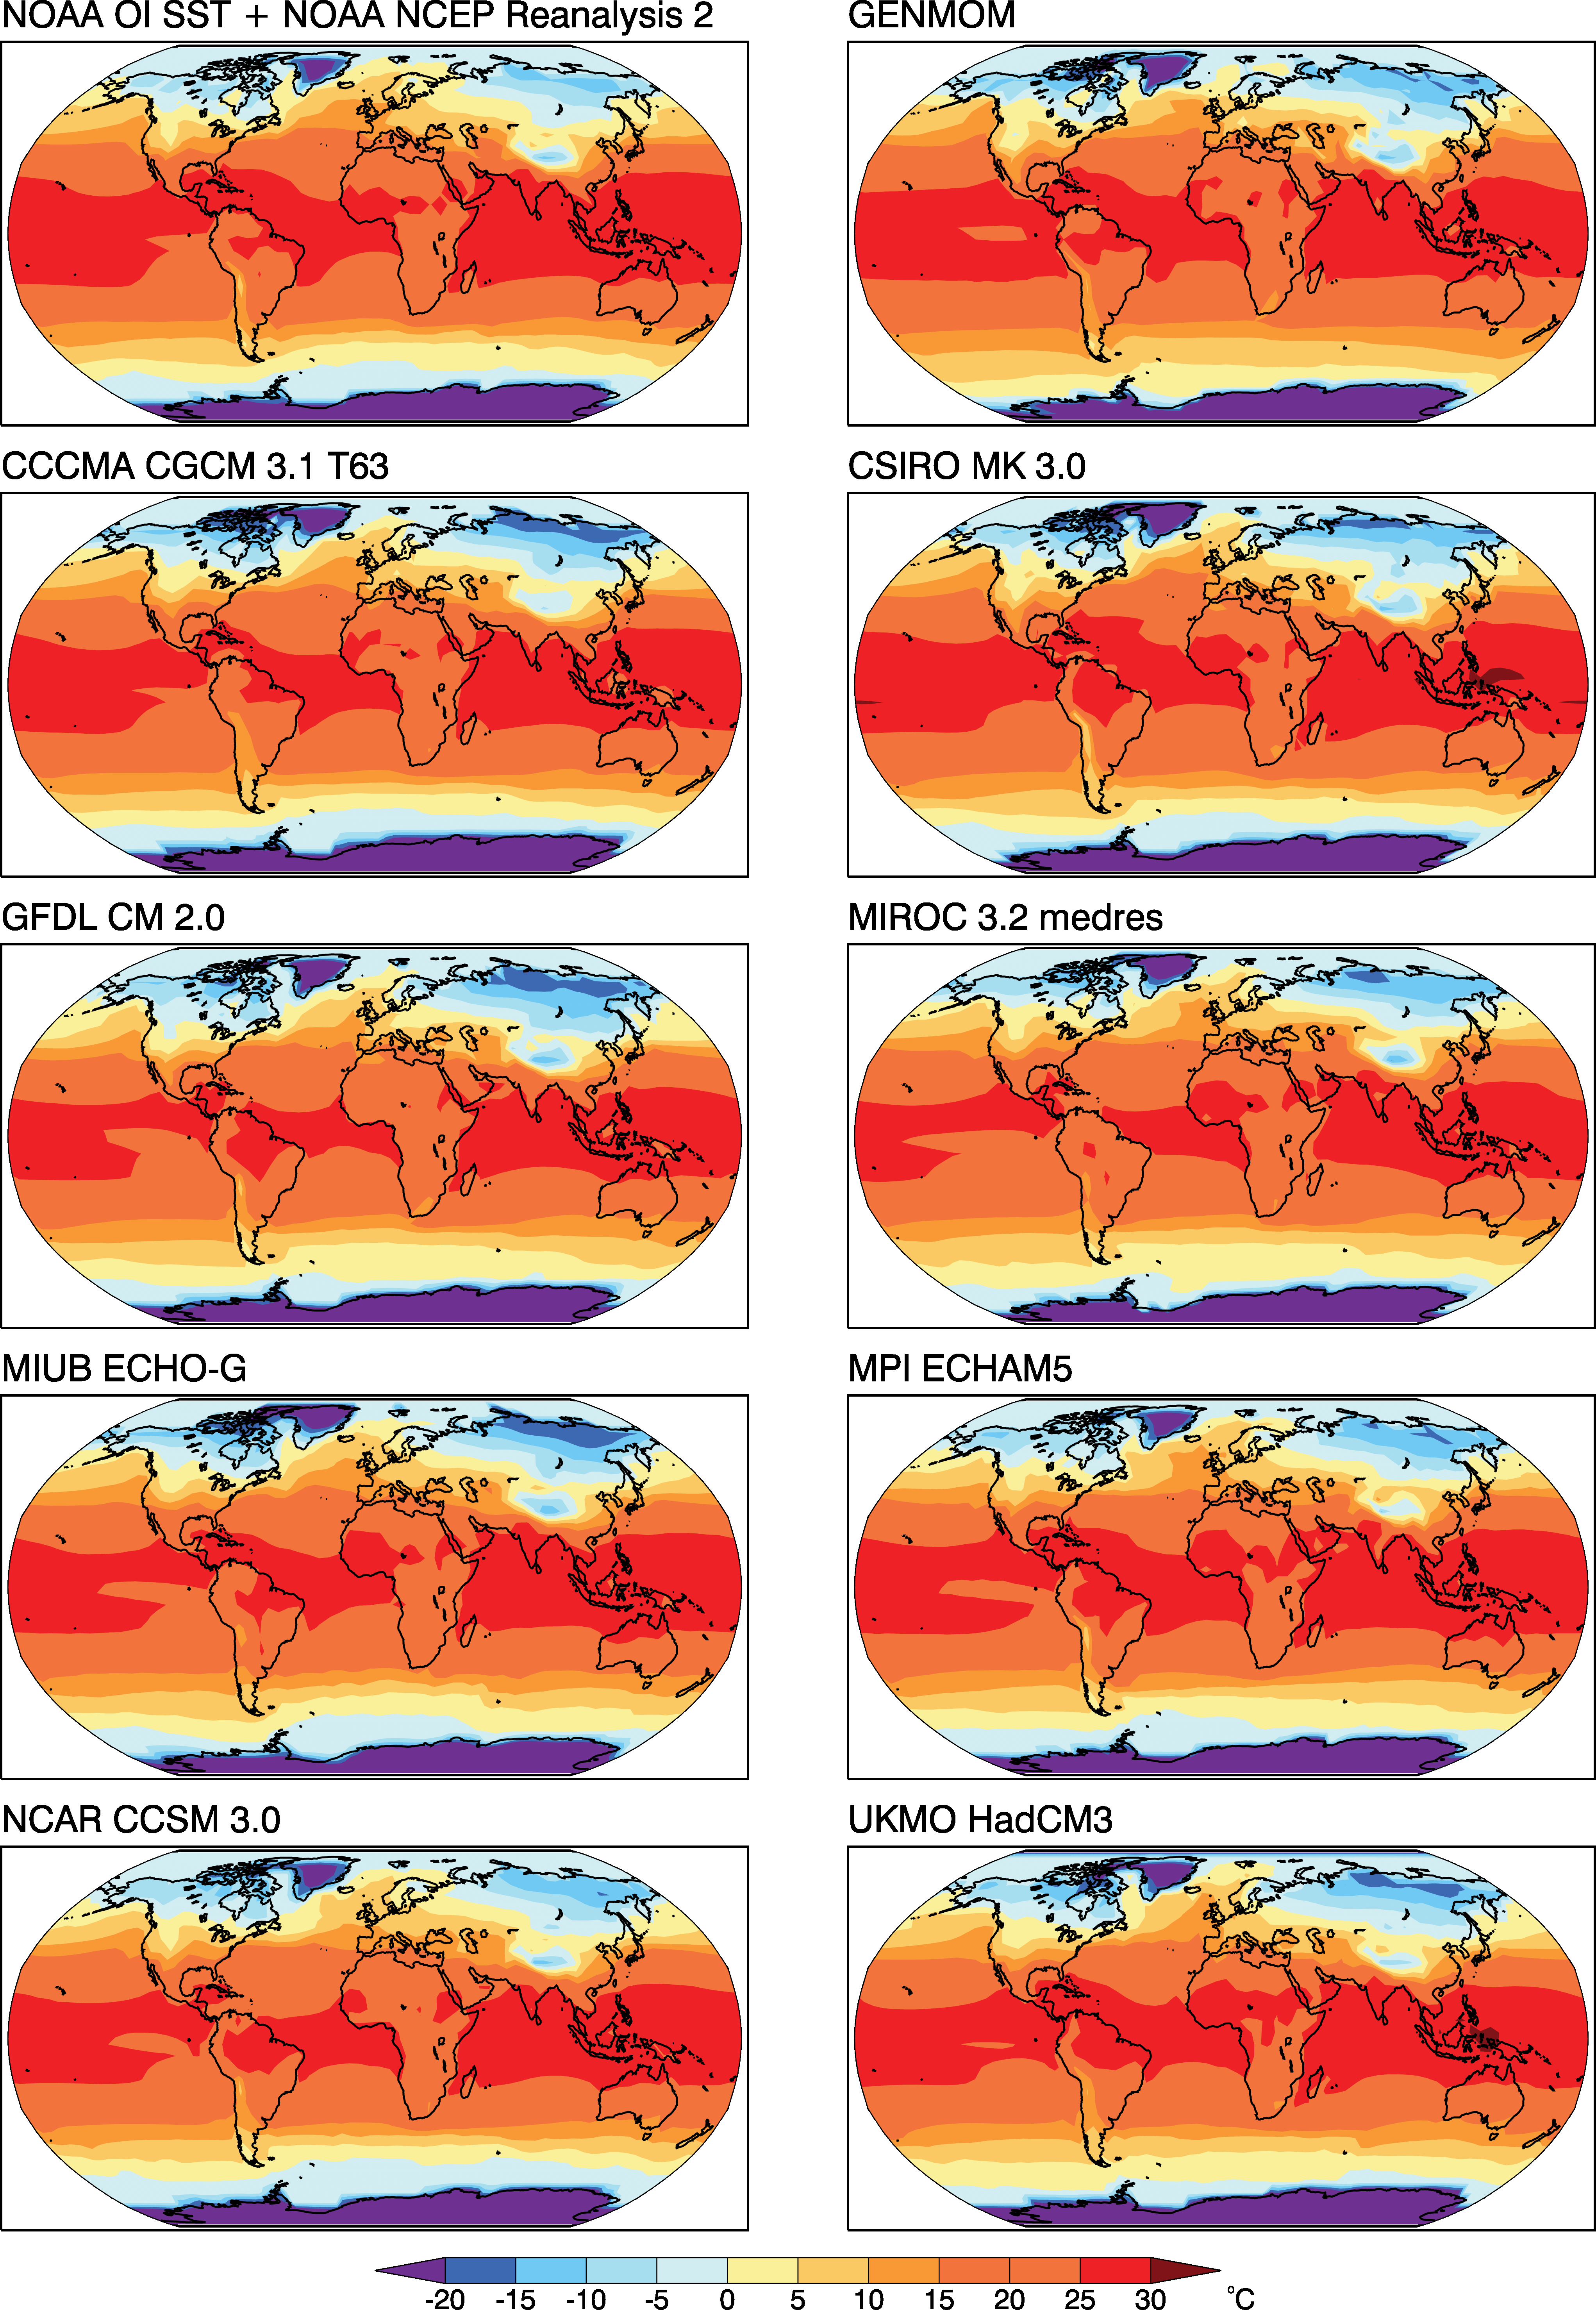
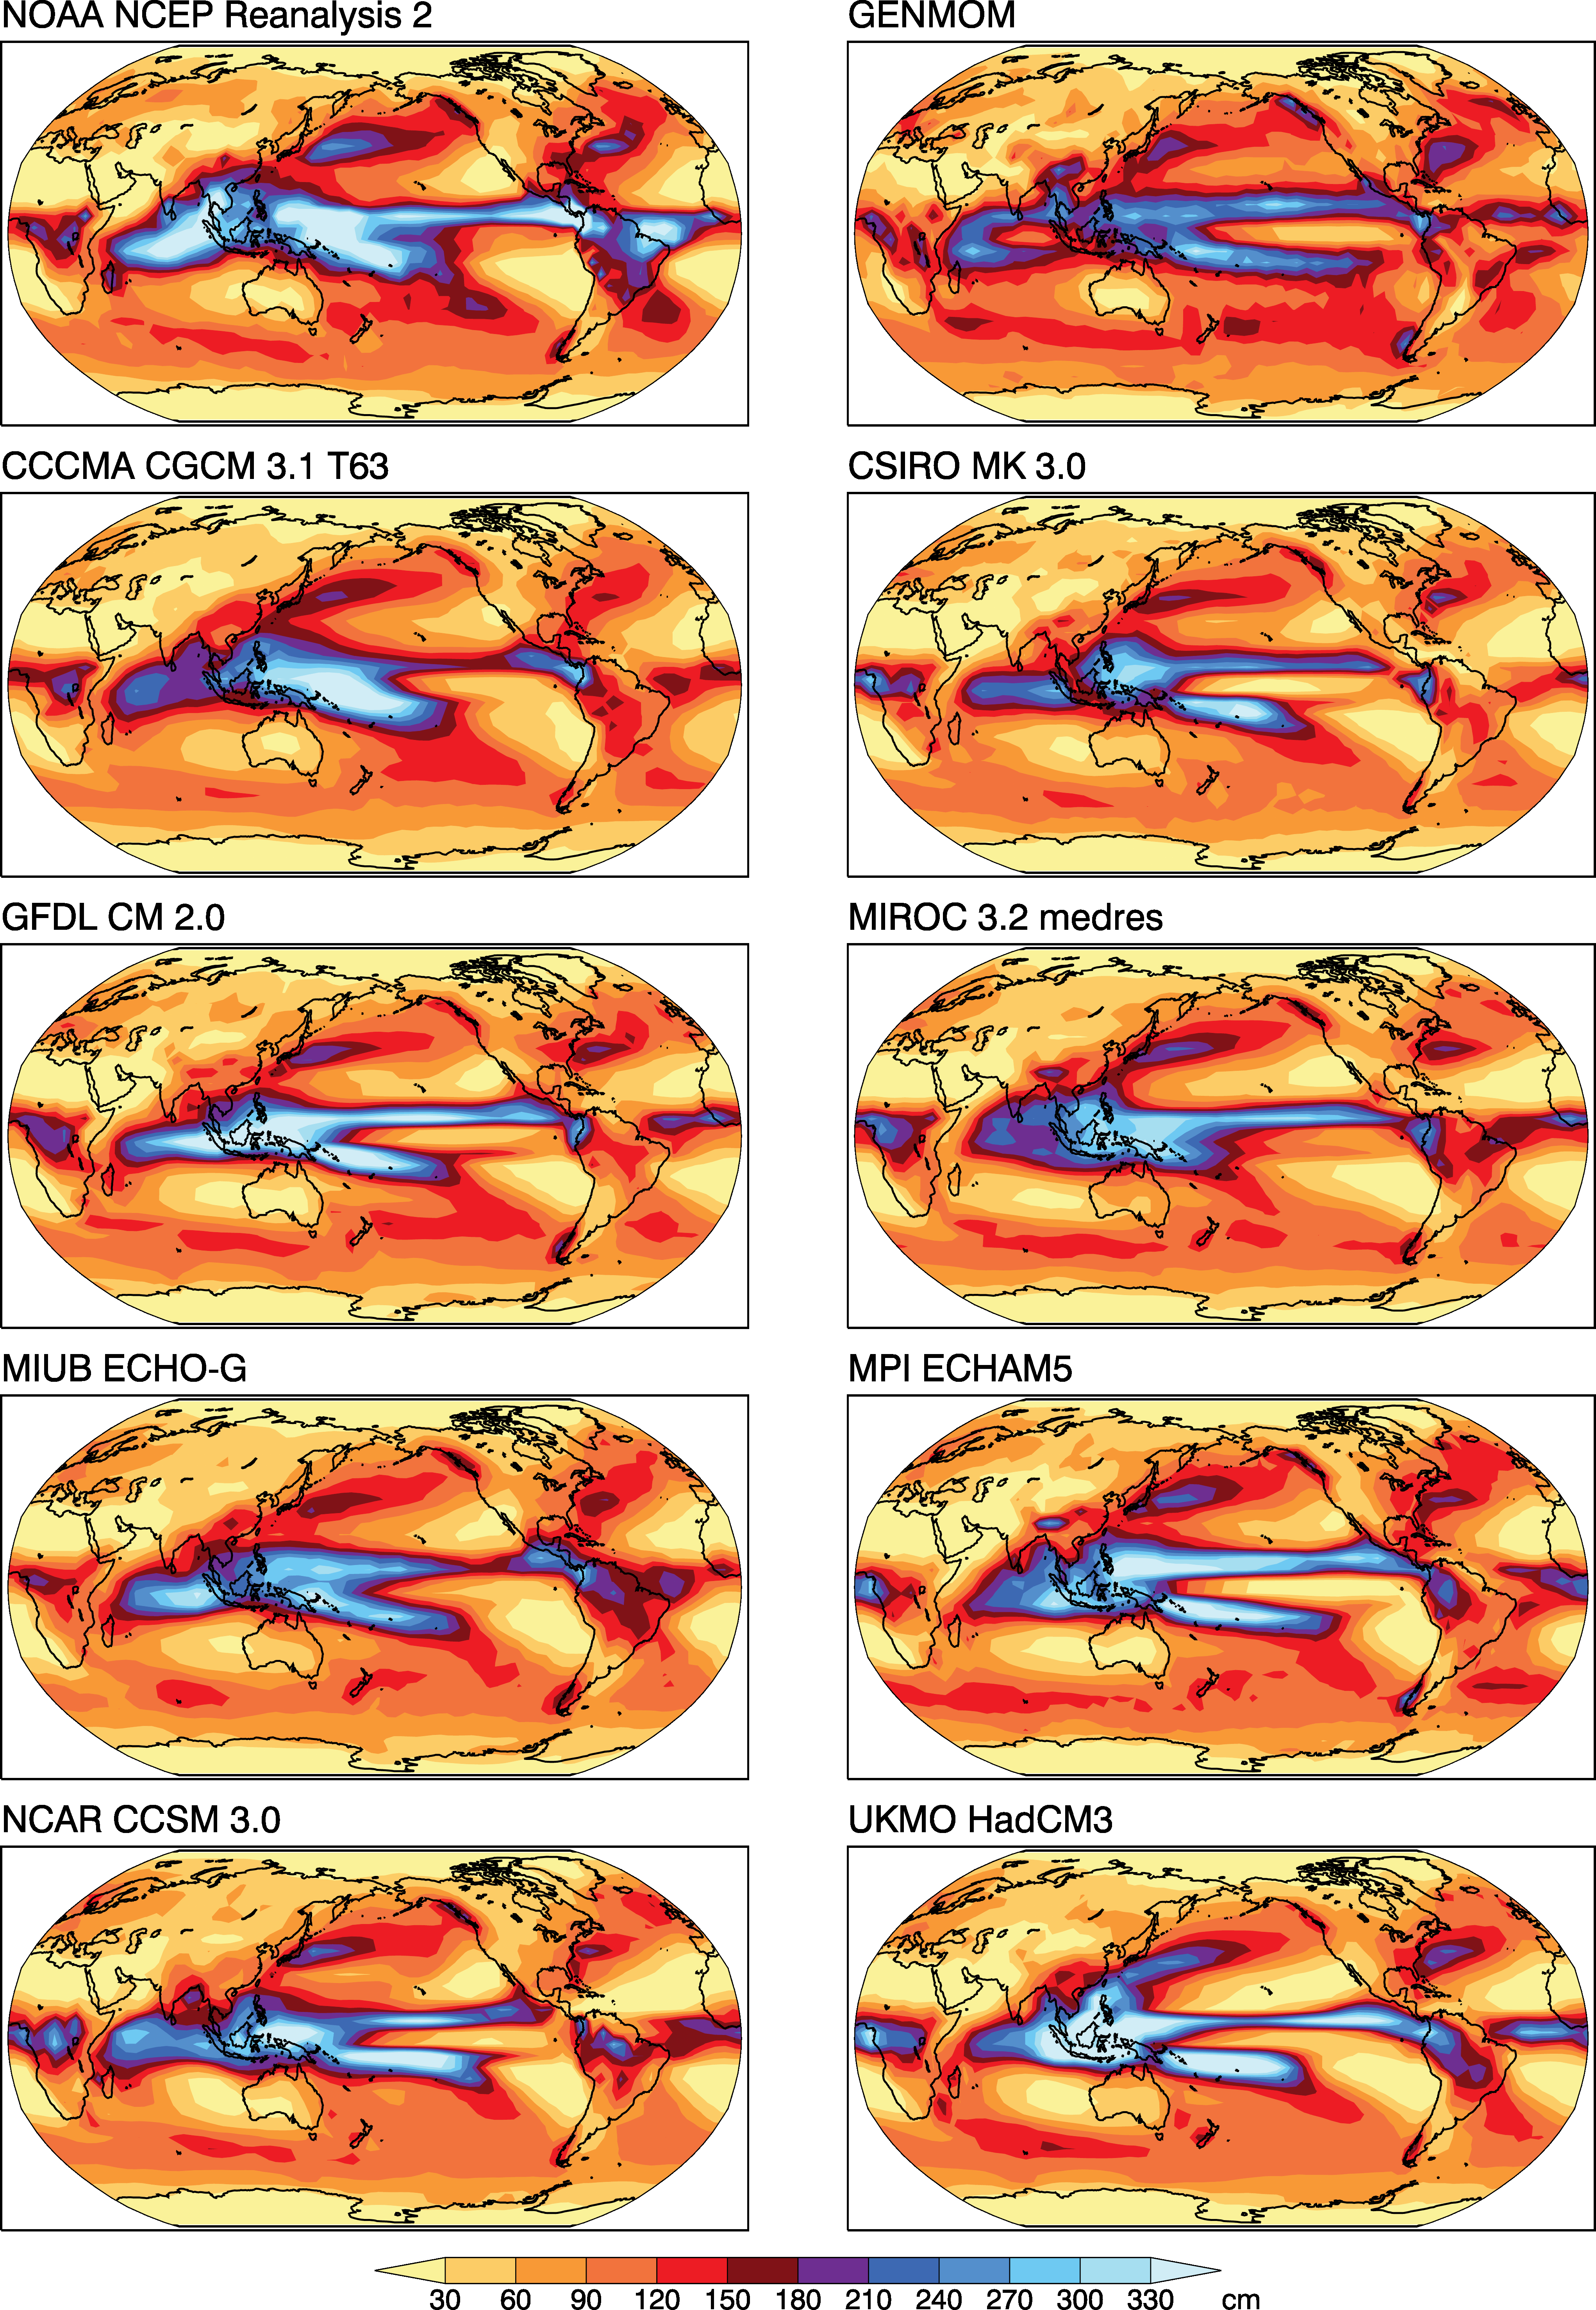
Figure 6. Mean annual precipitation climatologies simulated by GENMOM and a selected subgroup of eight global climate models used in the IPCC AR4 compared with the NOAA NCEP Reanalysis II (upper left) climatology. Model names are given in figure 4.
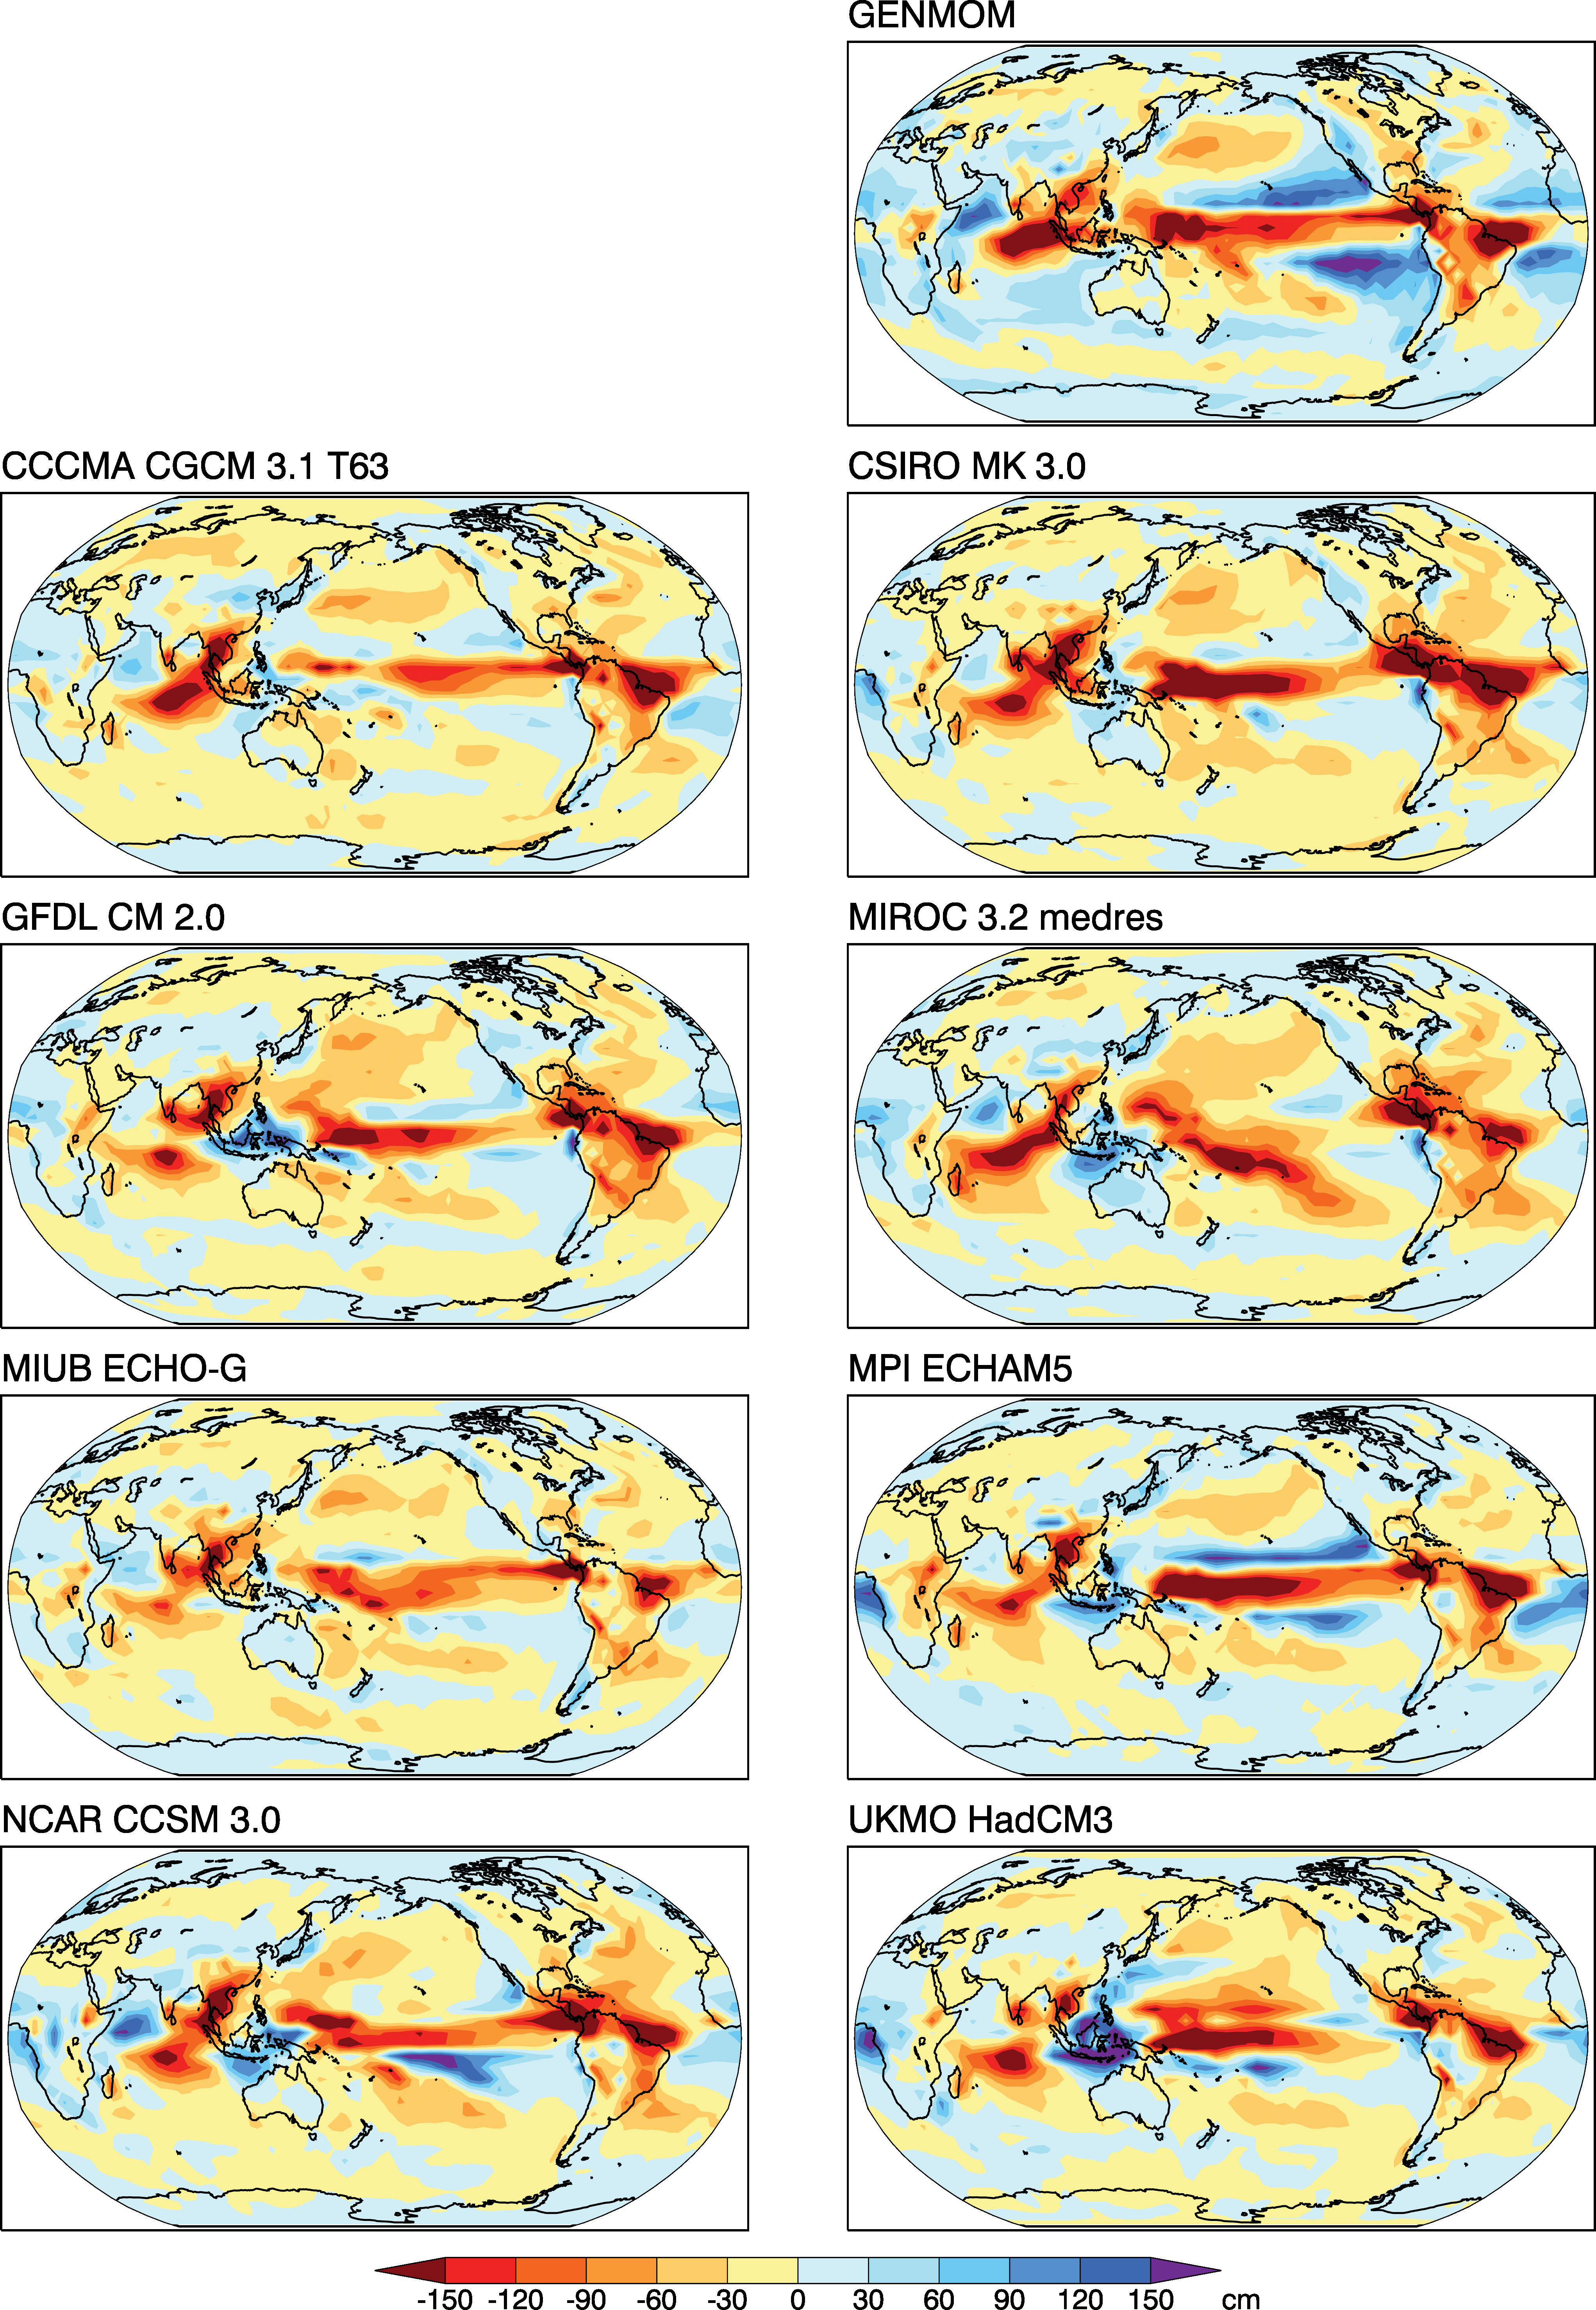
Figure 7. Differences (anomalies) between the simulated mean annual precipitation climatologies and the NOAA NCEP Reanalysis II for GENMOM and a selected subgroup of eight global climate models used in the IPCC AR4. Model names are given in figure 4.
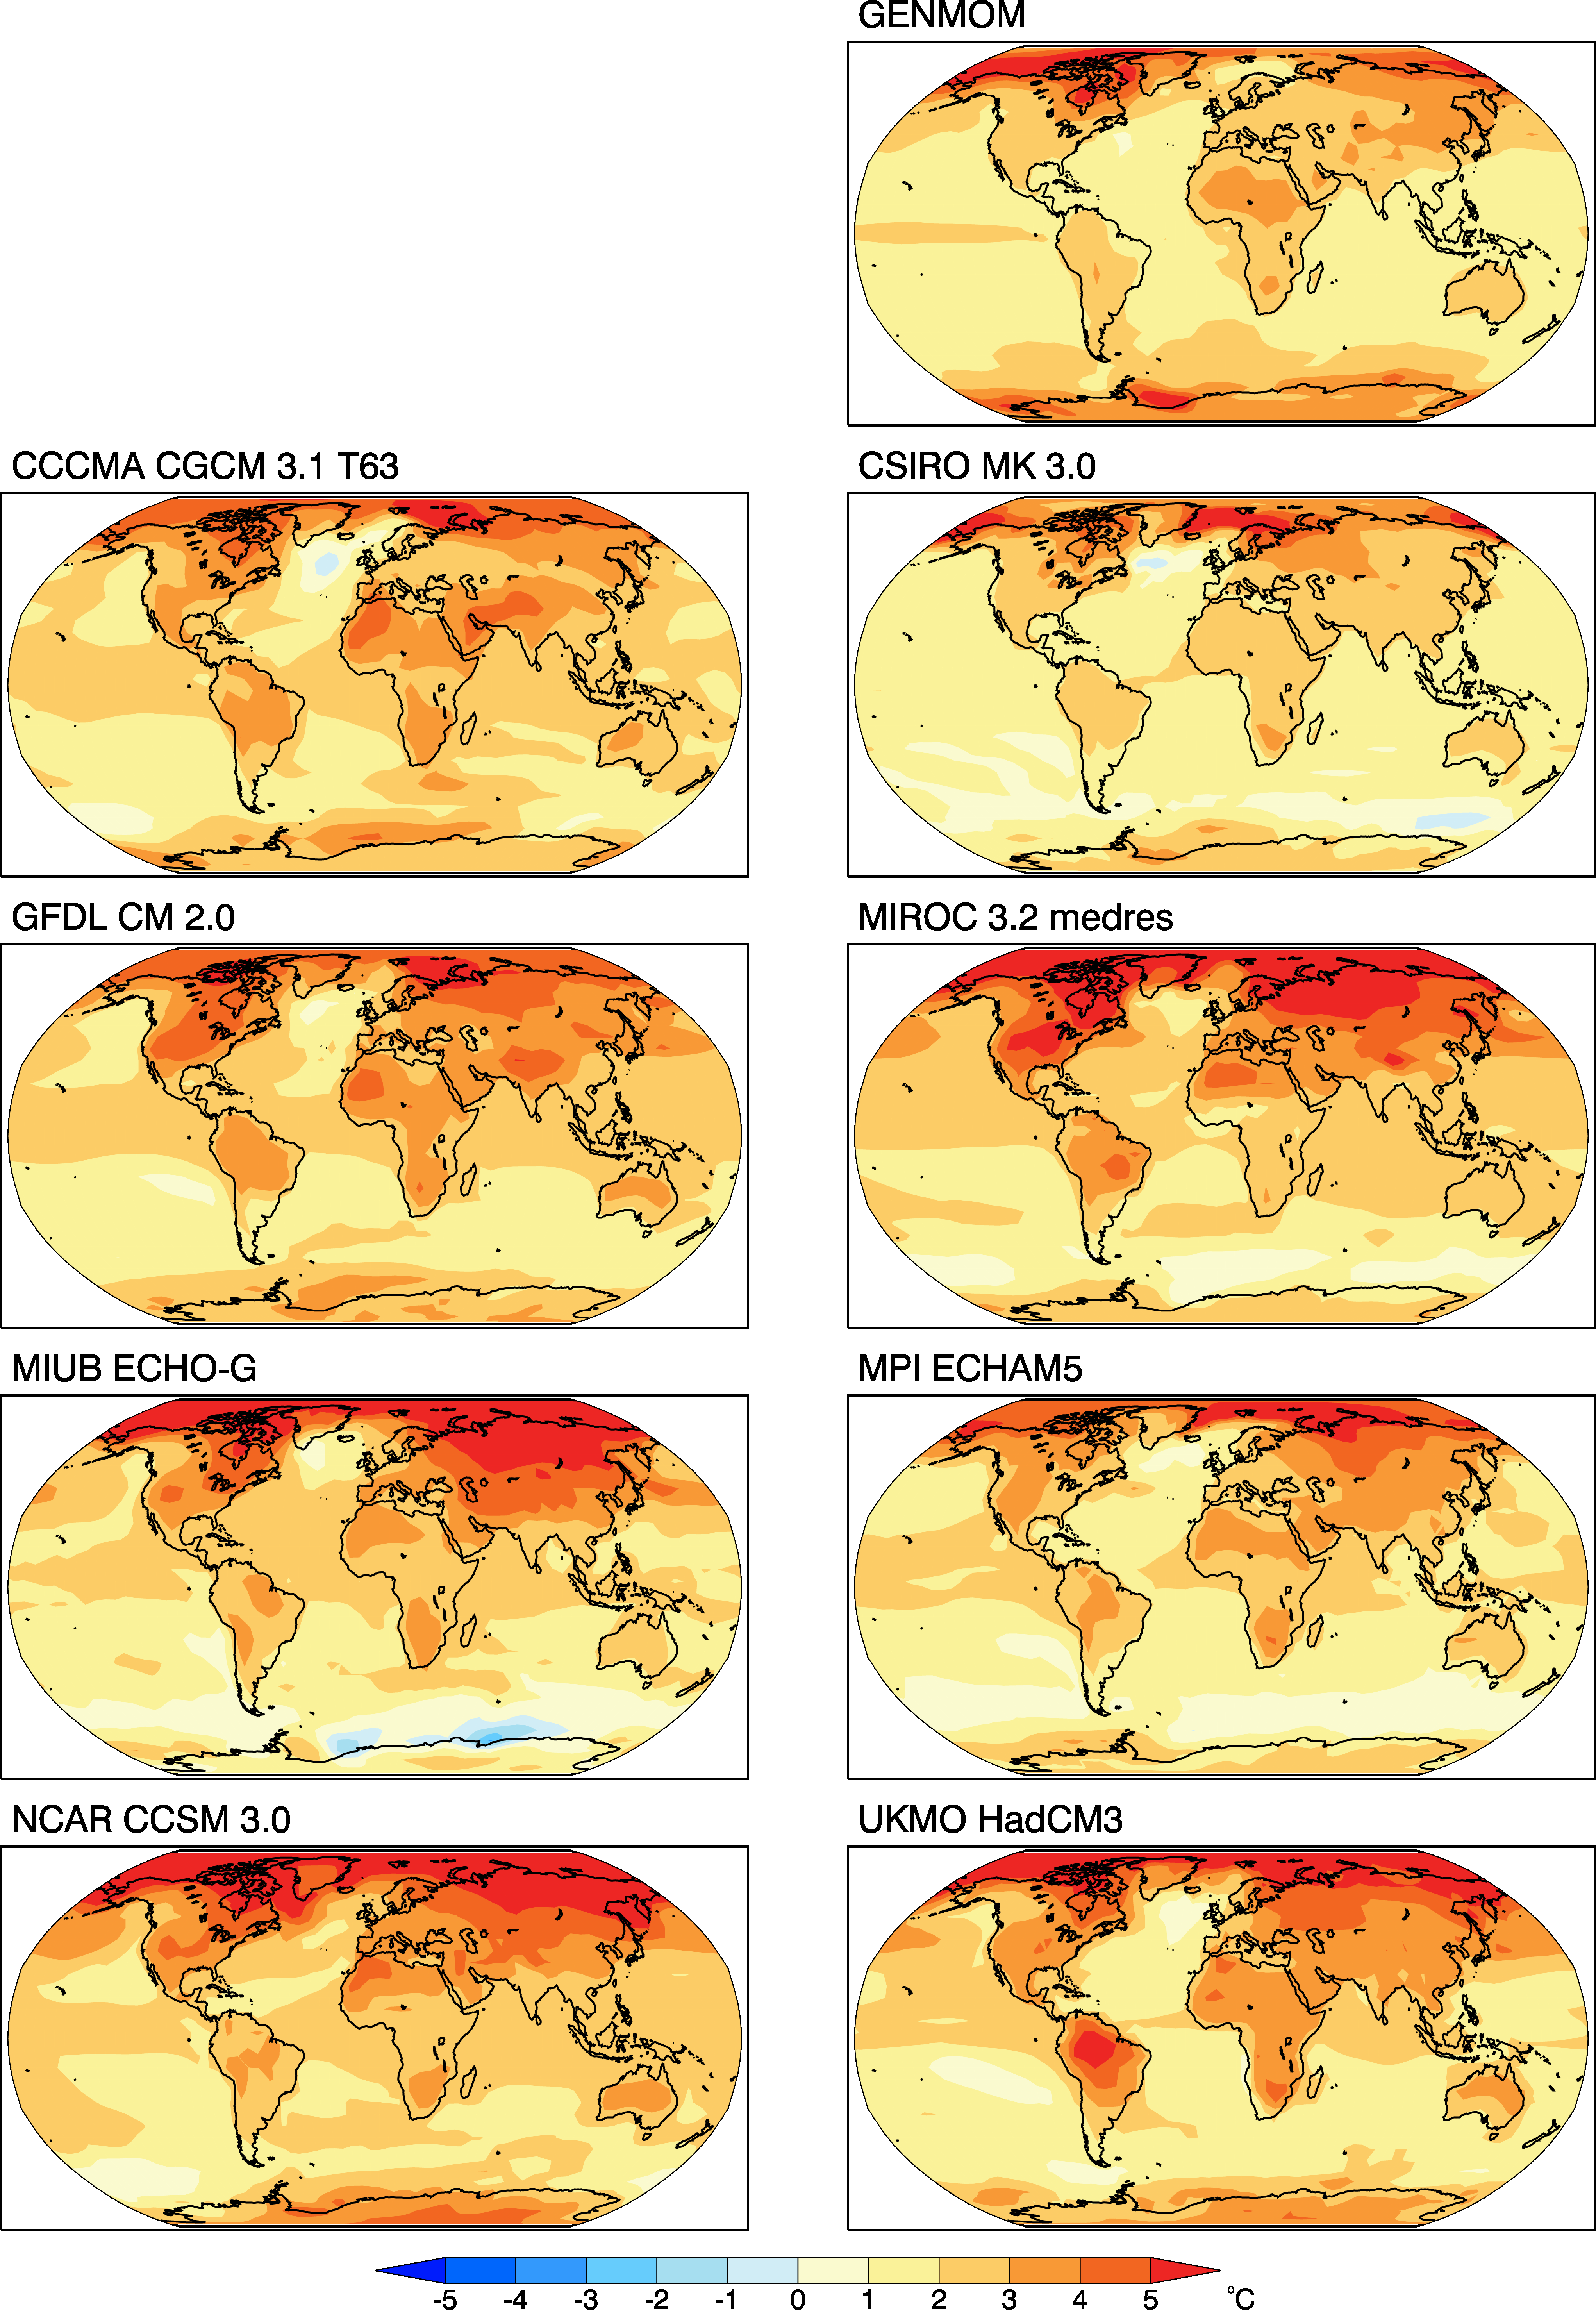
Figure 8. Mean annual 2-m temperature sensitivity to a doubling of atmospheric CO2 concentration in GENMOM and a selected subgroup of 8 global climate models used in the IPCC AR4. Model names are given in figure 4.
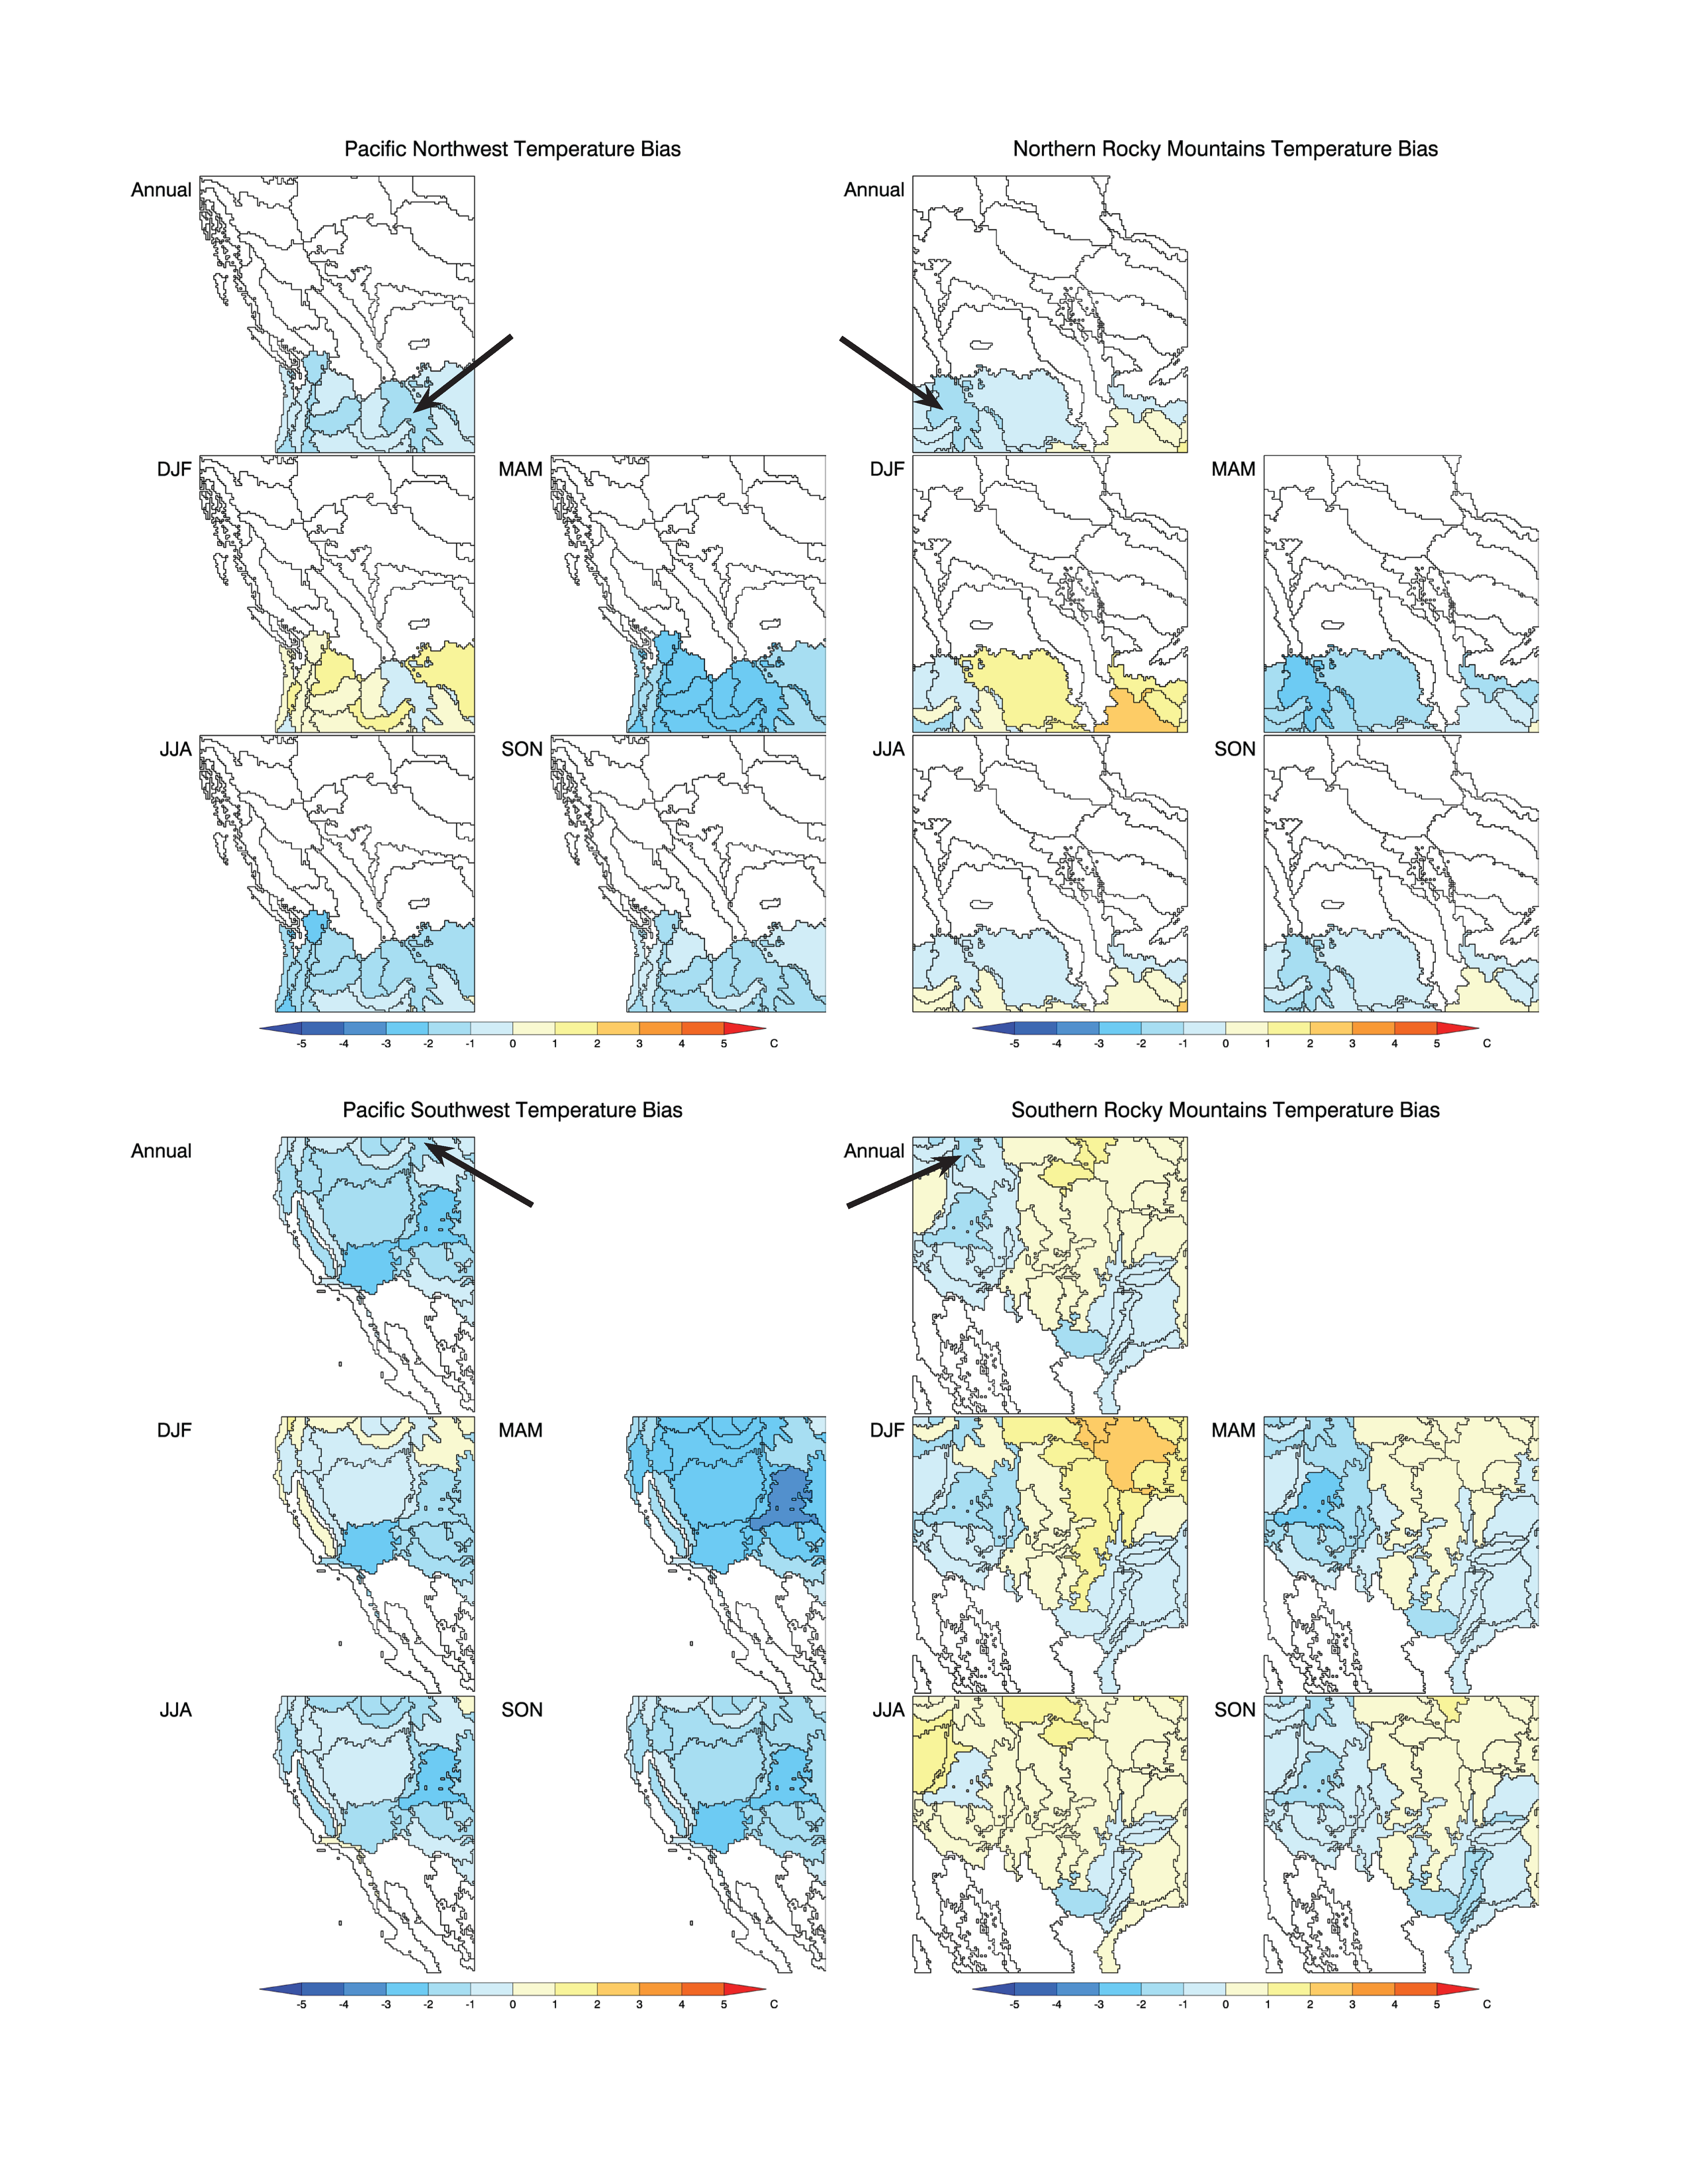
Figure 9. Annual and seasonal differences (biases) between simulated 2-m air temperatures and PRISM values averaged over the EPA Level III ecoregions for the WNA domains.
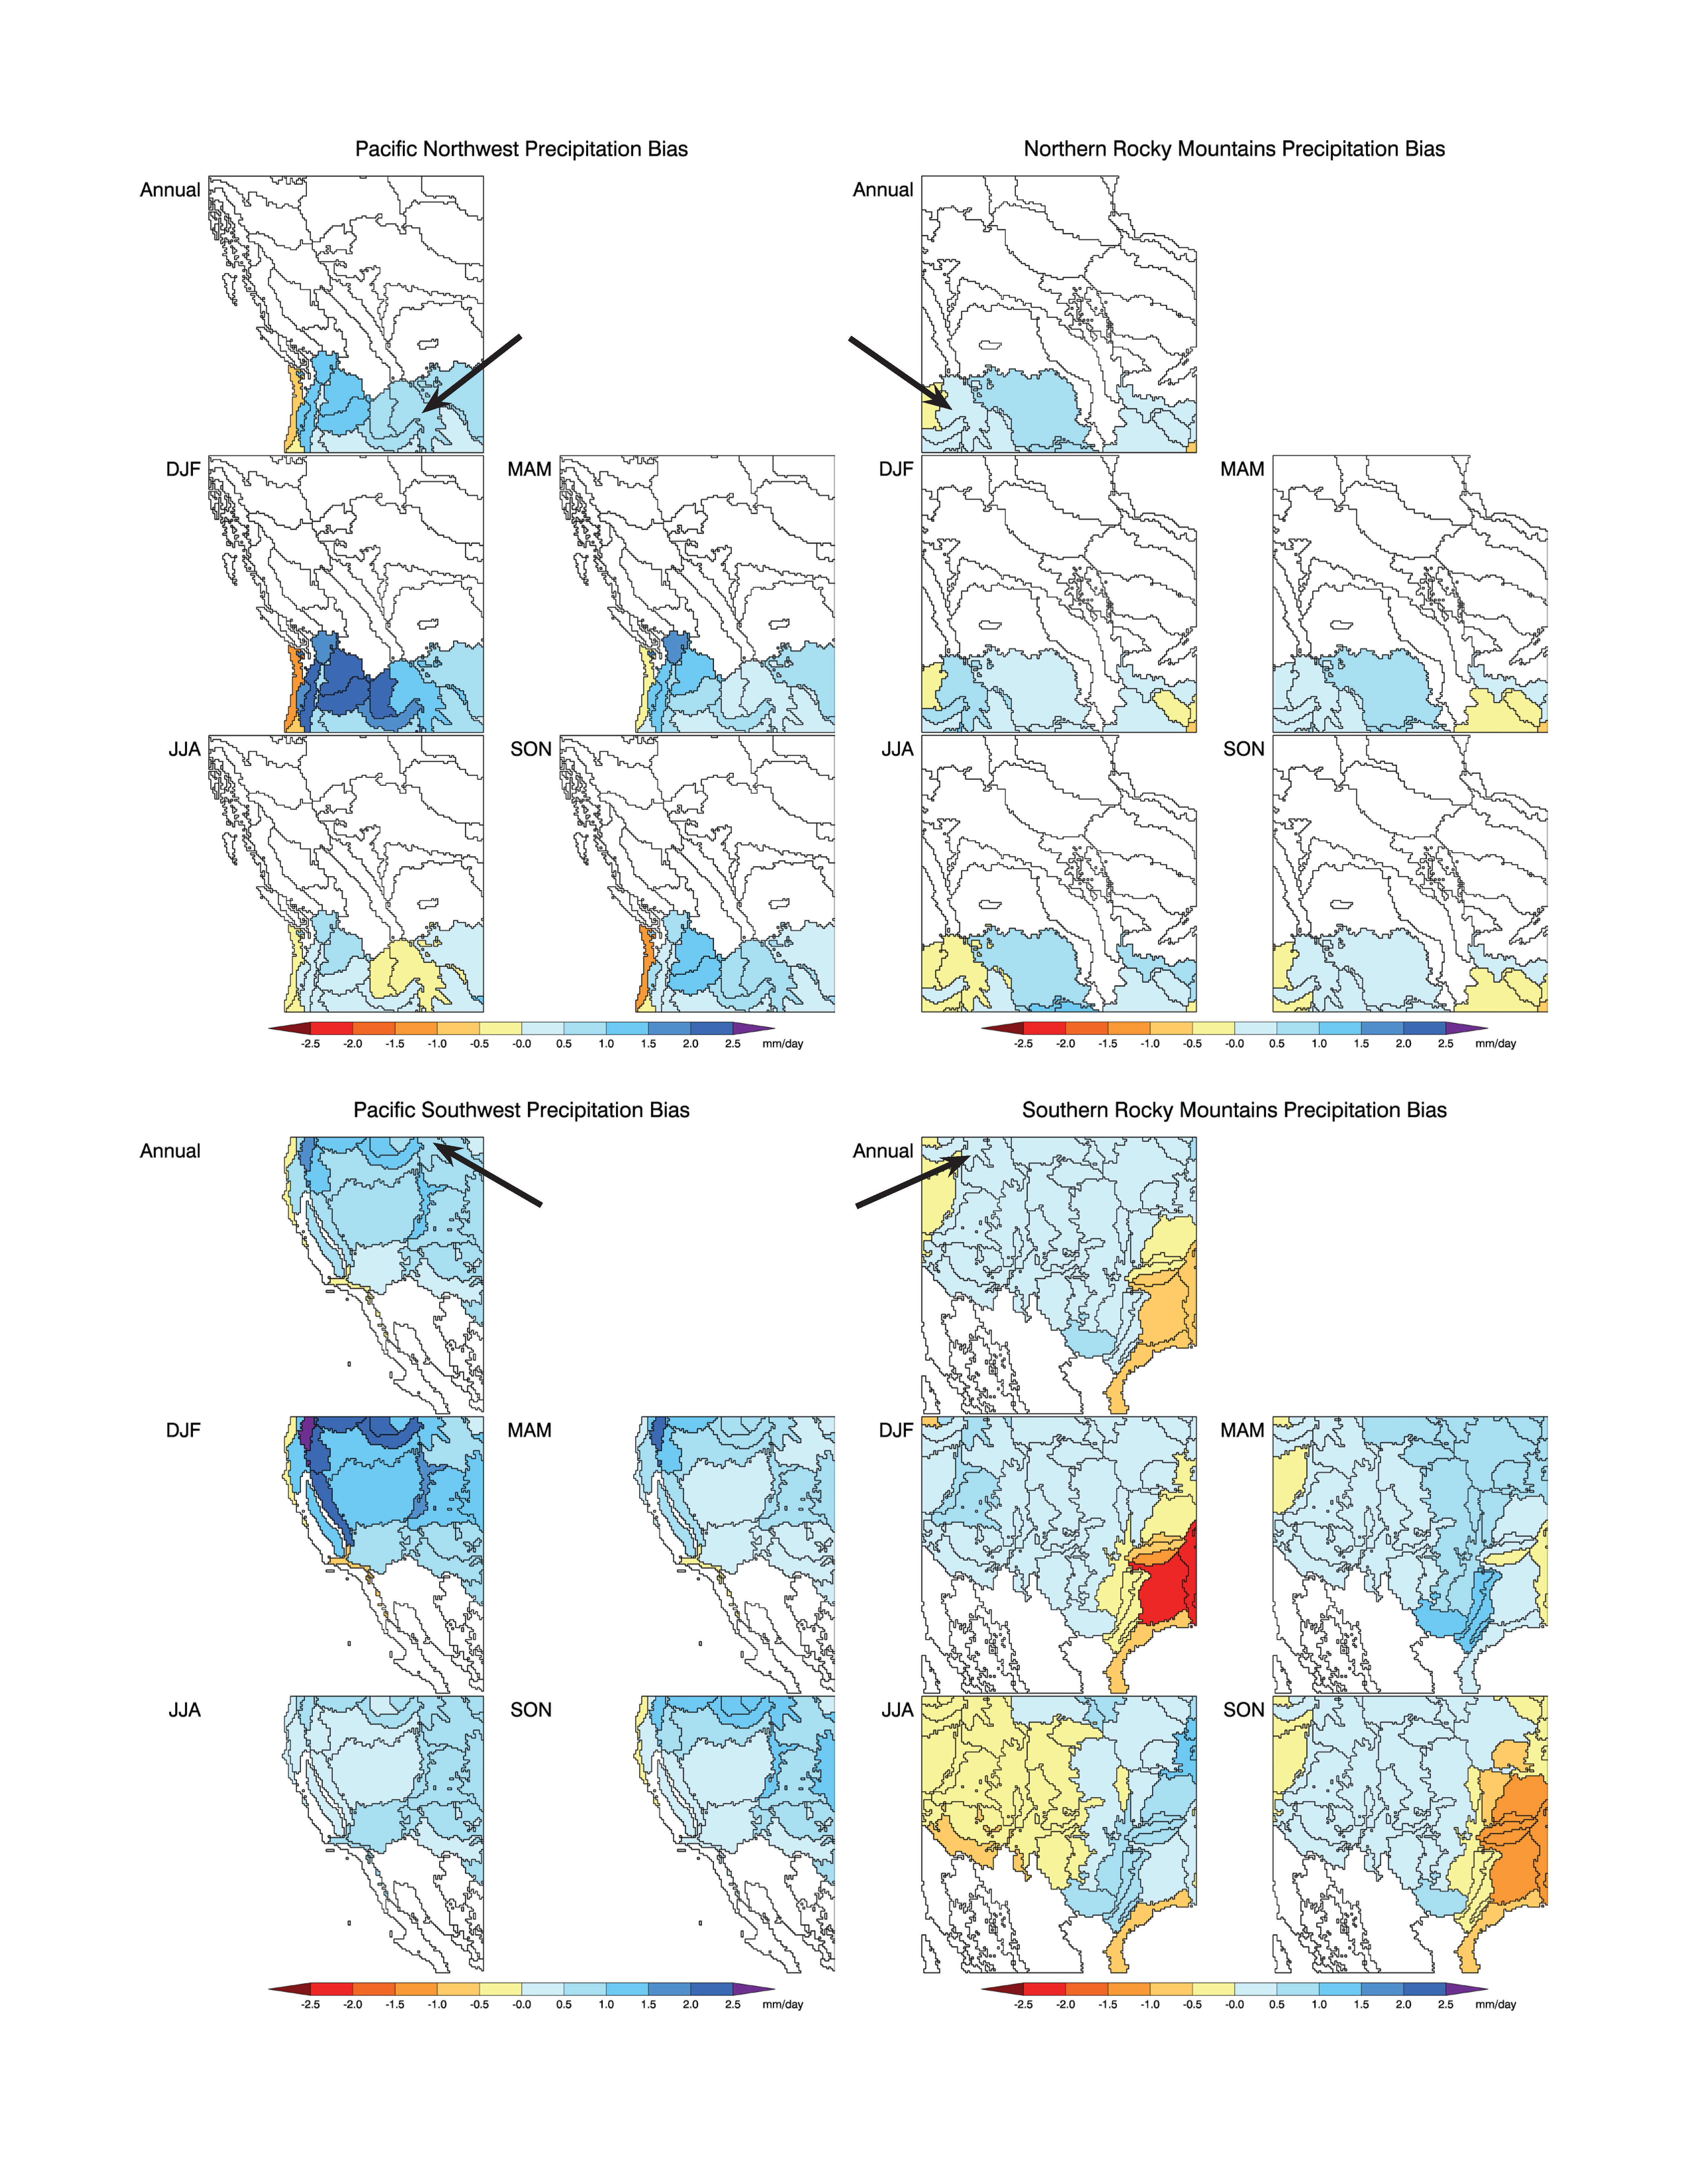
Figure 10. Annual and seasonal differences (biases) between simulated precipitation rates and PRISM values averaged over the EPA Level III ecoregions for the WNA domains.
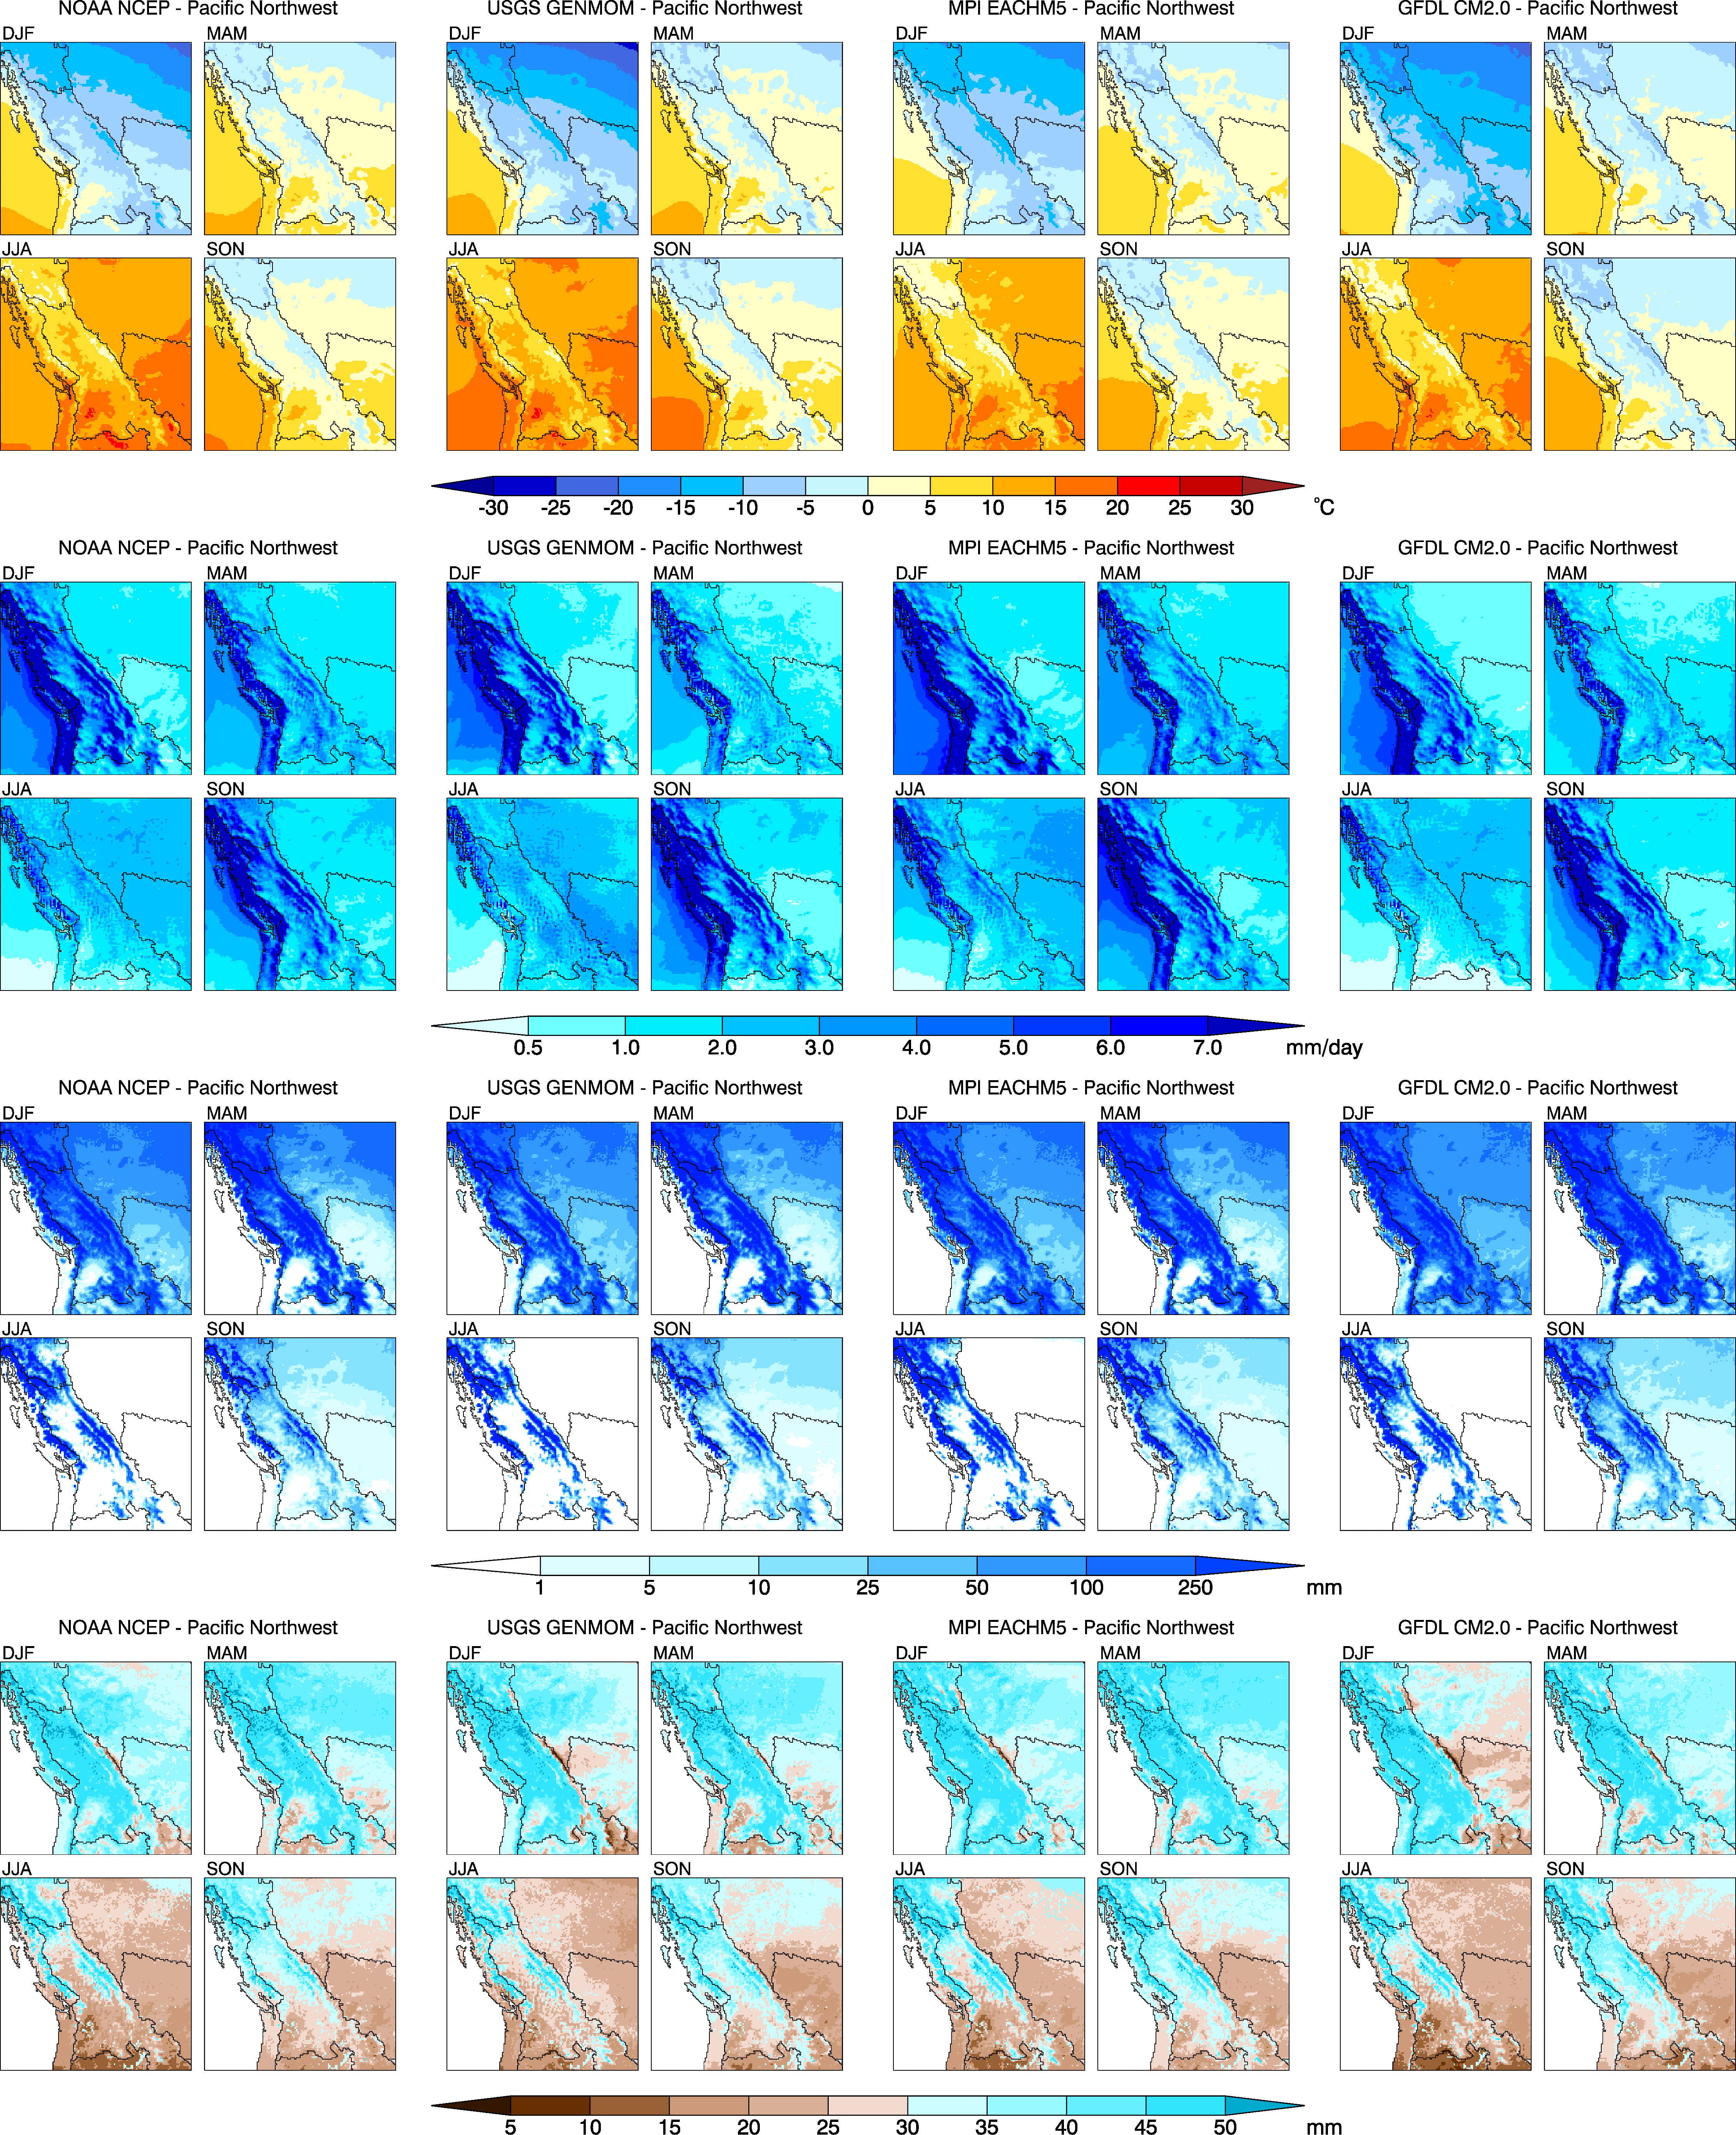
Figure 11. Seasonal average climatologies (averaging period is 1985–1999) over the PNW domain for the four RegCM3 simulations.
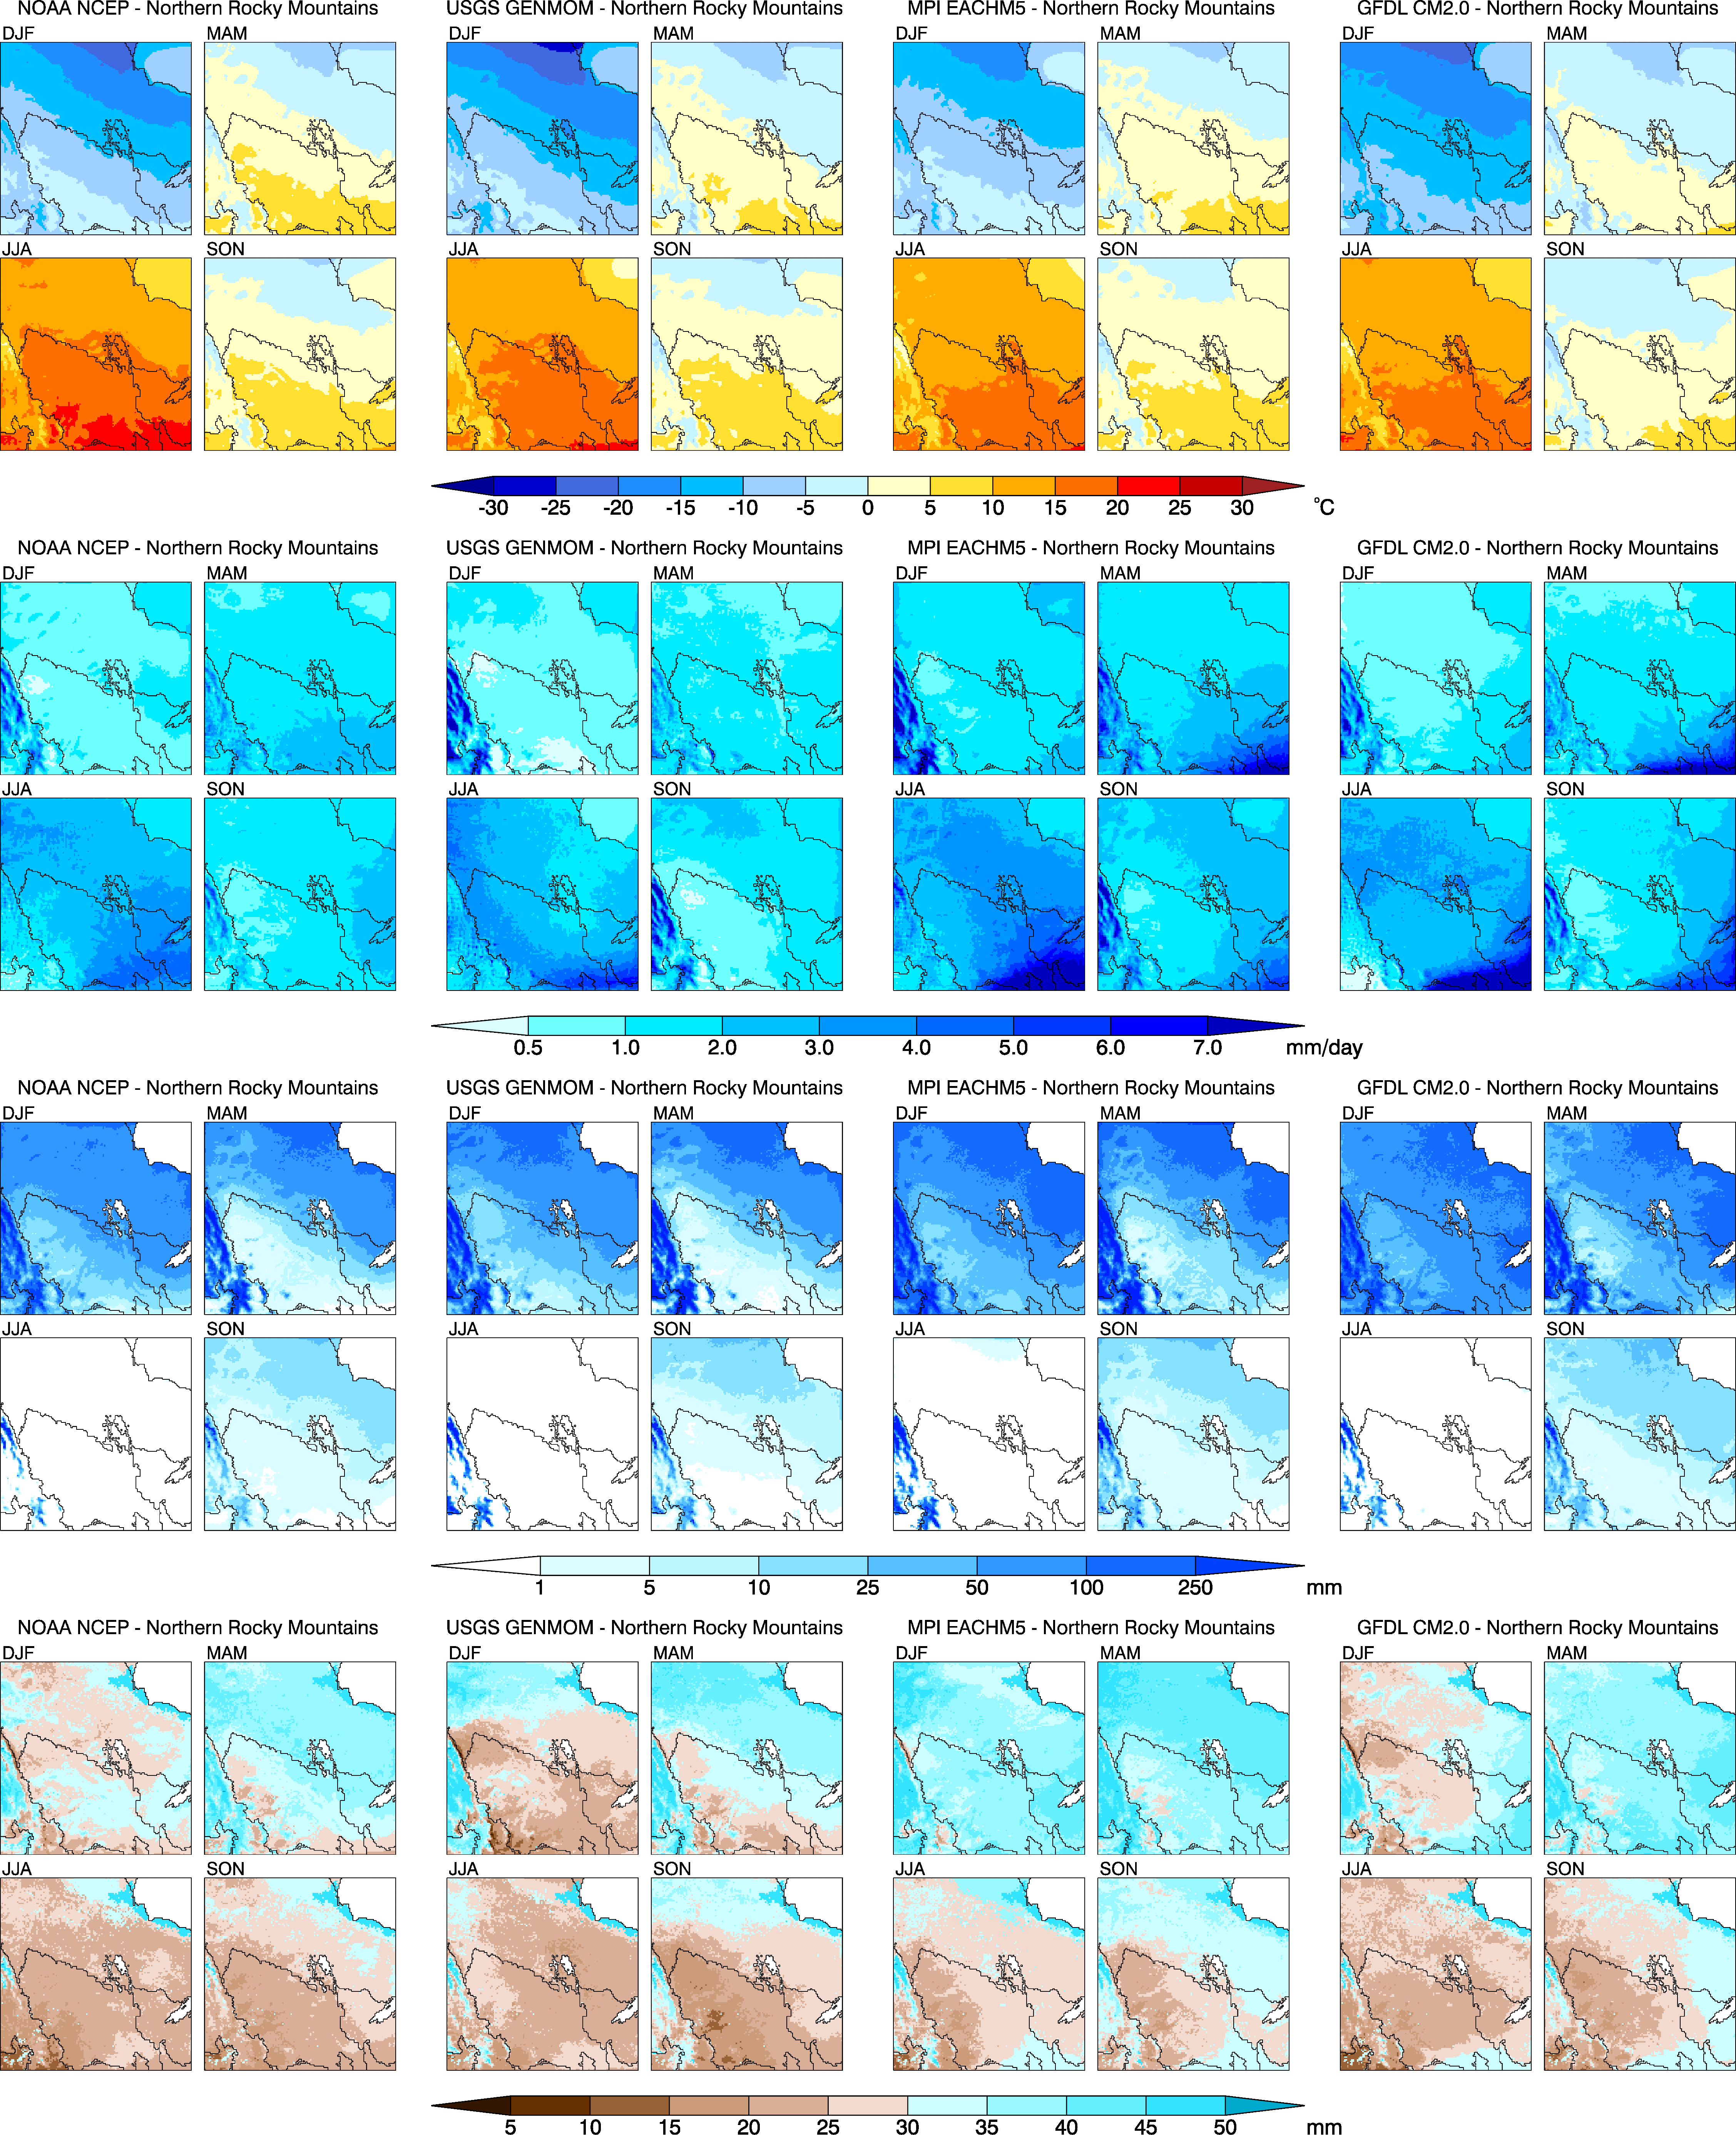
Figure 12. Seasonal average climatologies (averaging period is 1985–1999) over the NRM domain for the four RegCM3 simulations.
Figure 13. Seasonal average climatologies (averaging period is 1985–1999) over the SRM domain for the four RegCM3 simulations.
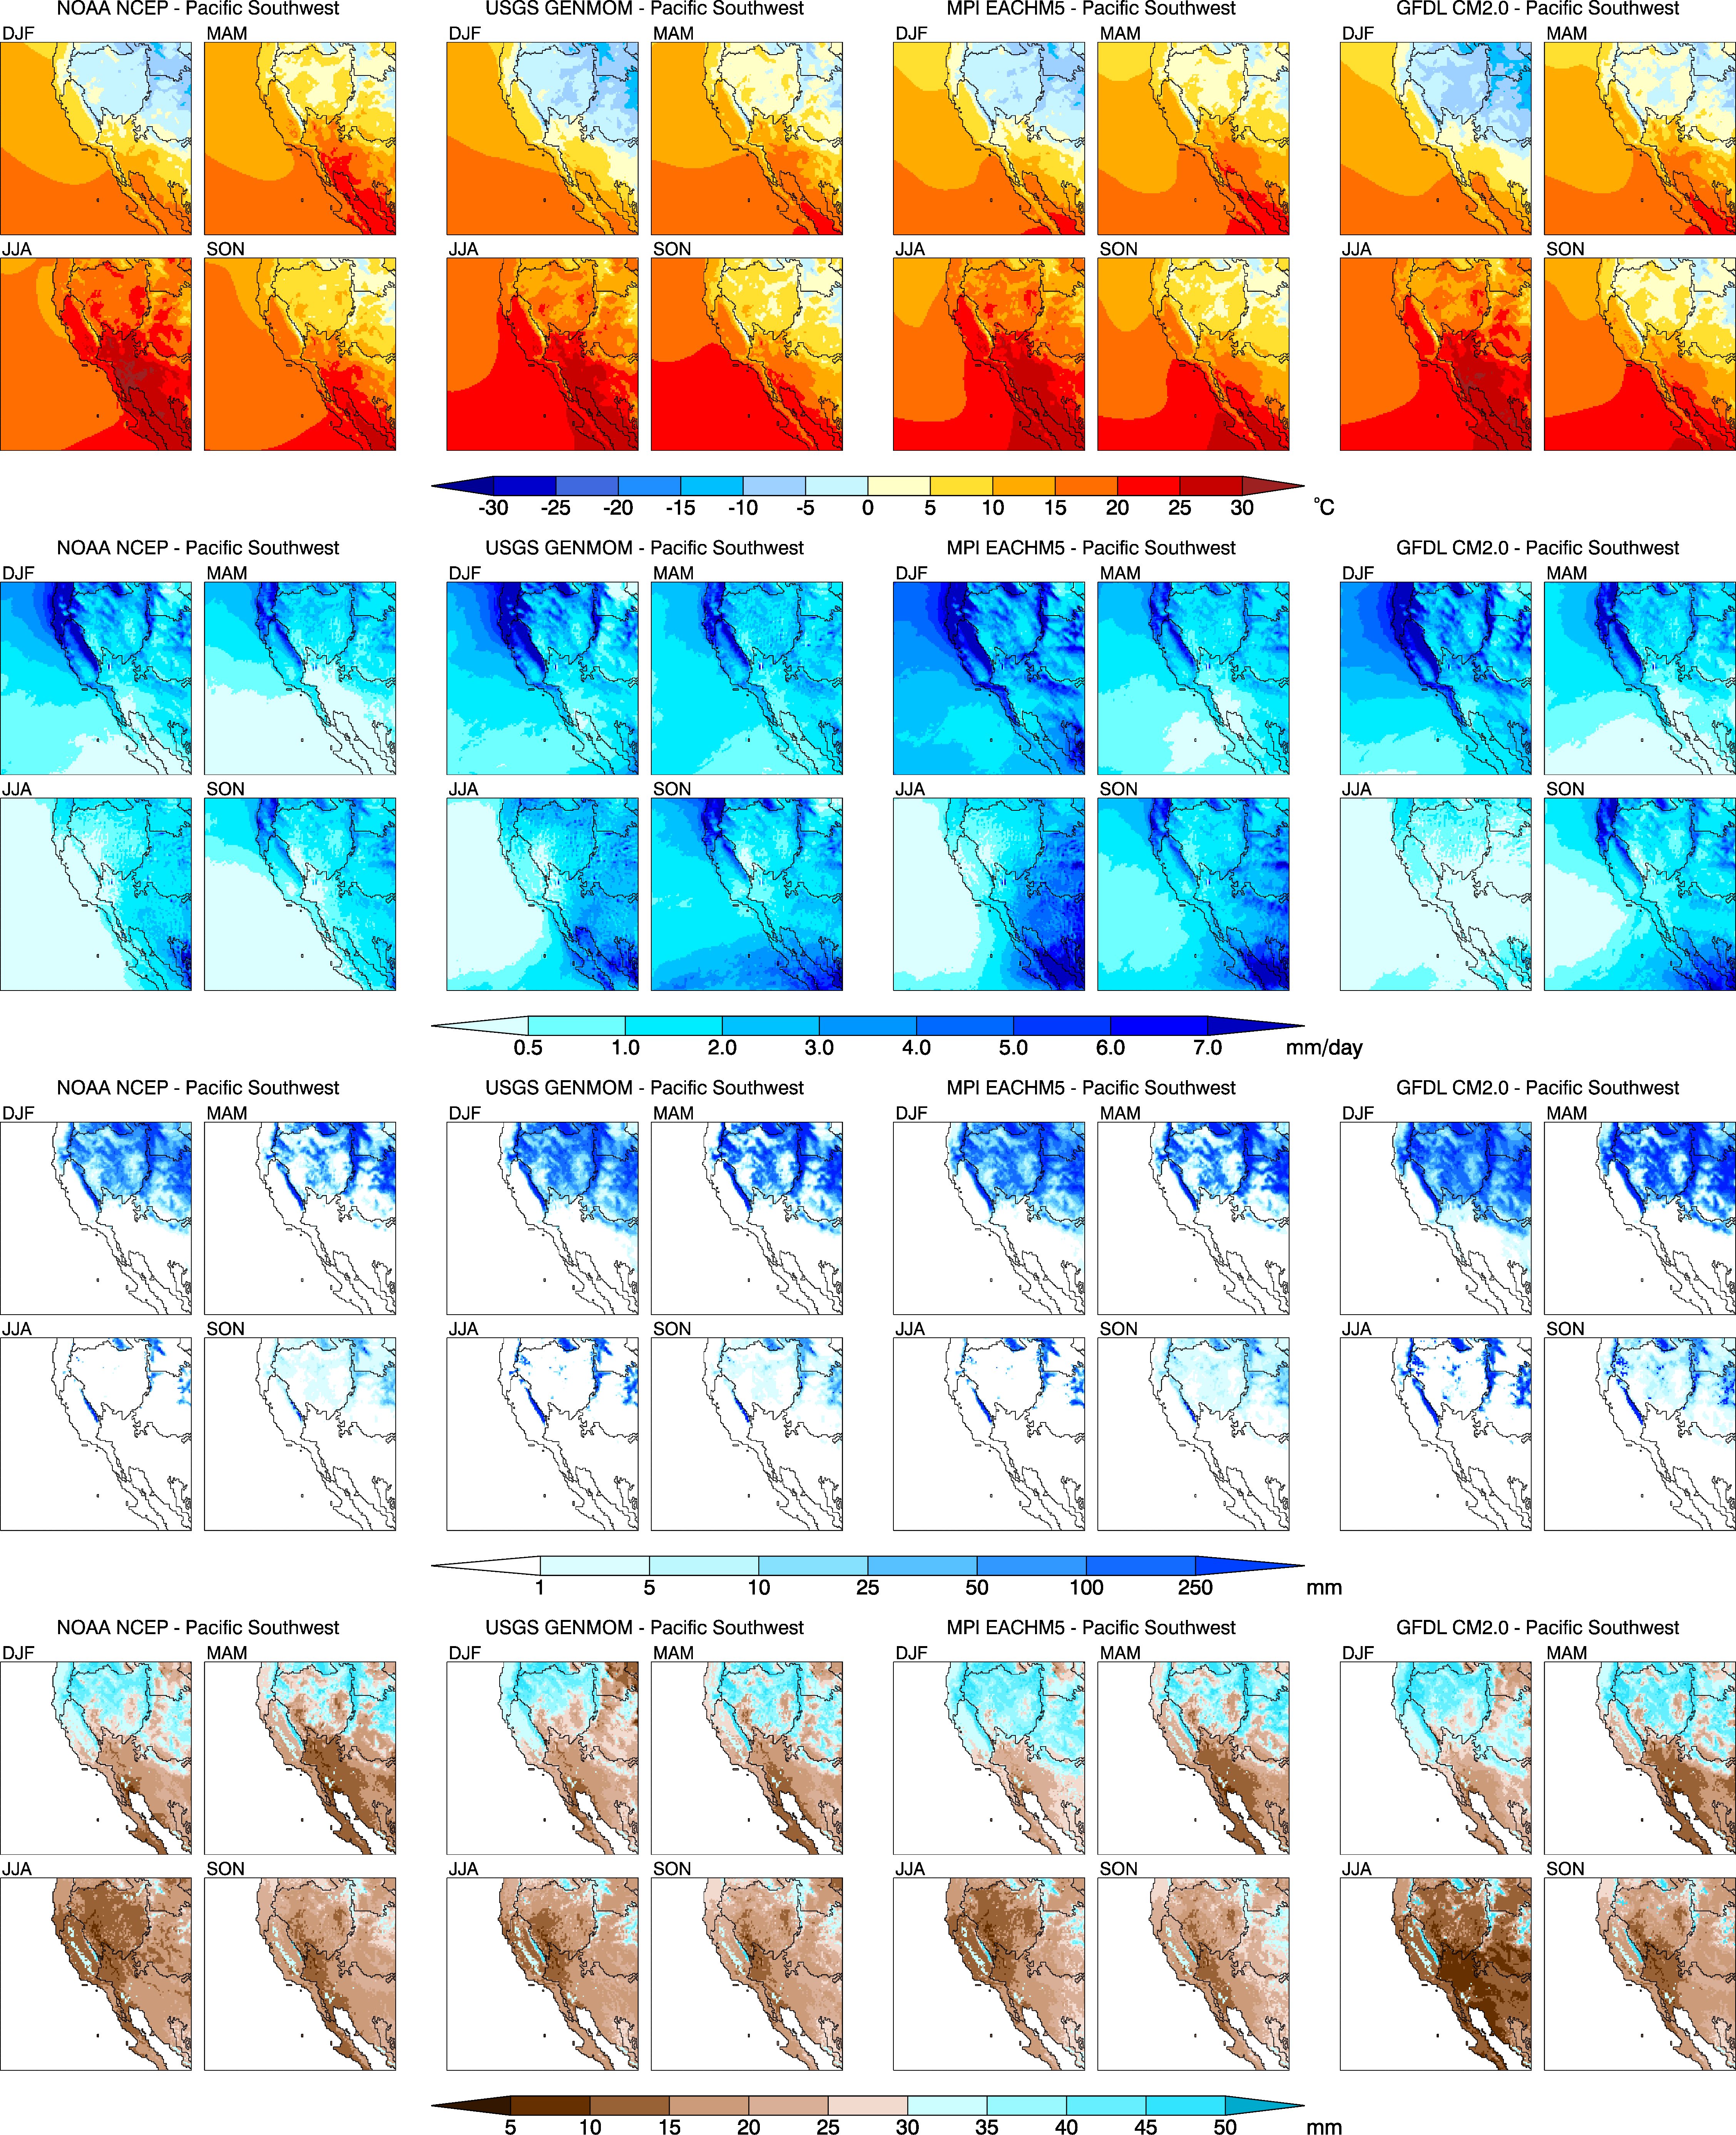
Figure 14. Seasonal average climatologies (averaging period is 1985–1999) over the PSW domain for the four RegCM3 simulations.
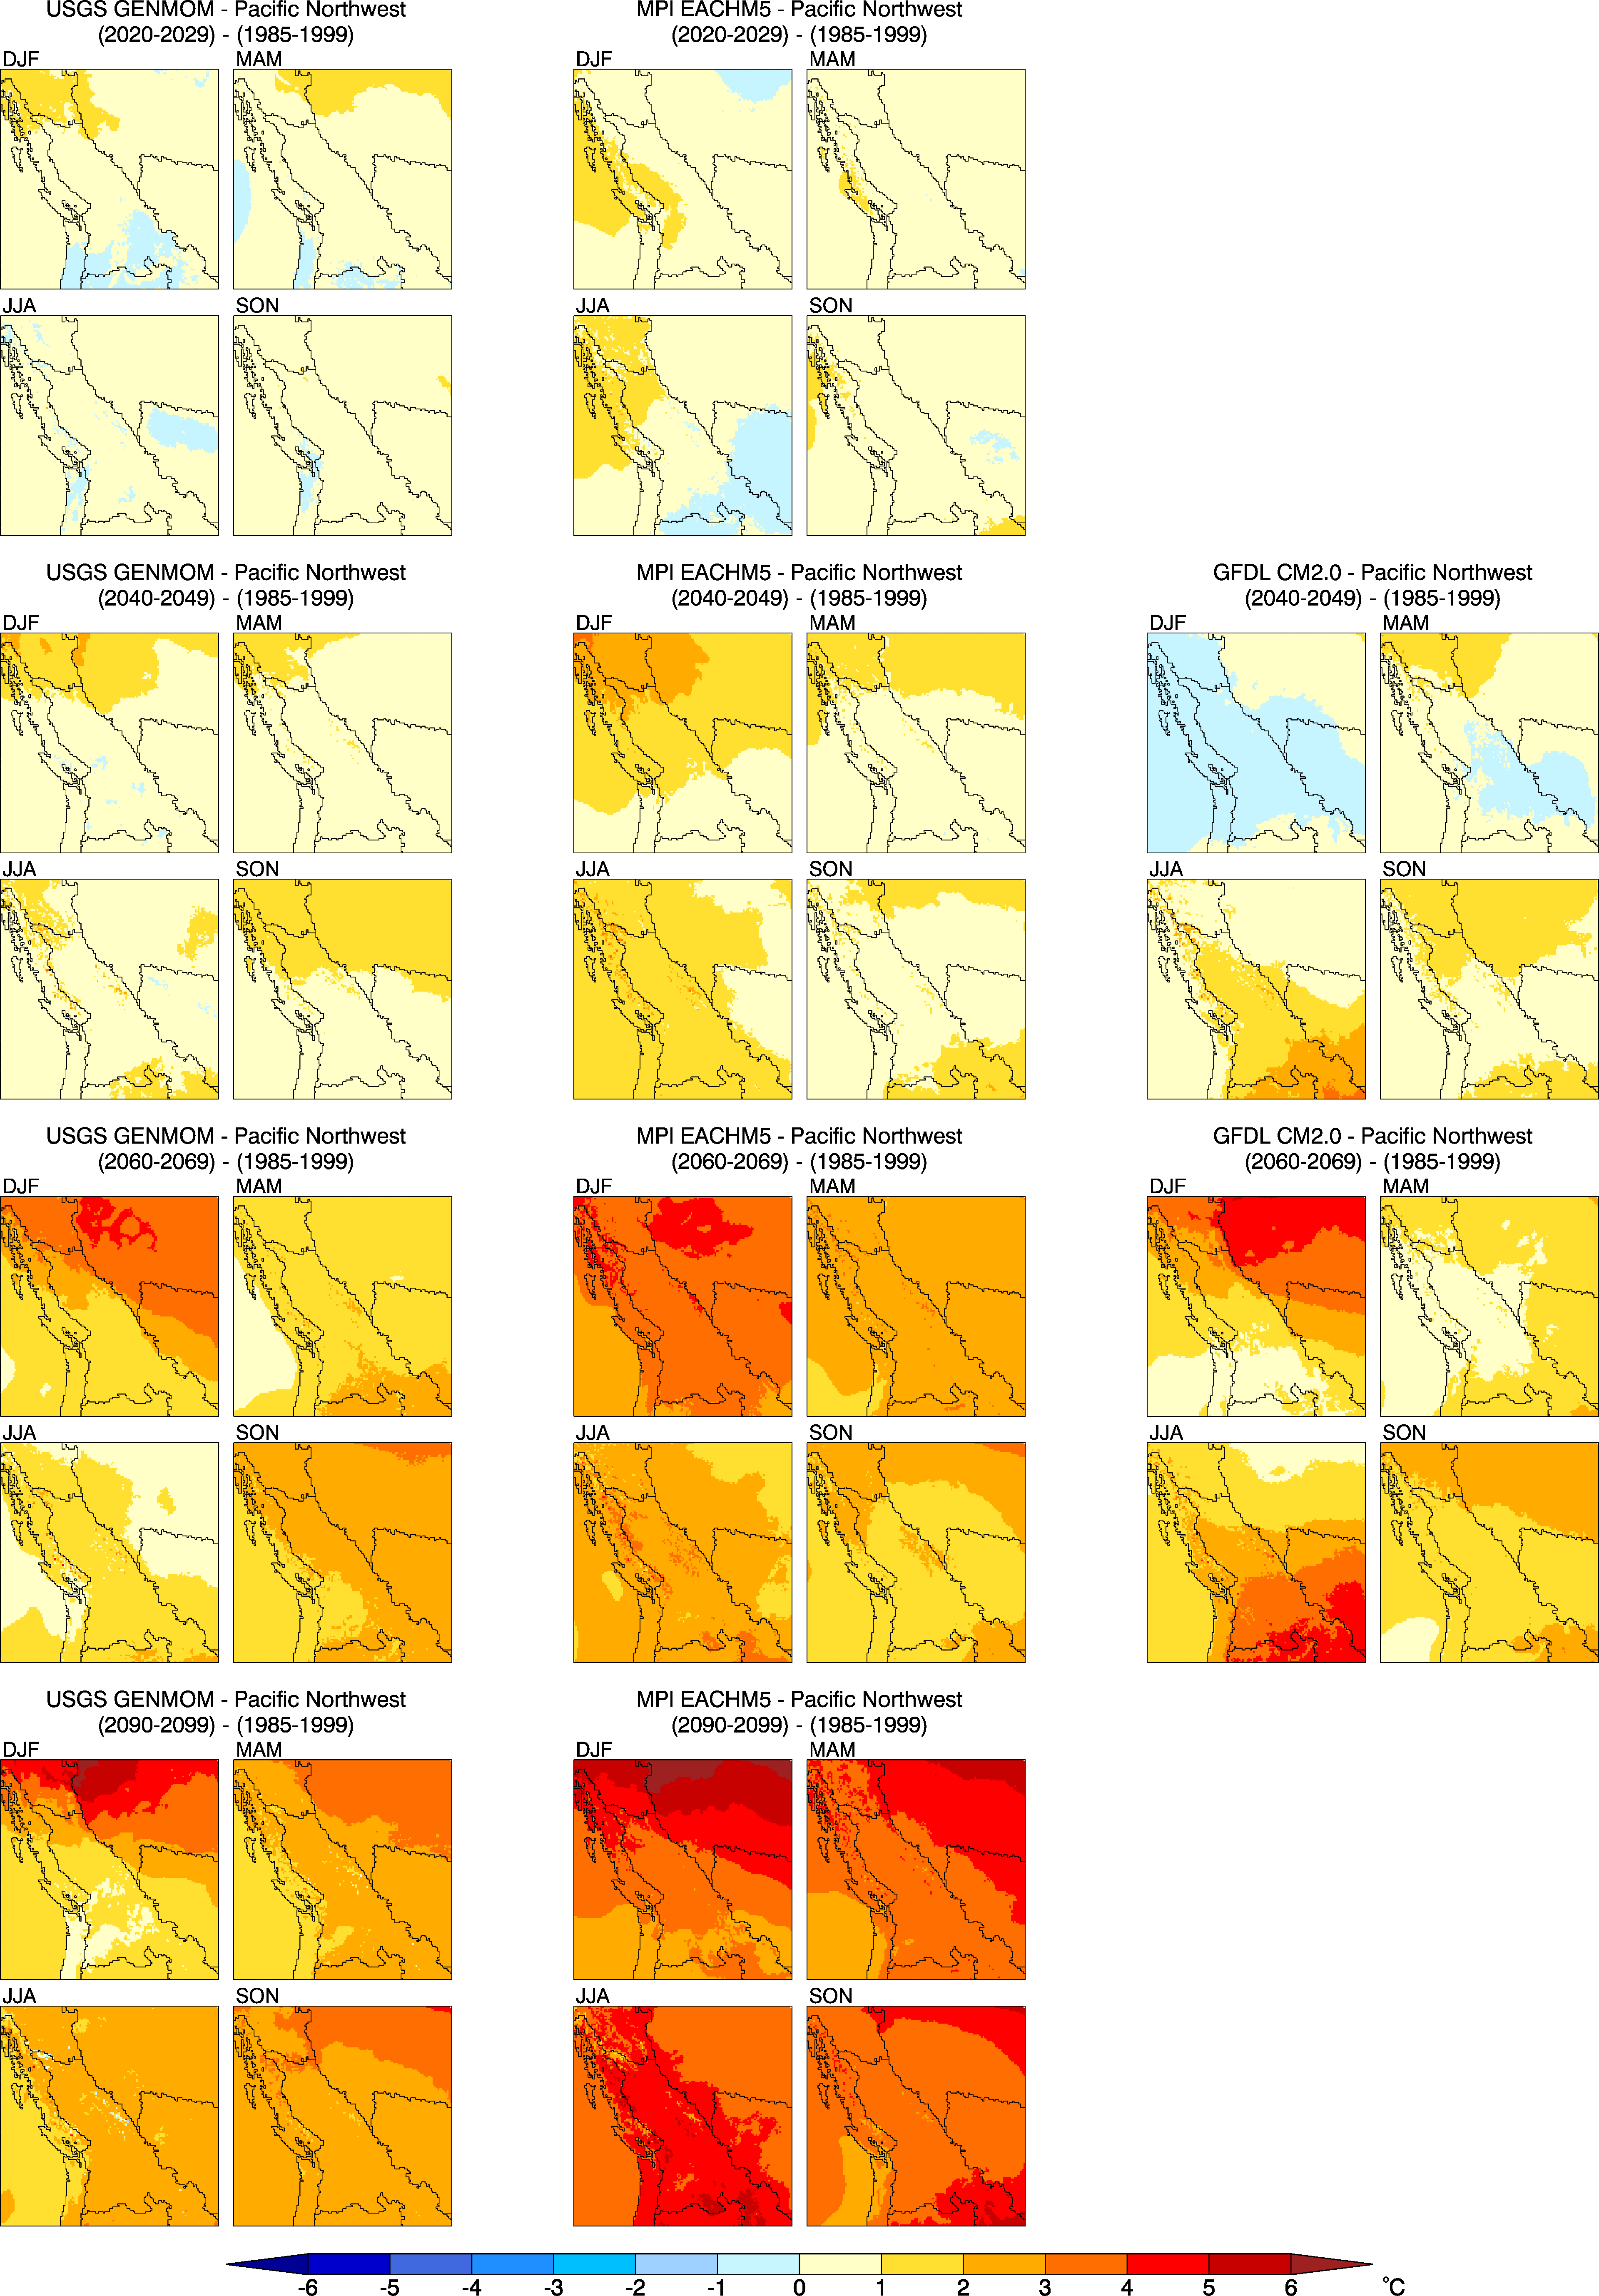
Figure 15. Differences between seasonal average 2-m air temperature climatologies for future decades (2020–2029, 2040–2049, 2060–2069, and 2090–2099) versus 1985–1999 over the PNW domain for the three RegCM3 projections.
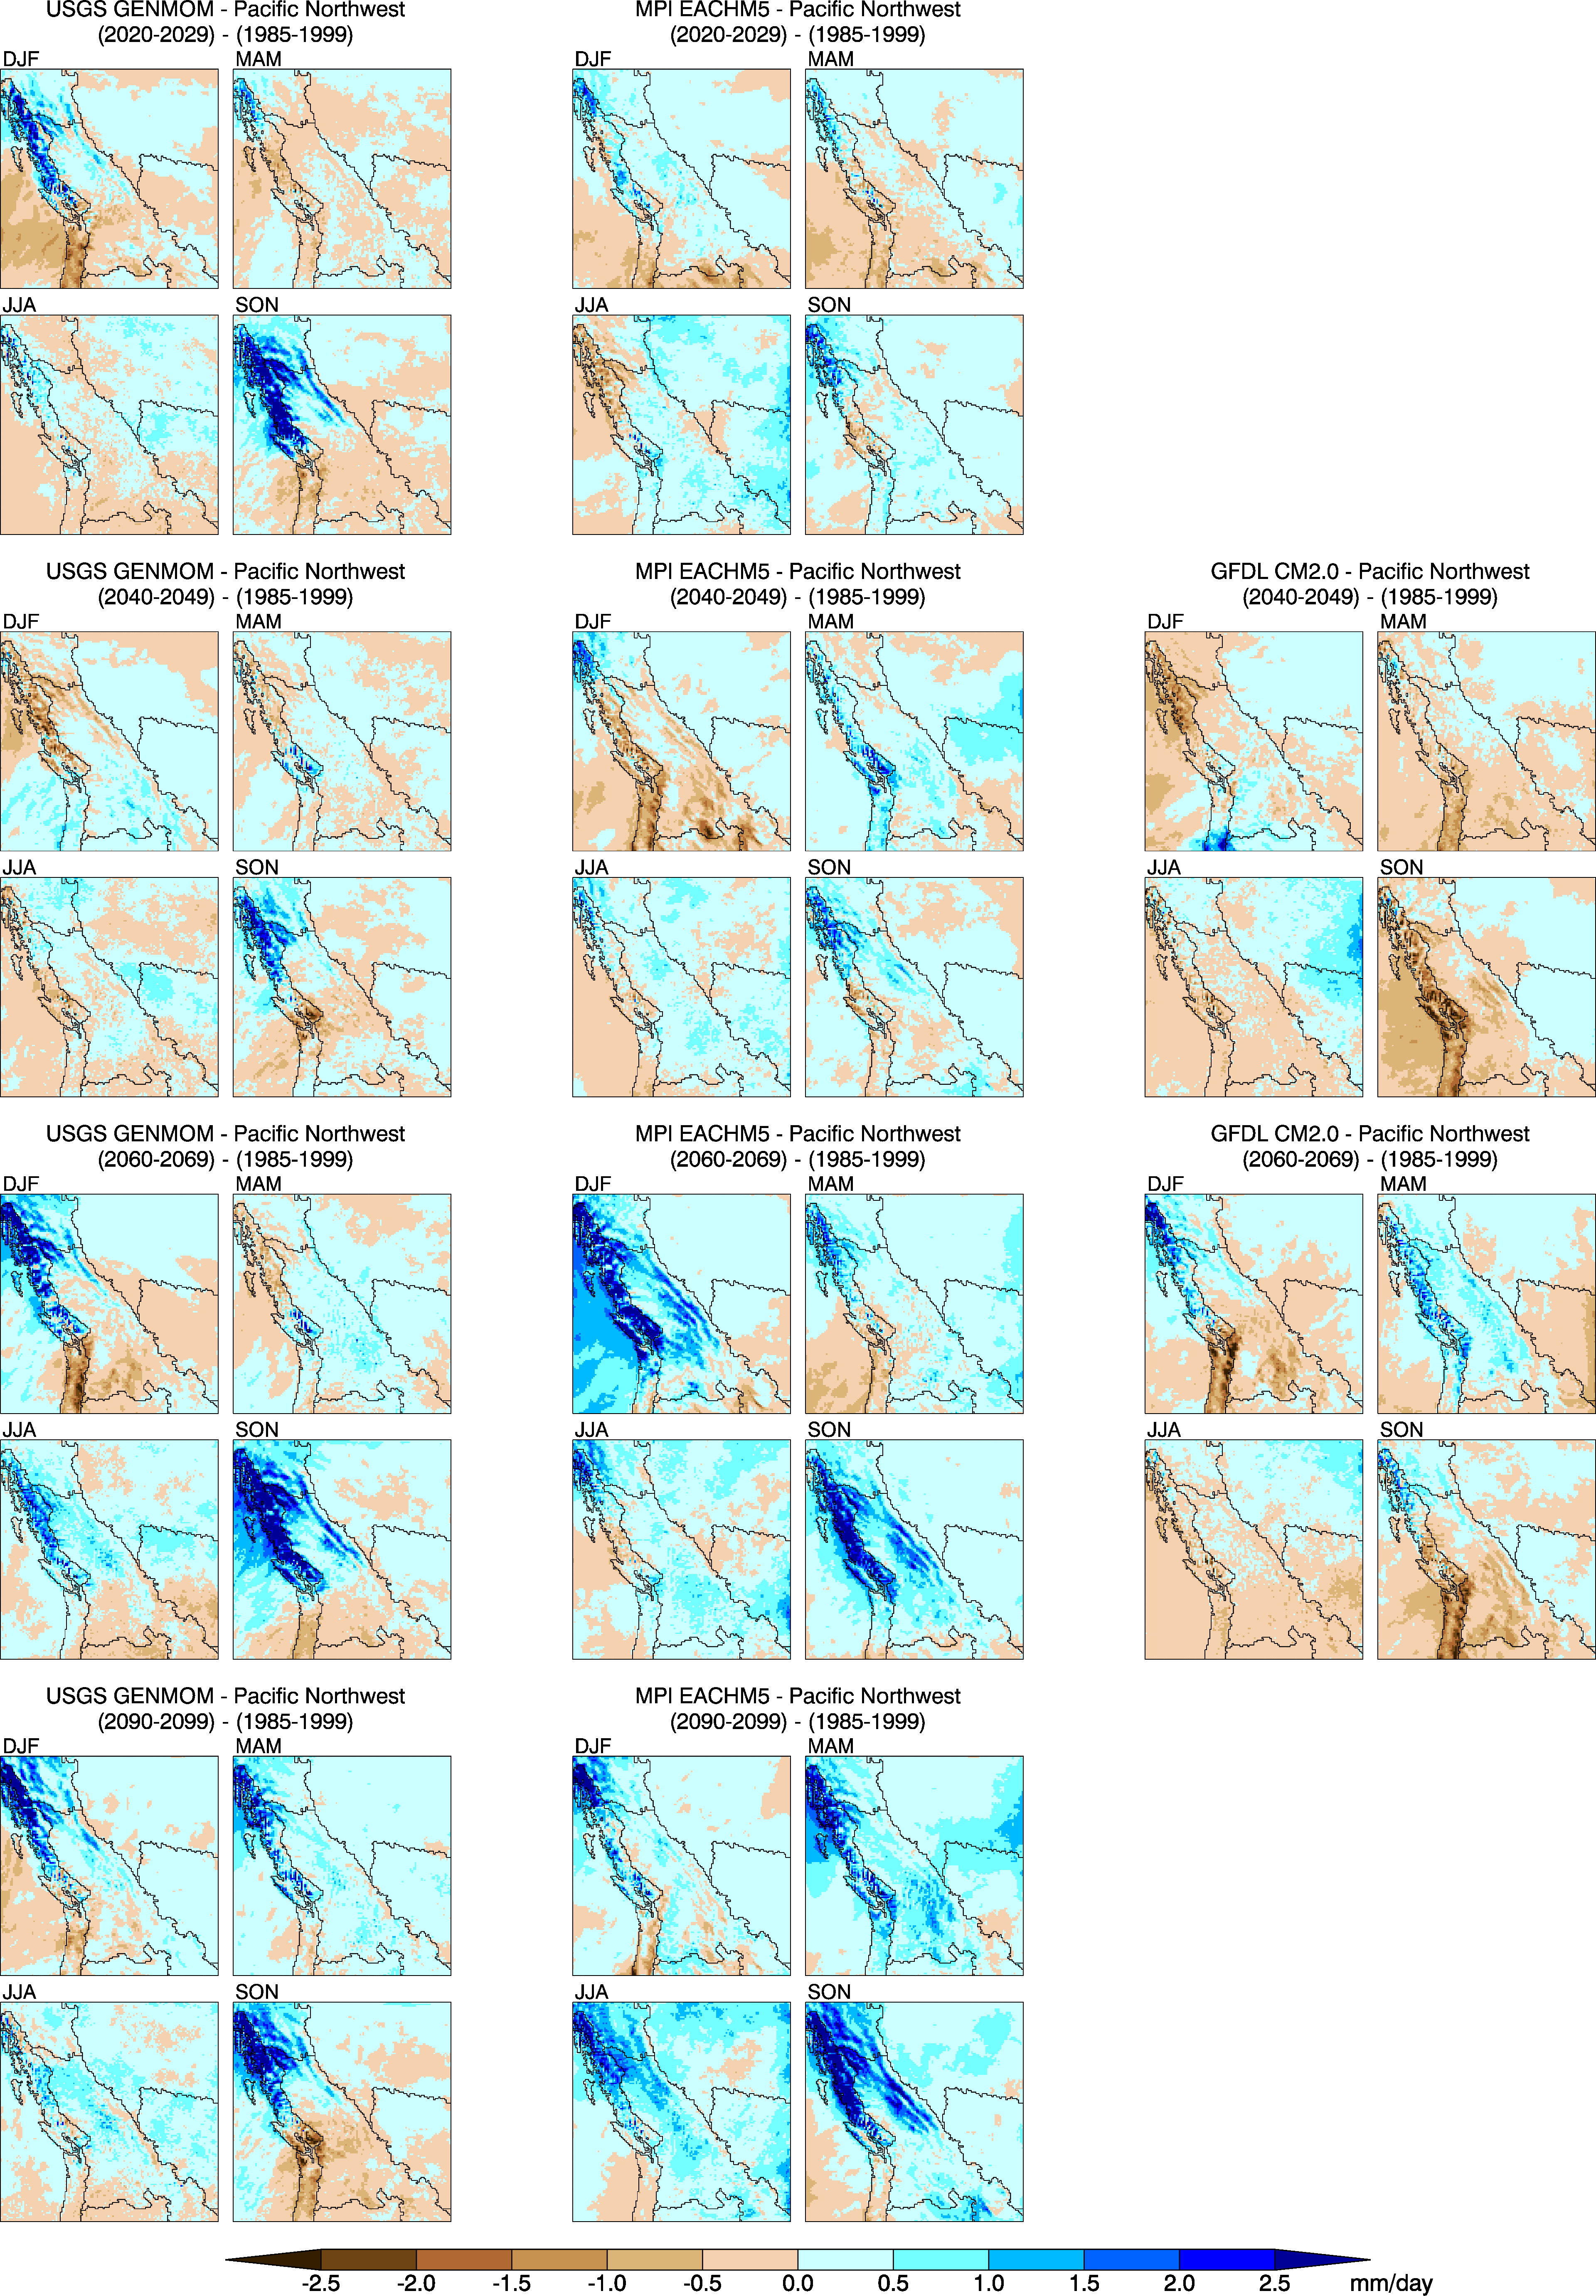
Figure 16. Differences between seasonal average precipitation climatologies for future decades (2020–2029, 2040–2049, 2060–2069, and 2090–2099) versus 1985–1999 over the PNW domain for the three RegCM3 projections.
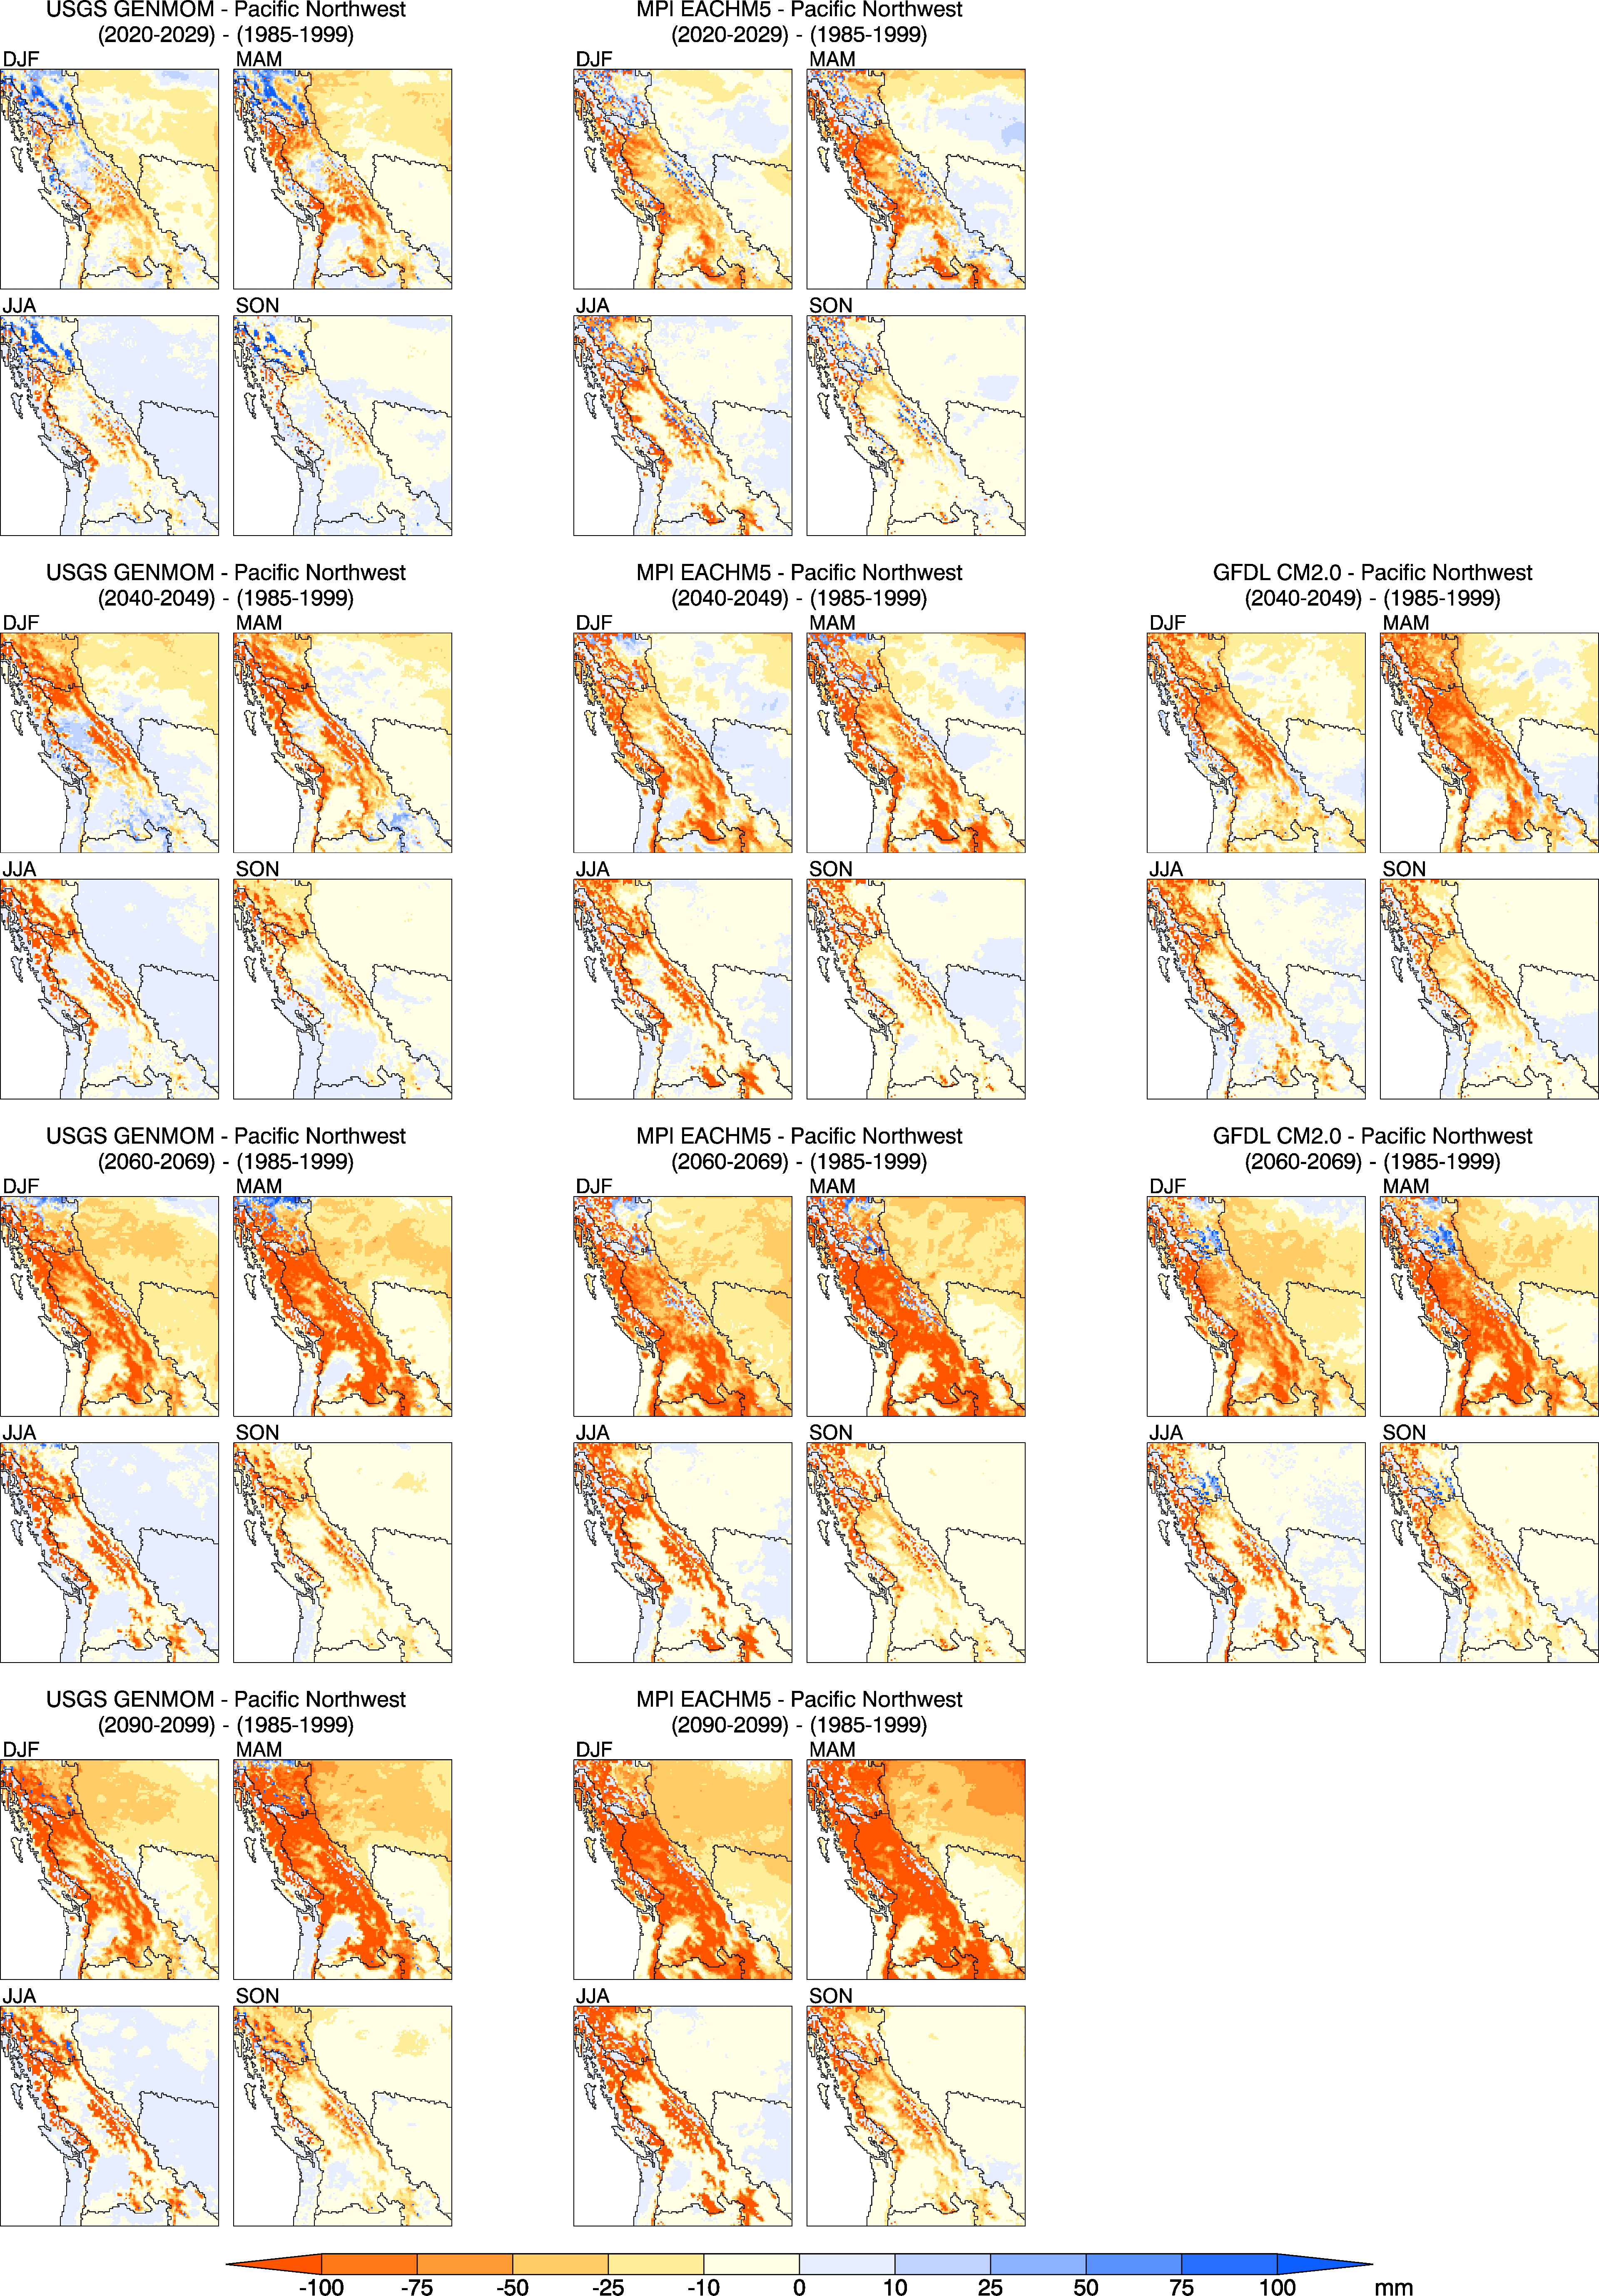
Figure 17. Differences between seasonal average snow water equivalent climatologies for future decades (2020–2029, 2040–2049, 2060–2069, and 2090–2099) versus 1985–1999 over the PNW domain for the three RegCM3 projections.
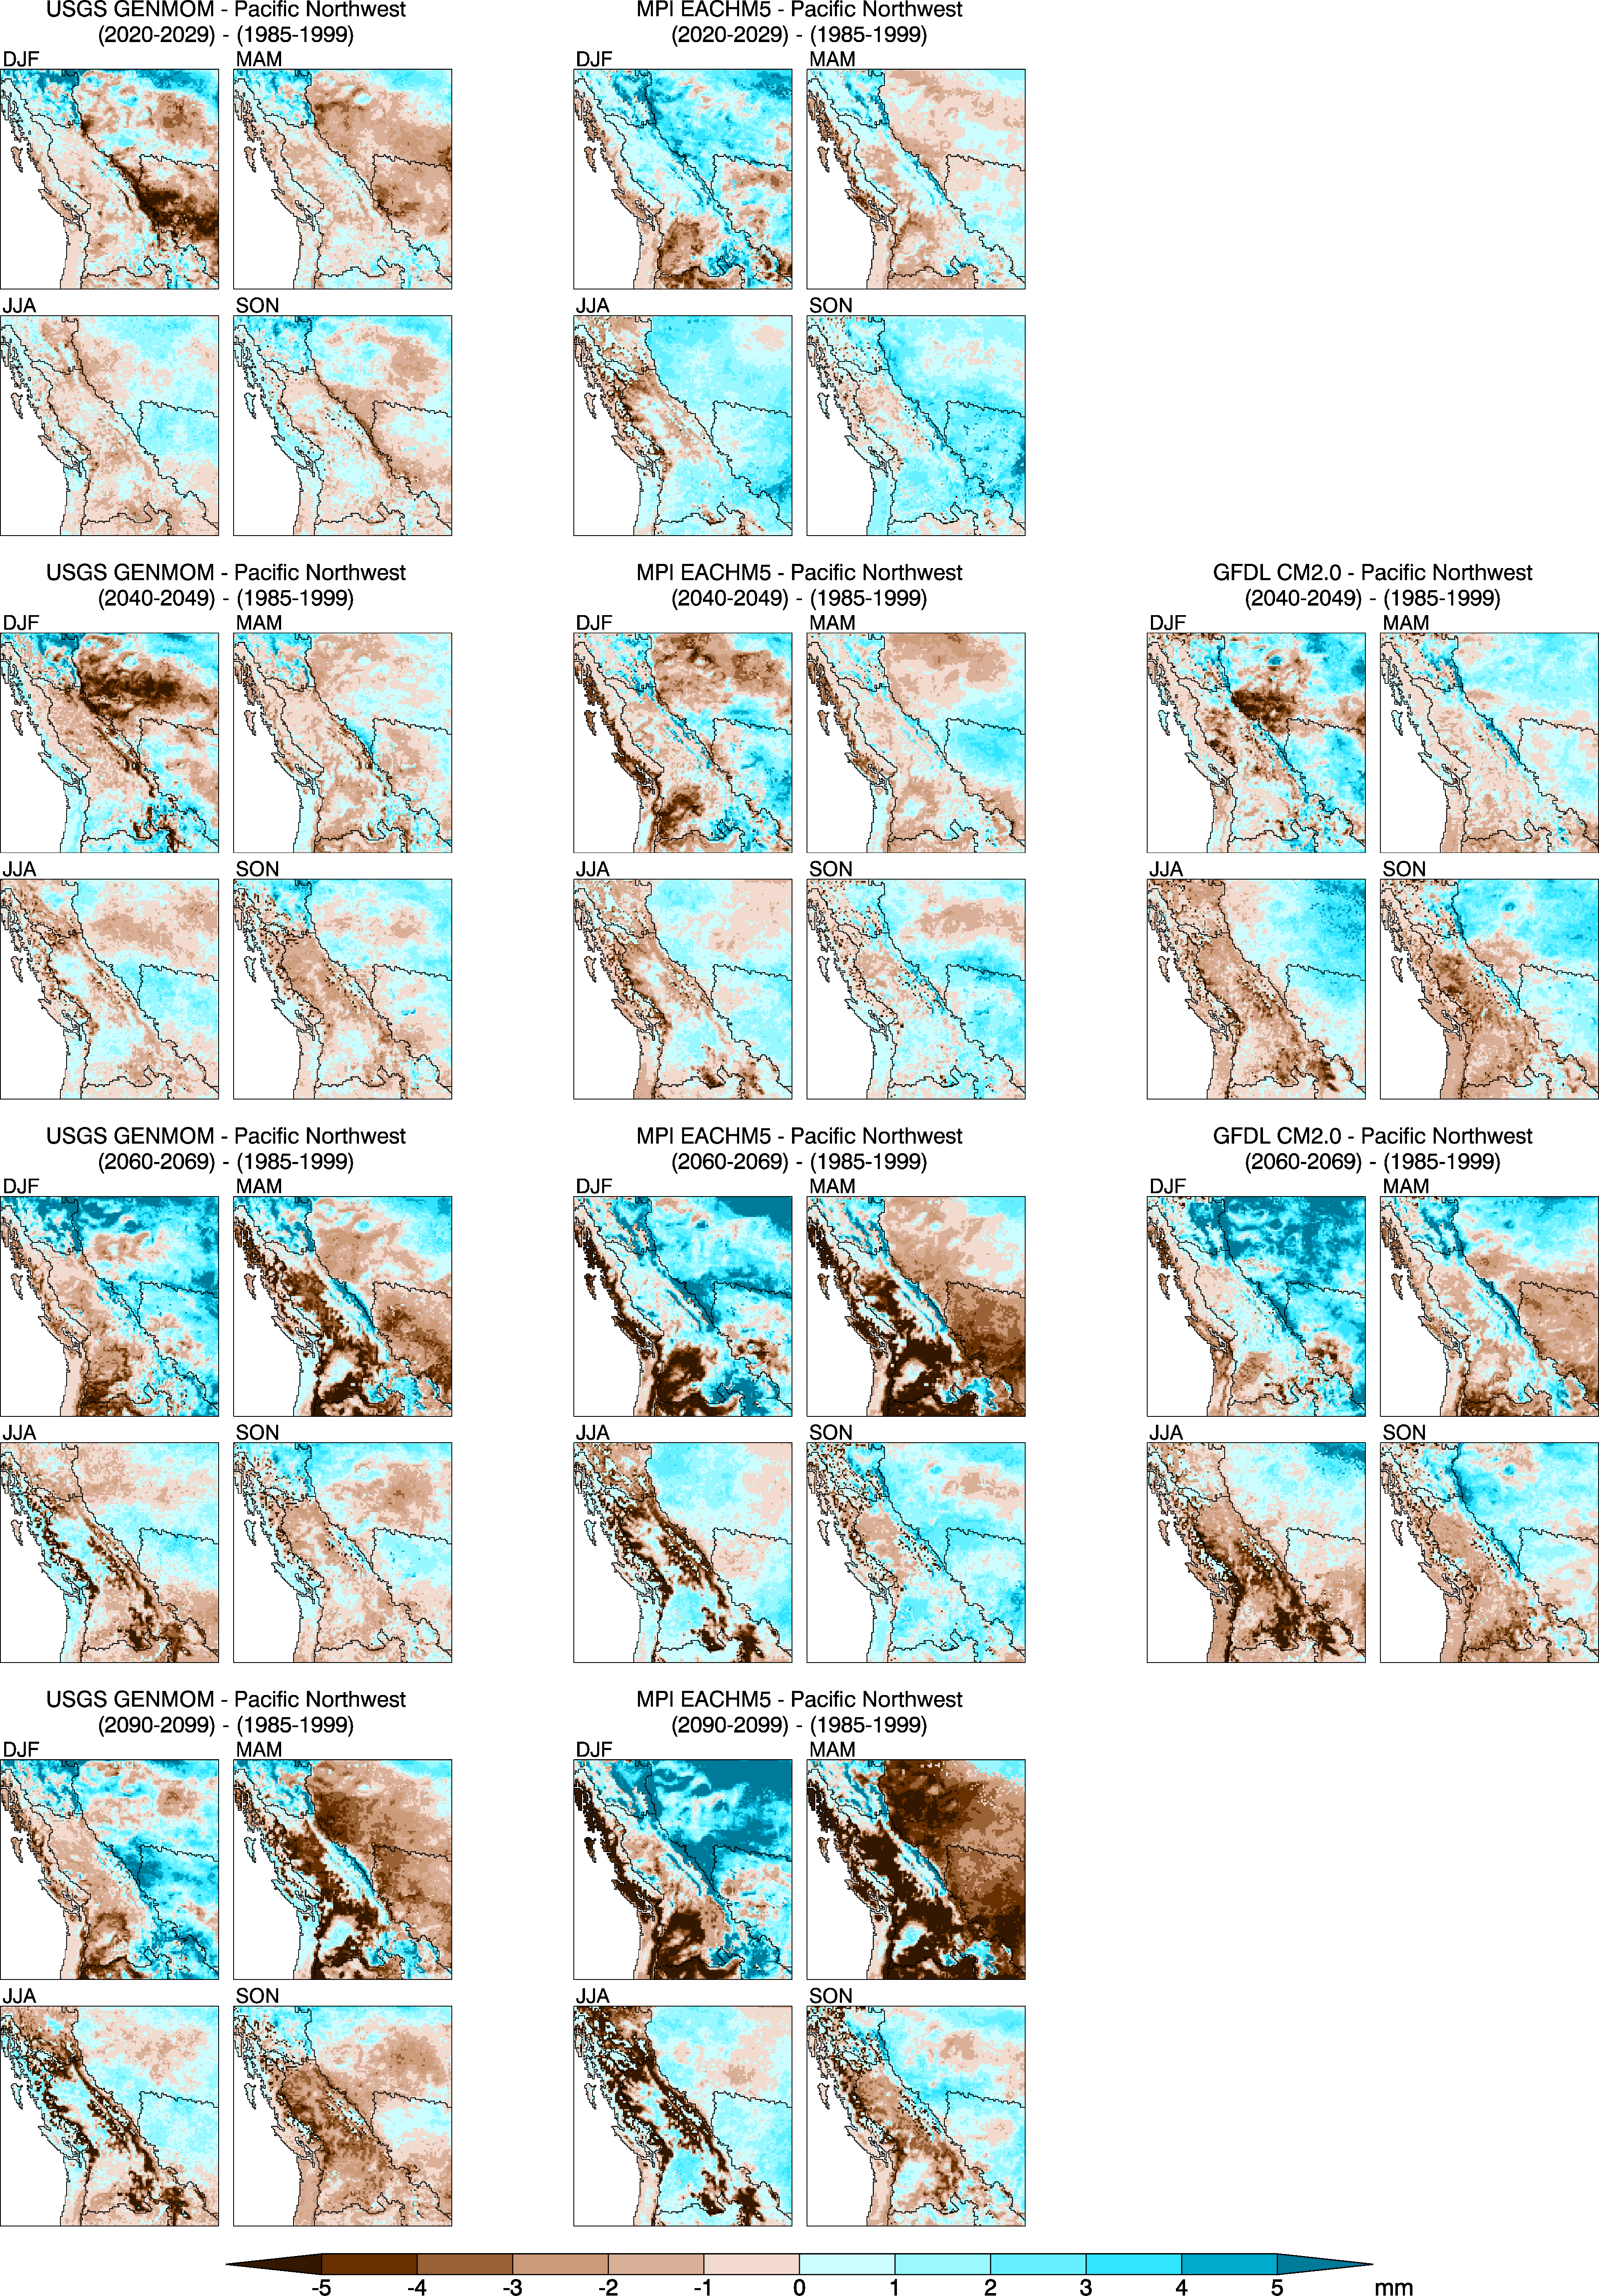
Figure 18. Differences between seasonal average root-zone soil moisture climatologies for future decades (2020–2029, 2040–2049, 2060–2069, and 2090–2099) versus 1985–1999 over the PNW domain for the three RegCM3 projections.
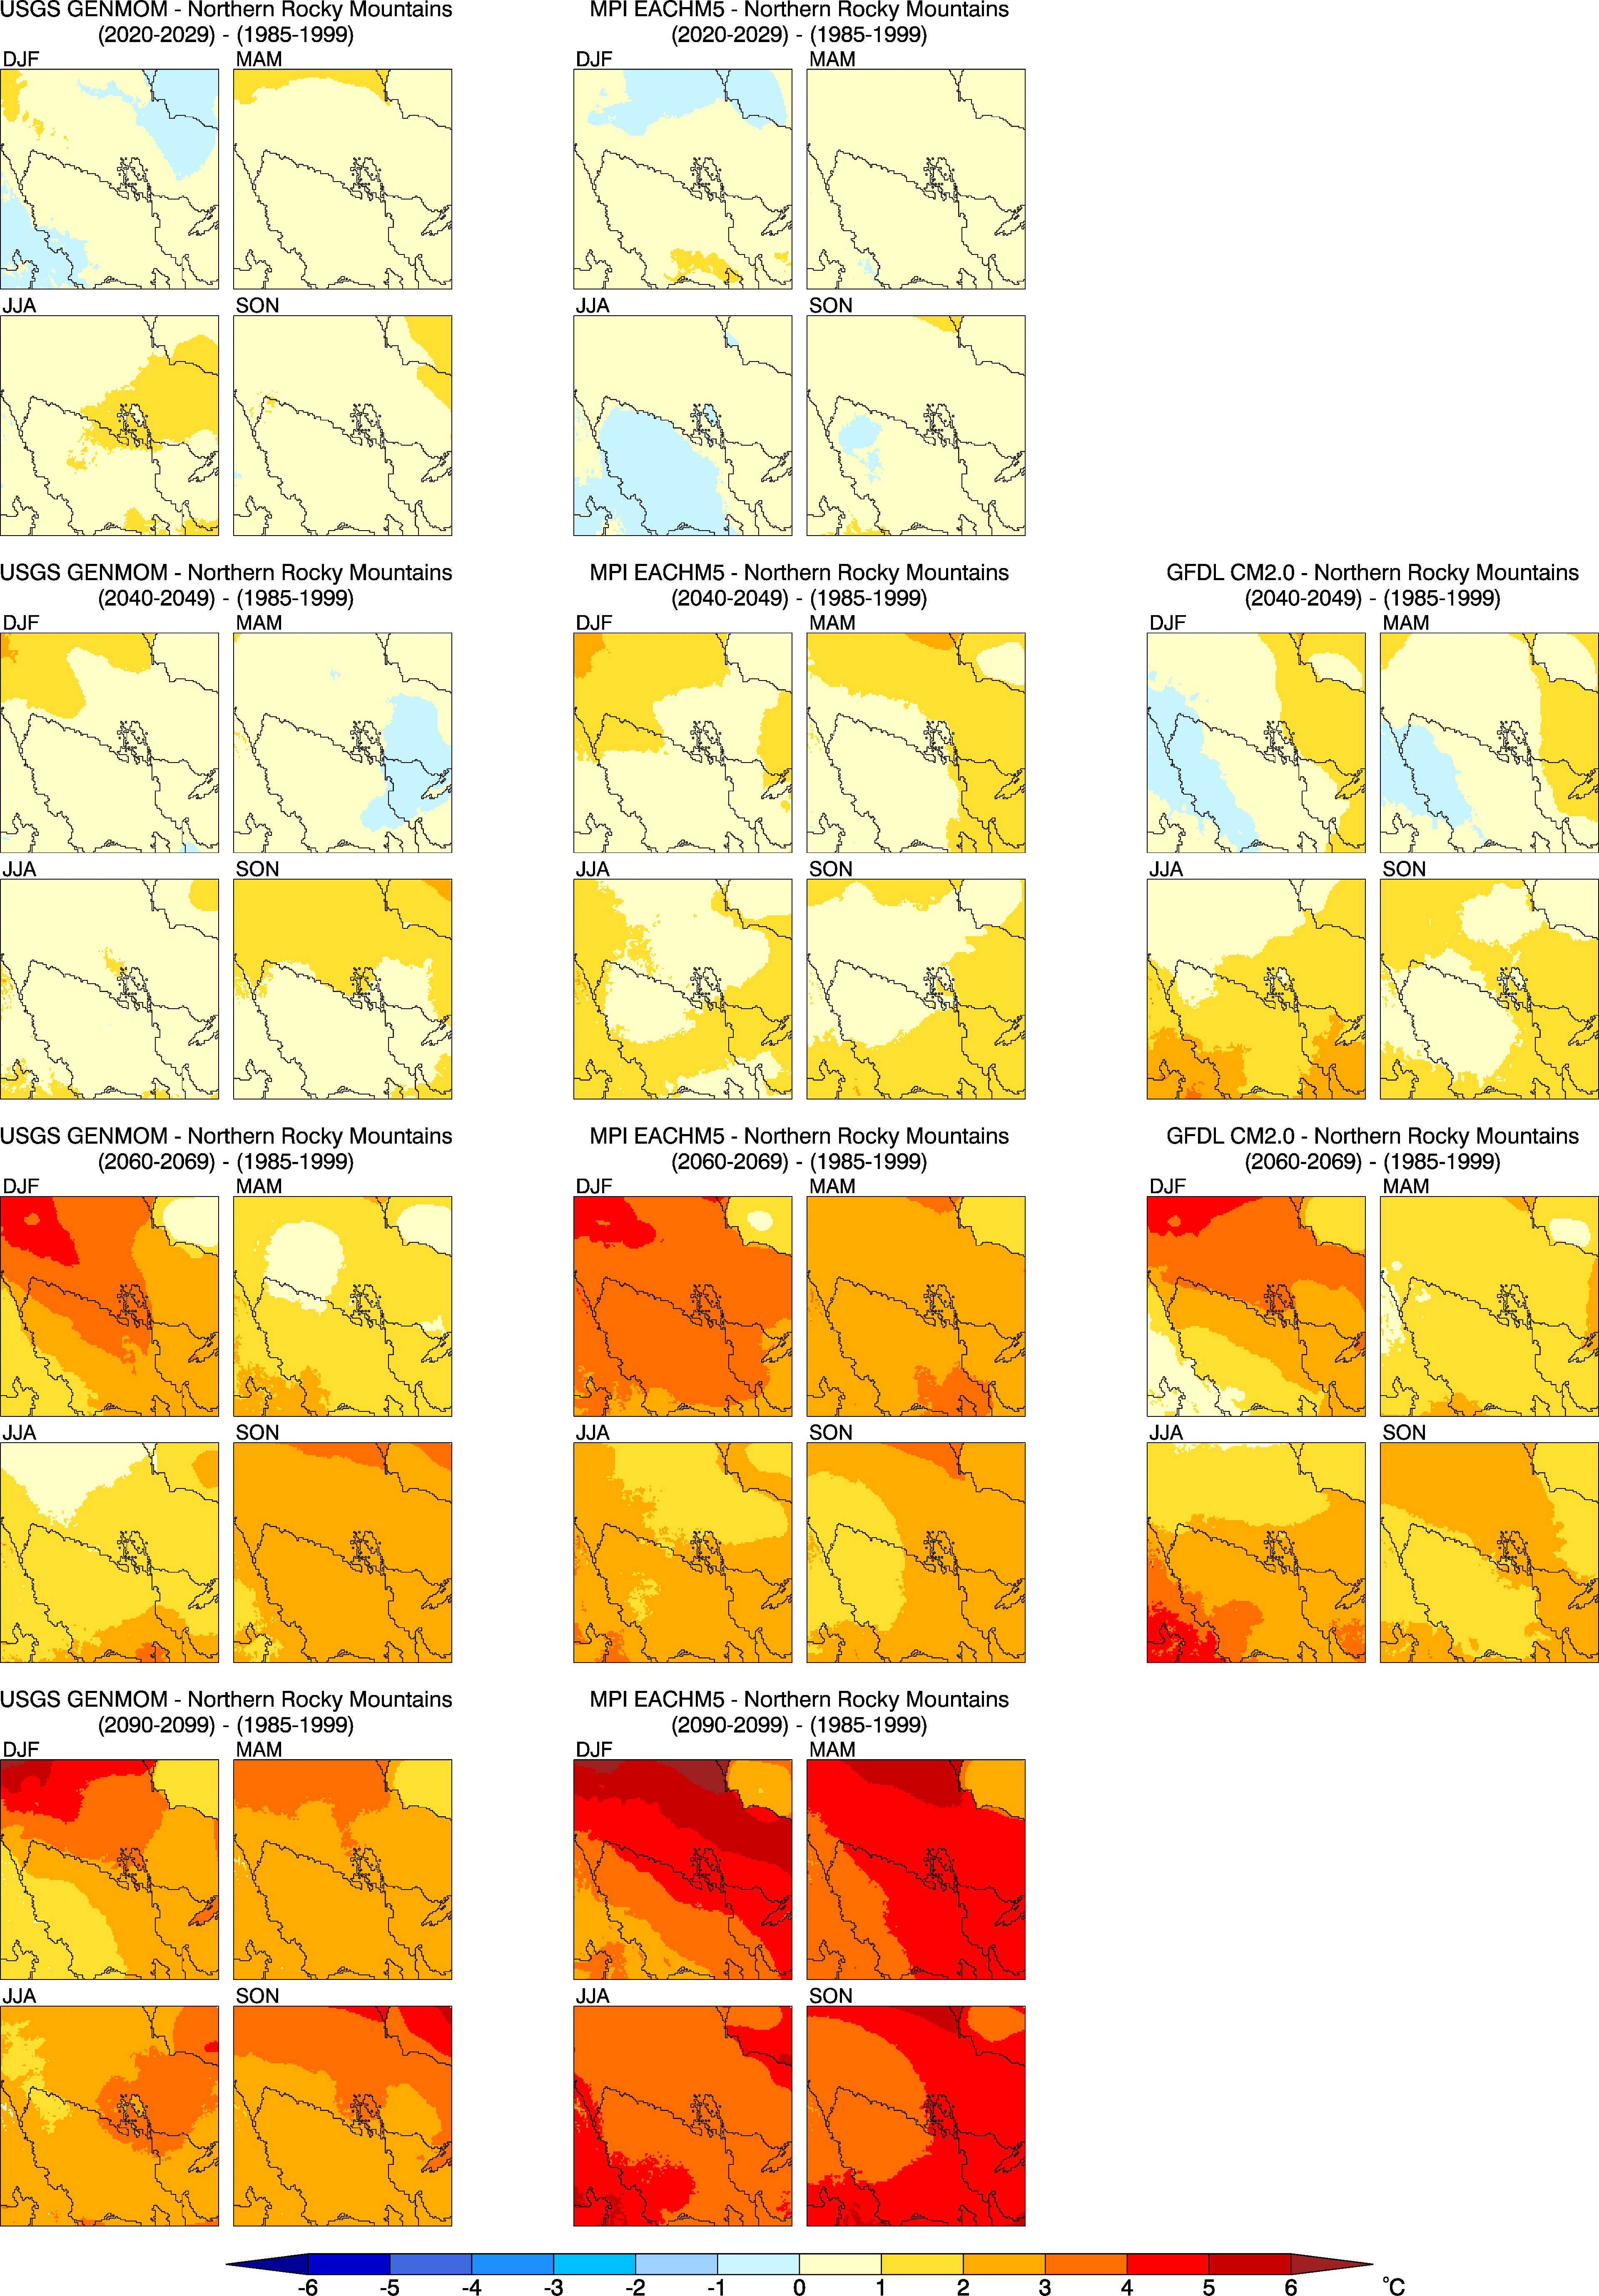
Figure 19. Differences between seasonal average 2-m air temperature climatologies for future decades (2020–2029, 2040–2049, 2060–2069, and 2090–2099) versus 1985–1999 over the NRM domain for the three RegCM3 projections.
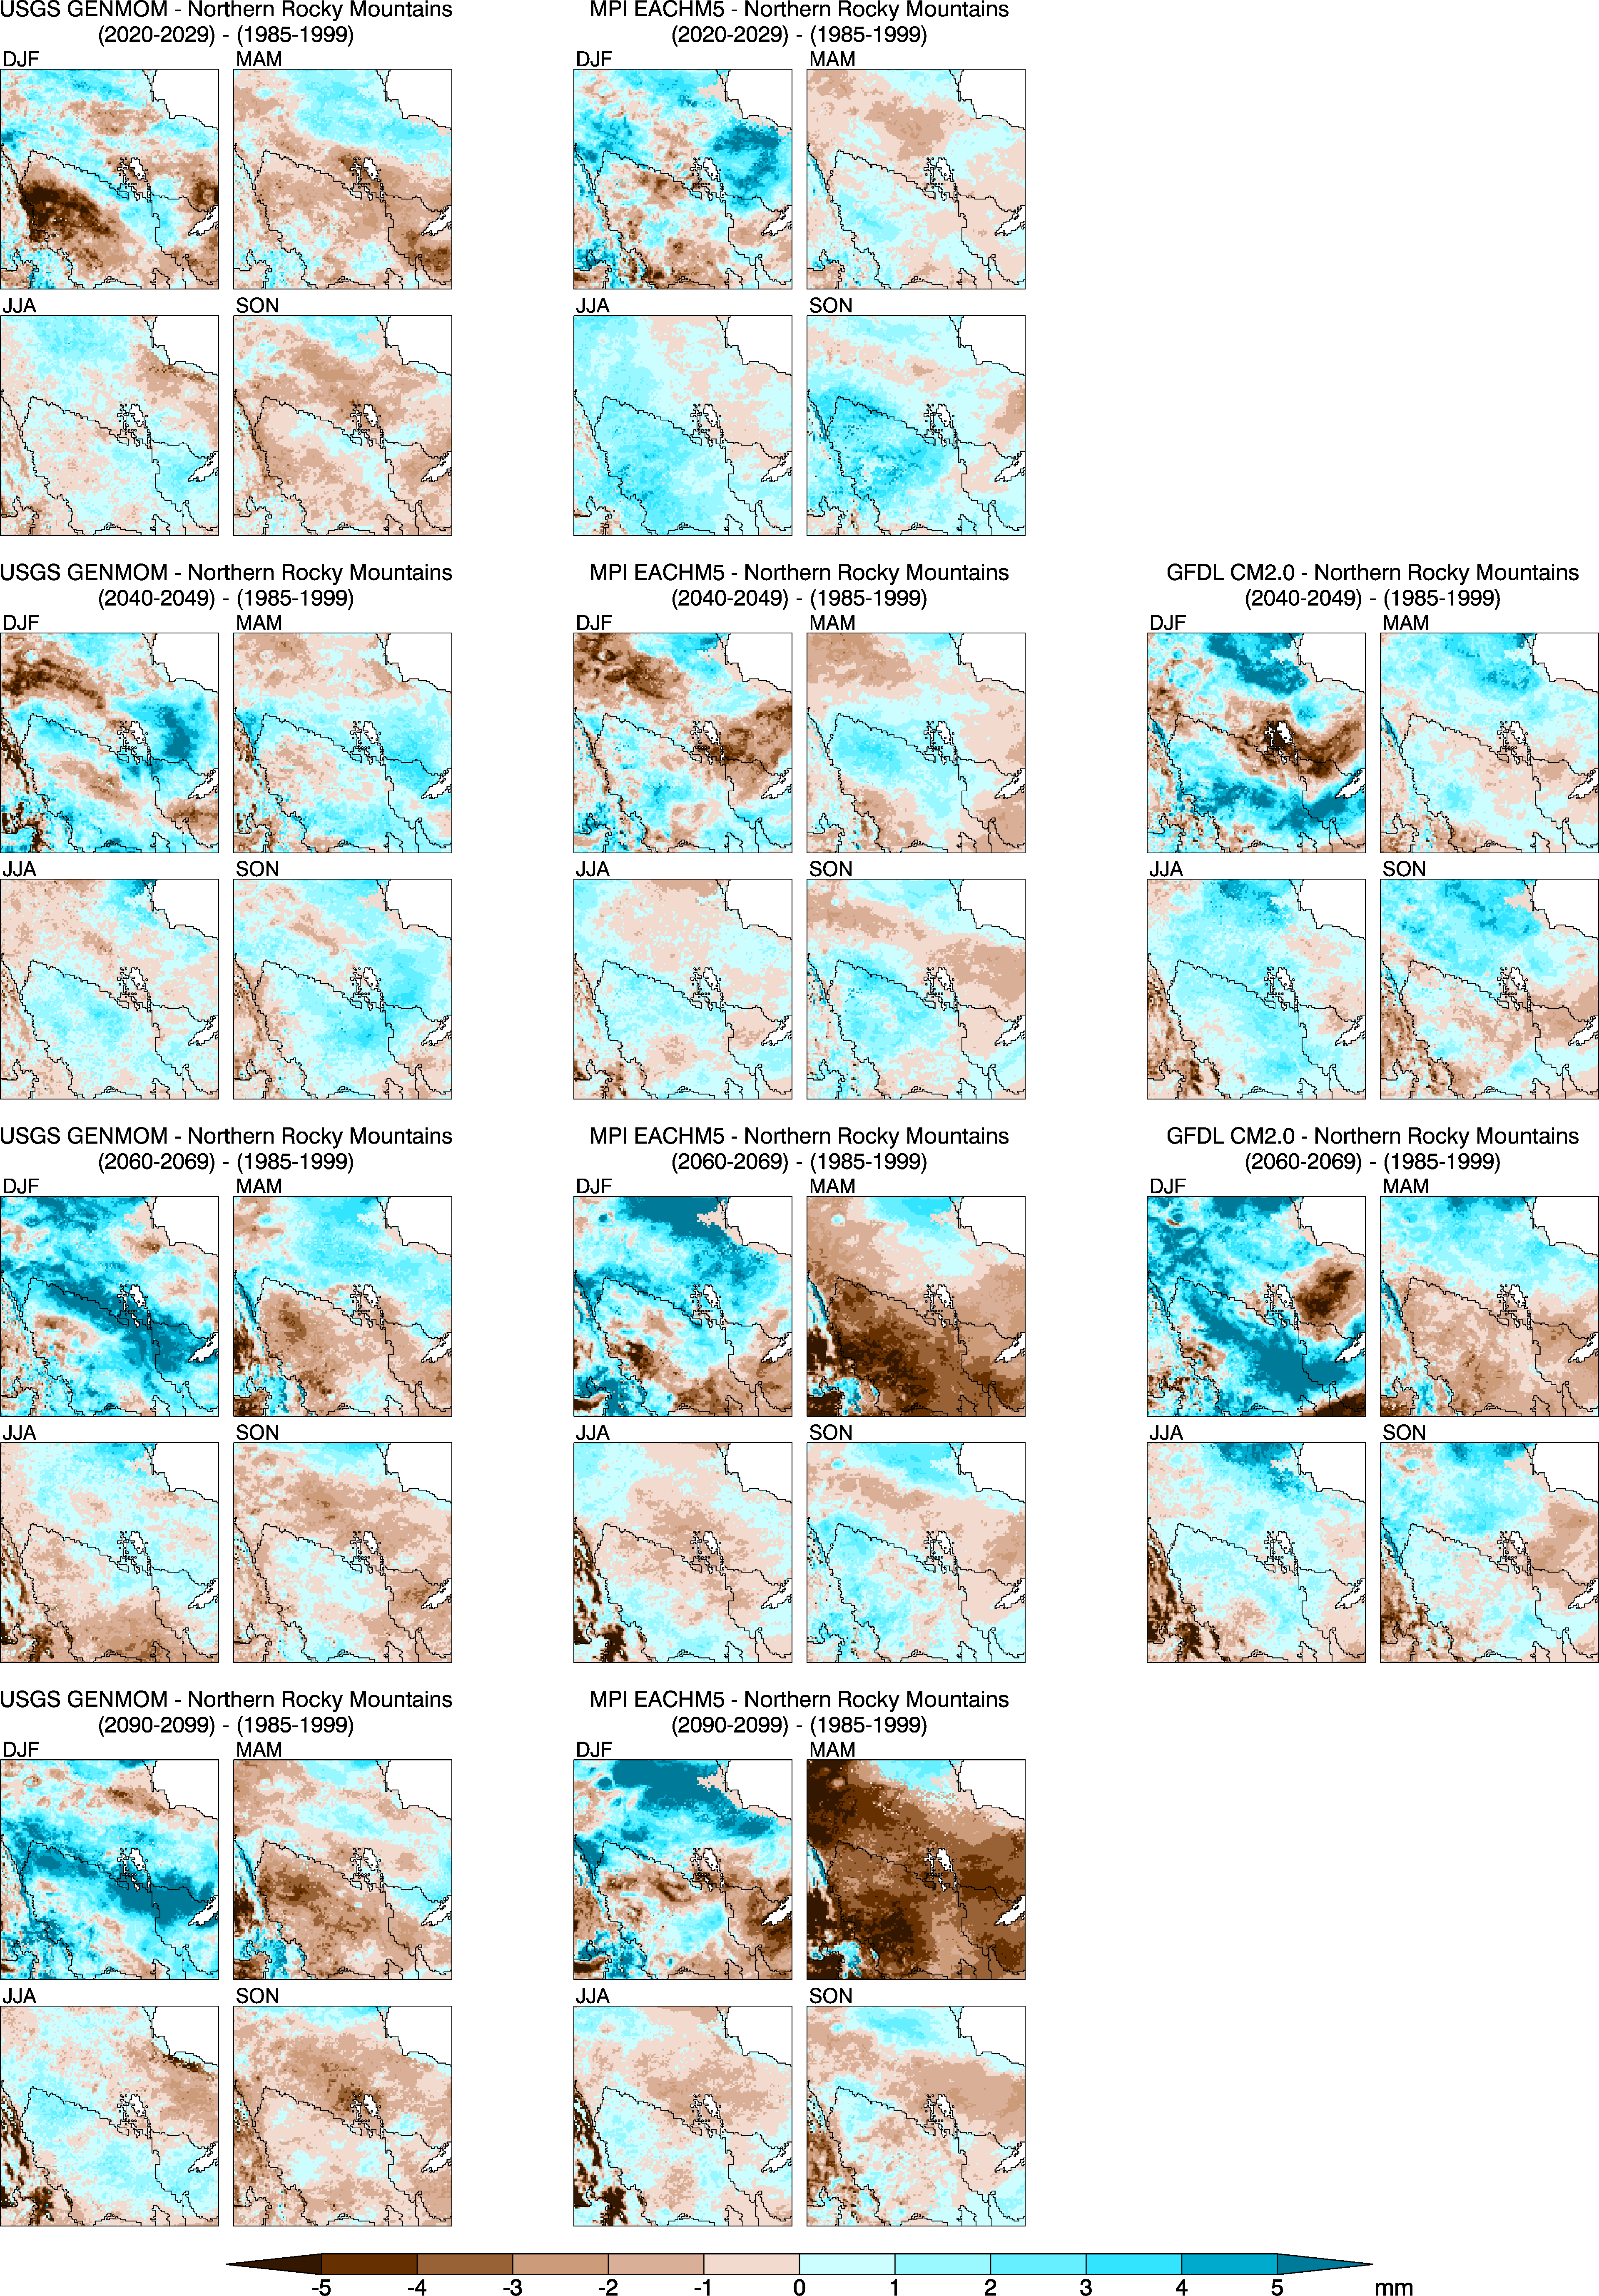
Figure 20. Differences between seasonal average precipitation climatologies for future decades (2020–2029, 2040–2049, 2060–2069, and 2090–2099) versus 1985–1999 over the NRM domain for the three RegCM3 projections.
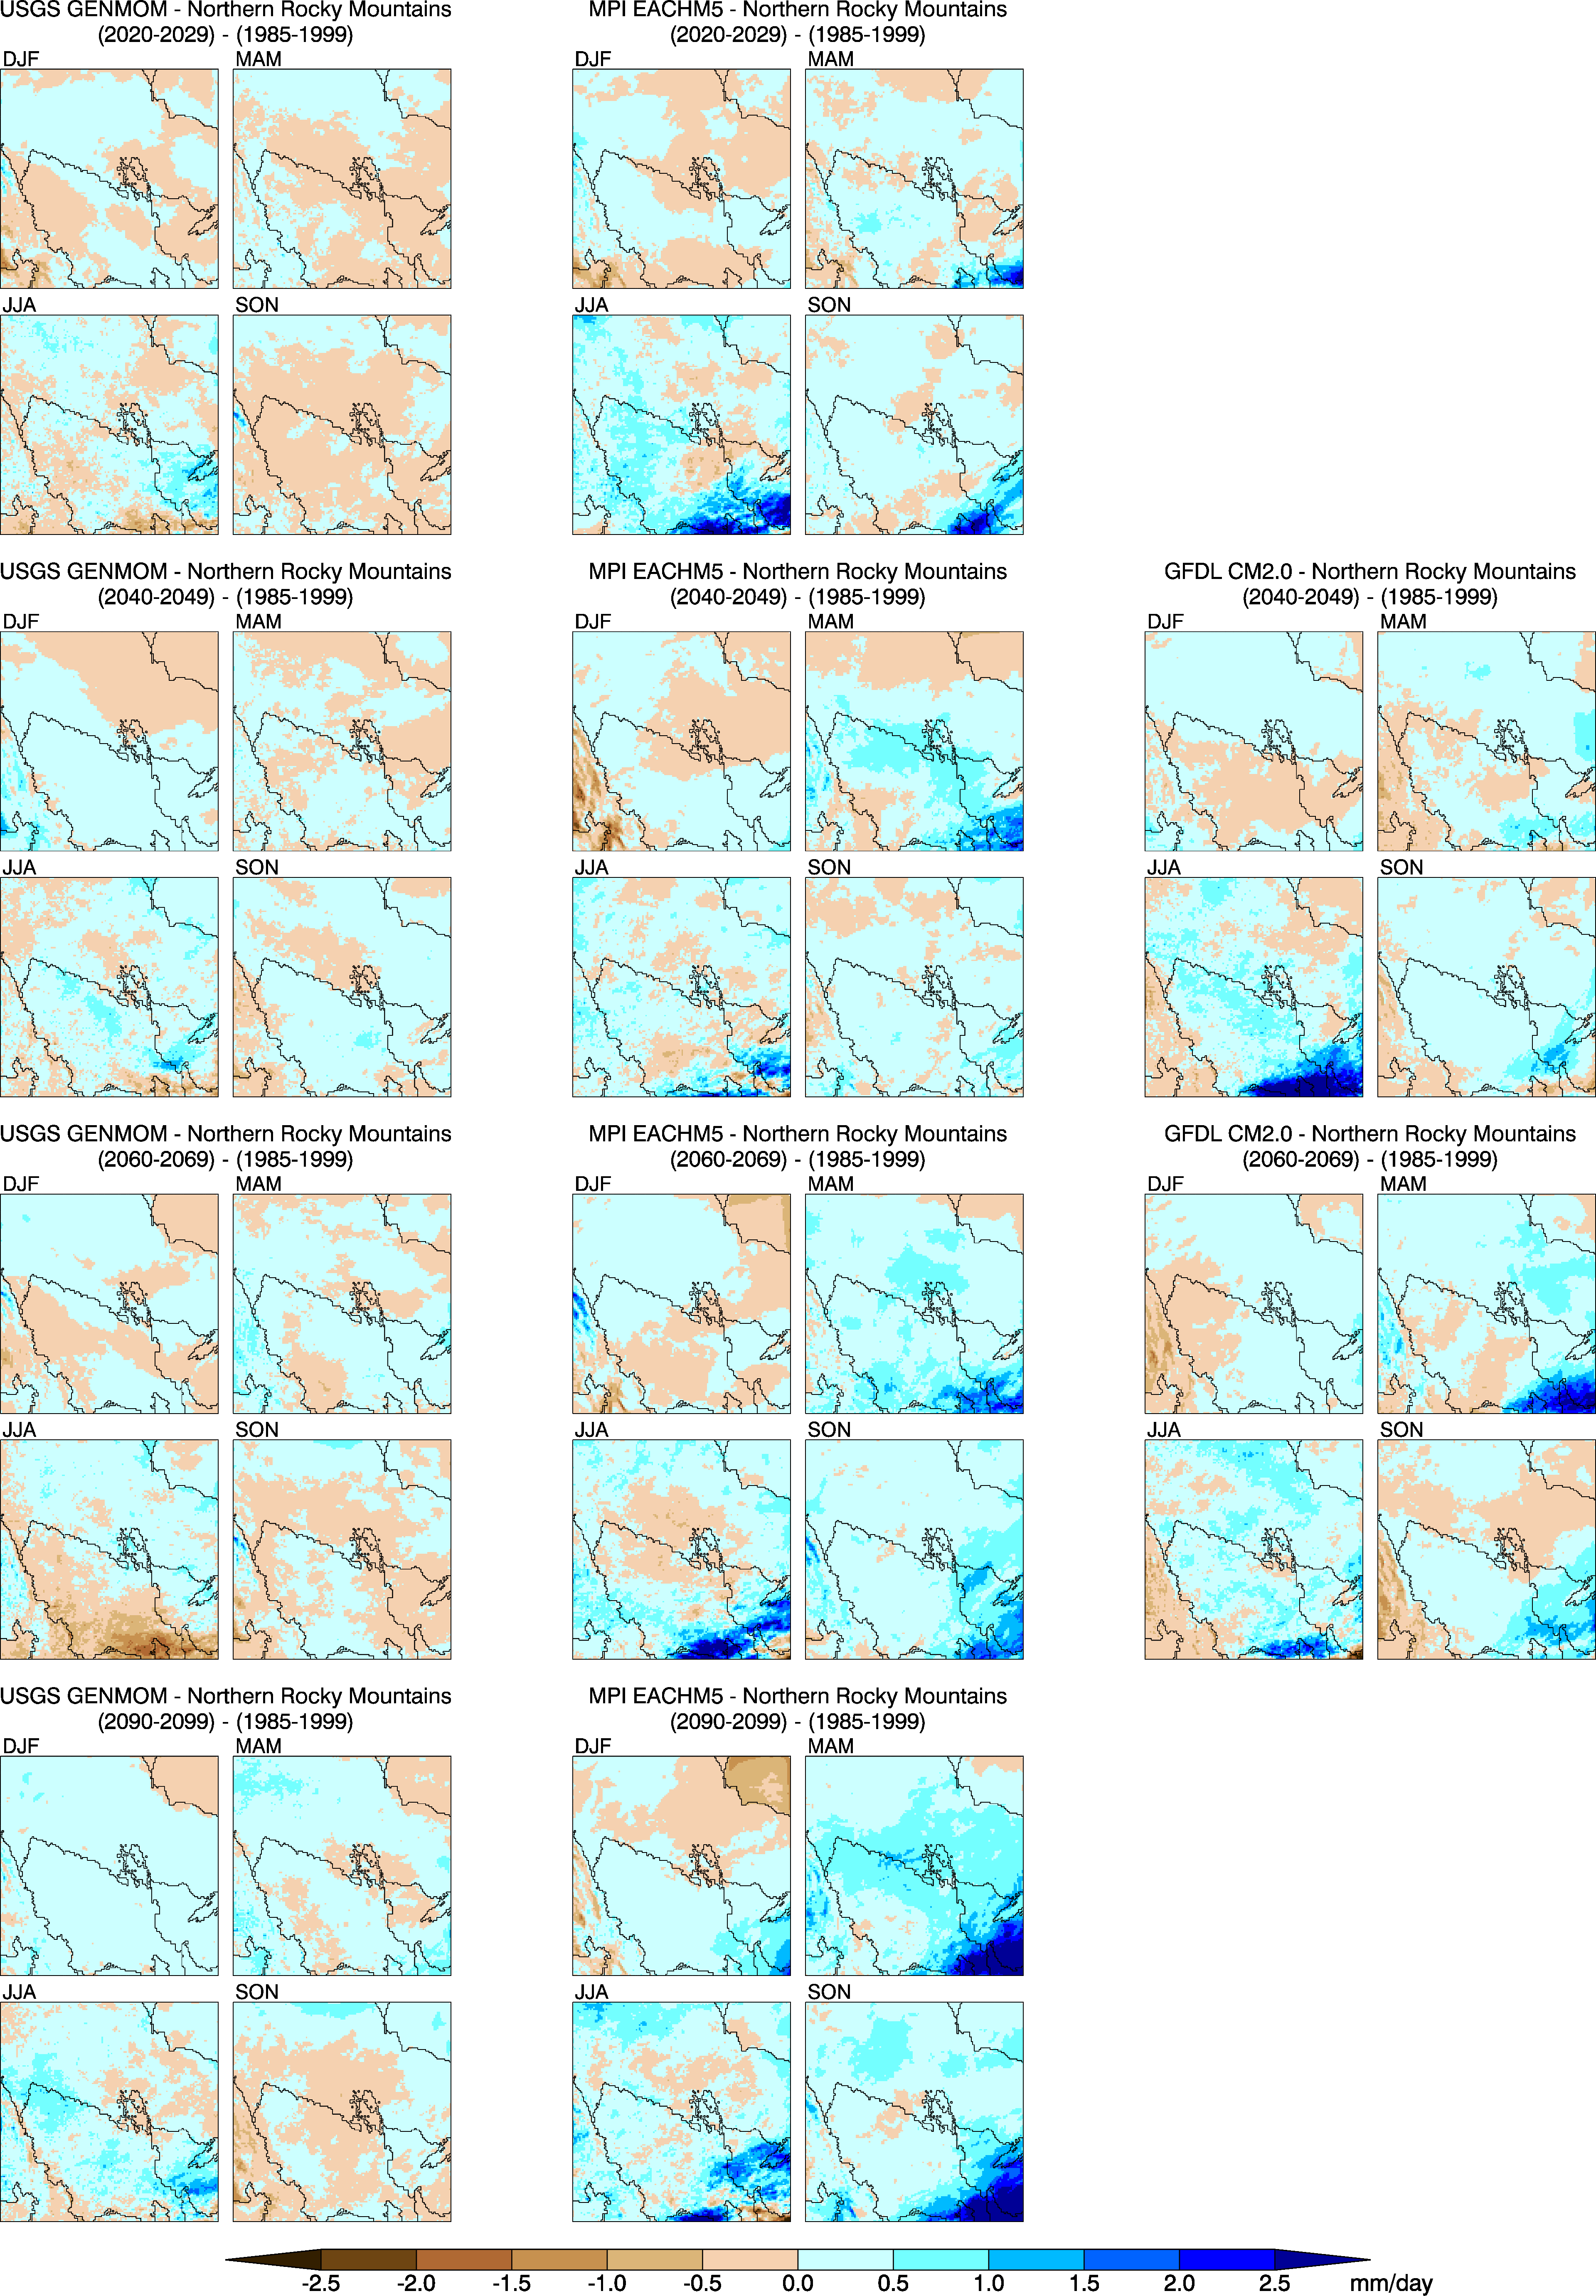
Figure 21. Differences between seasonal average snow water equivalent climatologies for future decades (2020–2029, 2040–2049, 2060–2069, and 2090–2099) versus 1985–1999 over the NRM domain for the three RegCM3 projections.
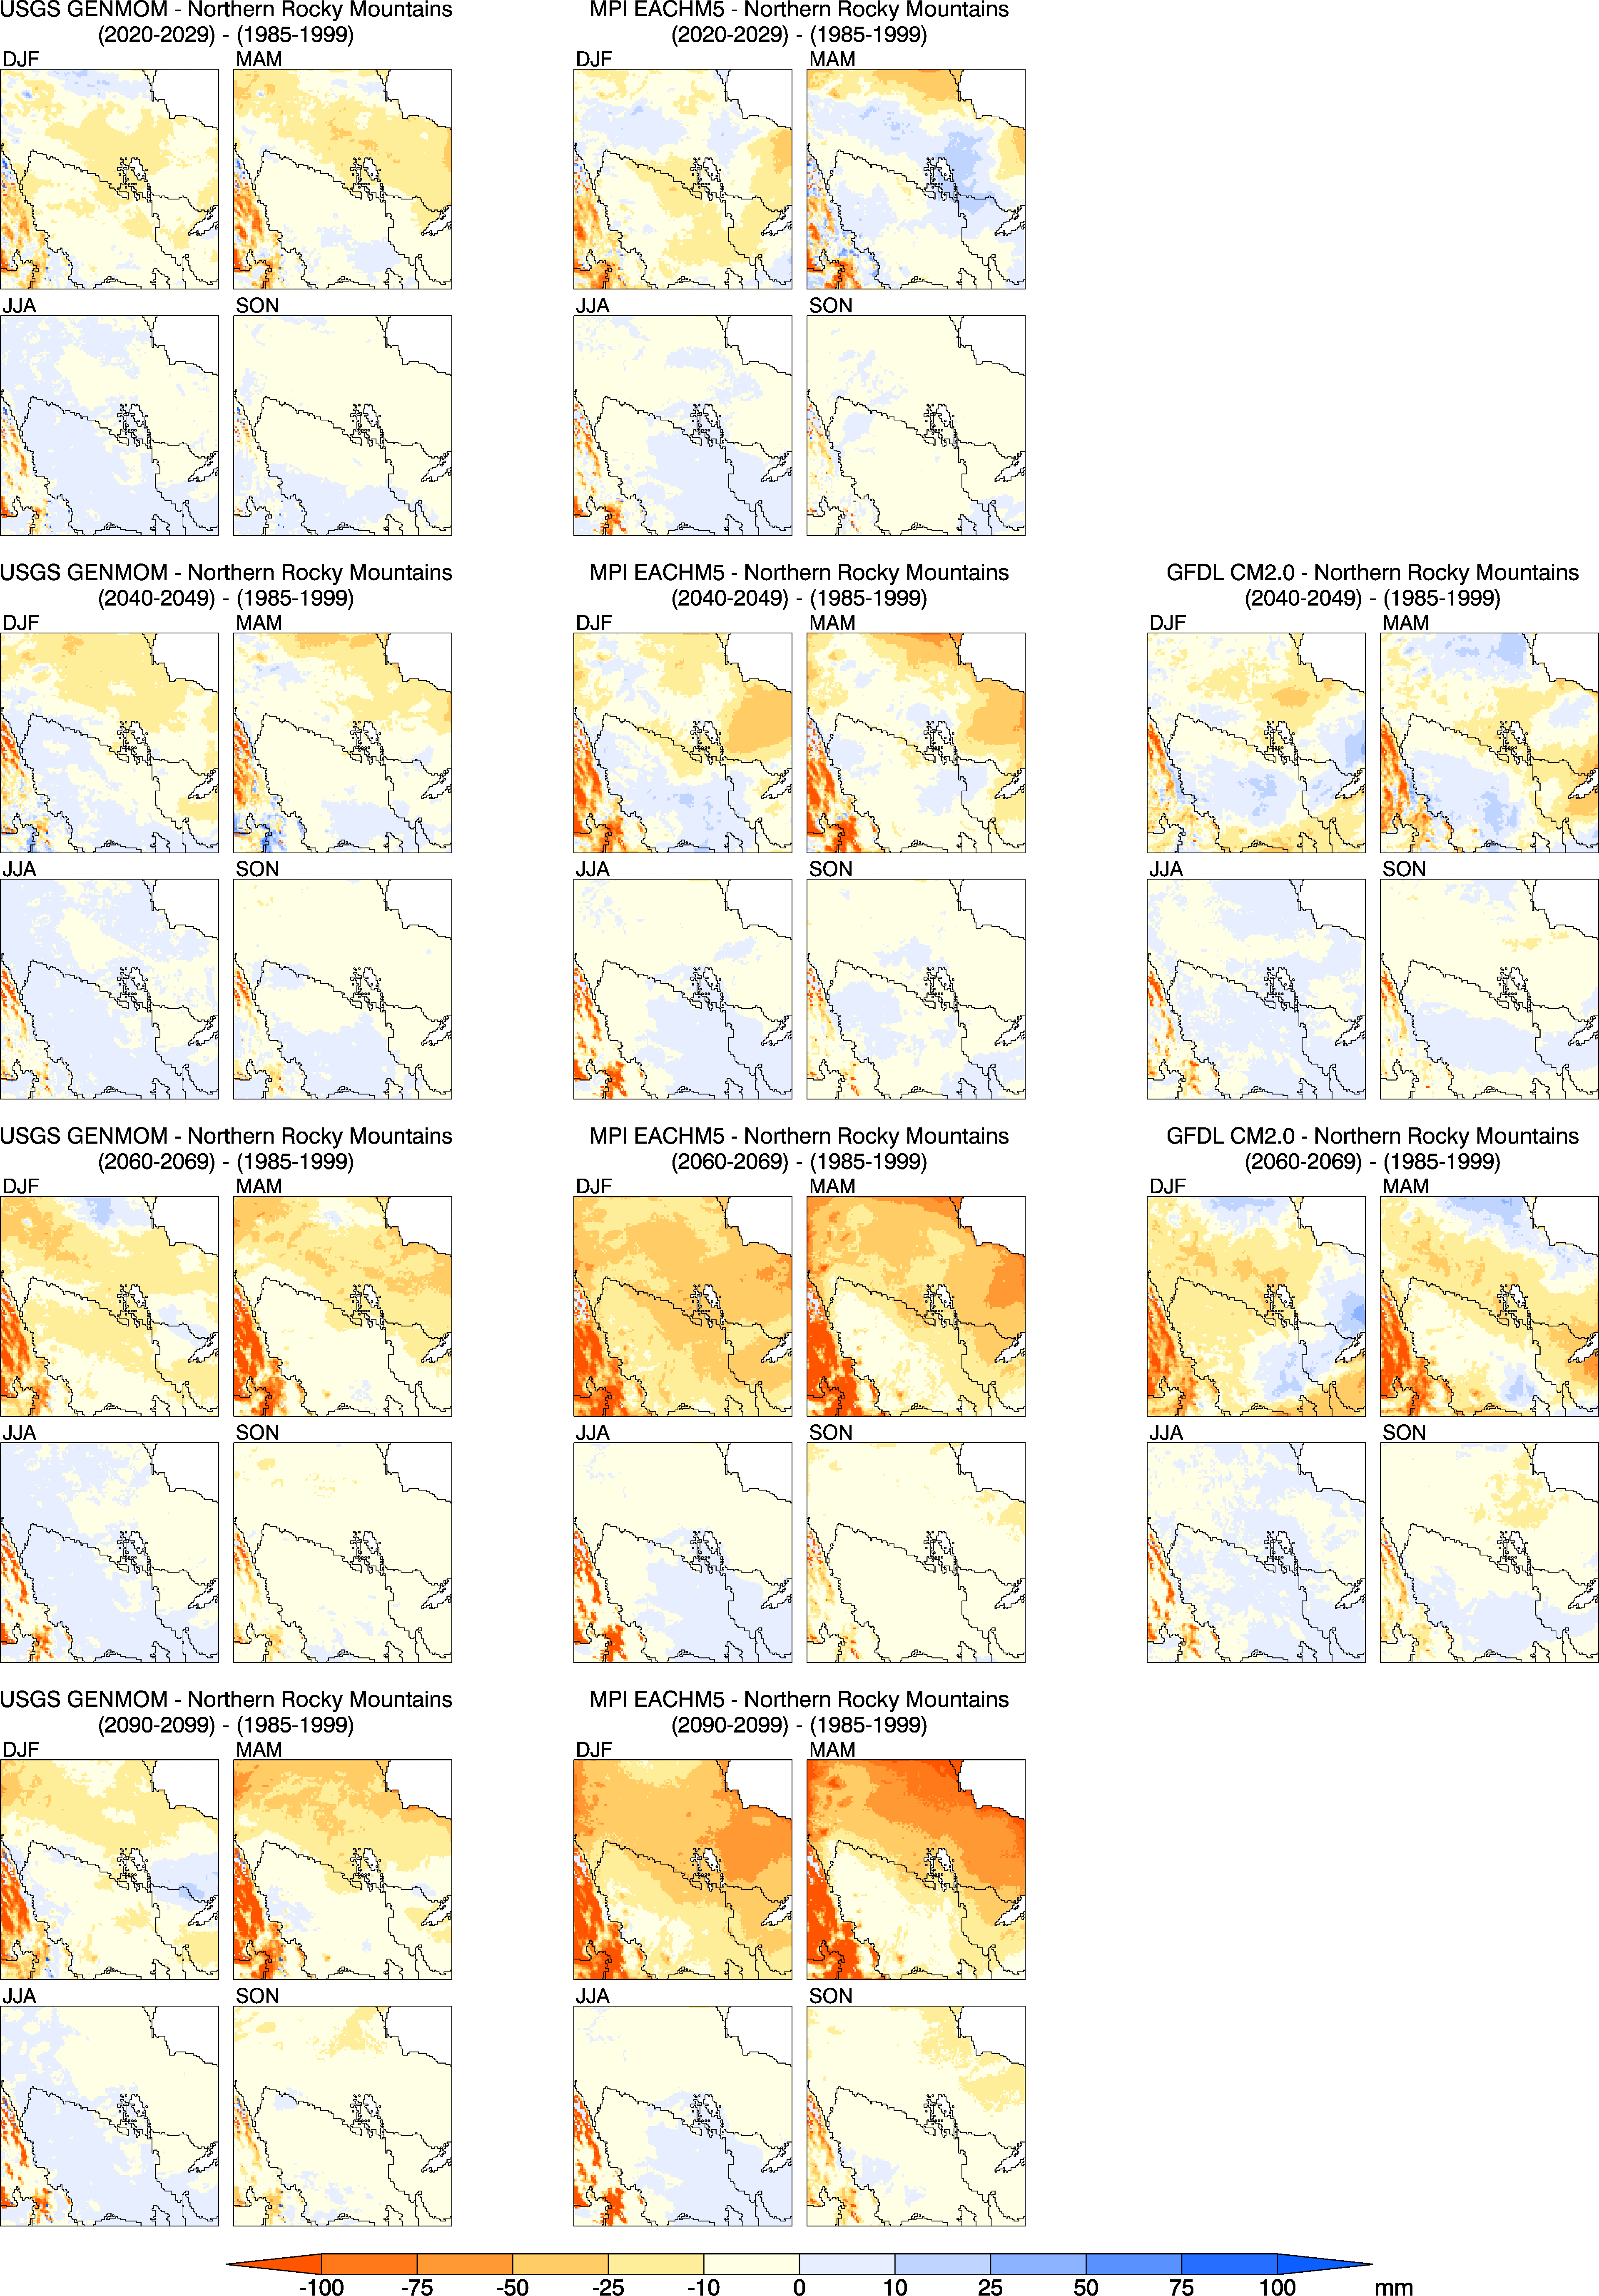
Figure 22. Differences between seasonal average root-zone soil moisture climatologies for future decades (2020–2029, 2040–2049, 2060–2069, and 2090–2099) versus 1985–1999 over the NRM domain for the three RegCM3 projections.
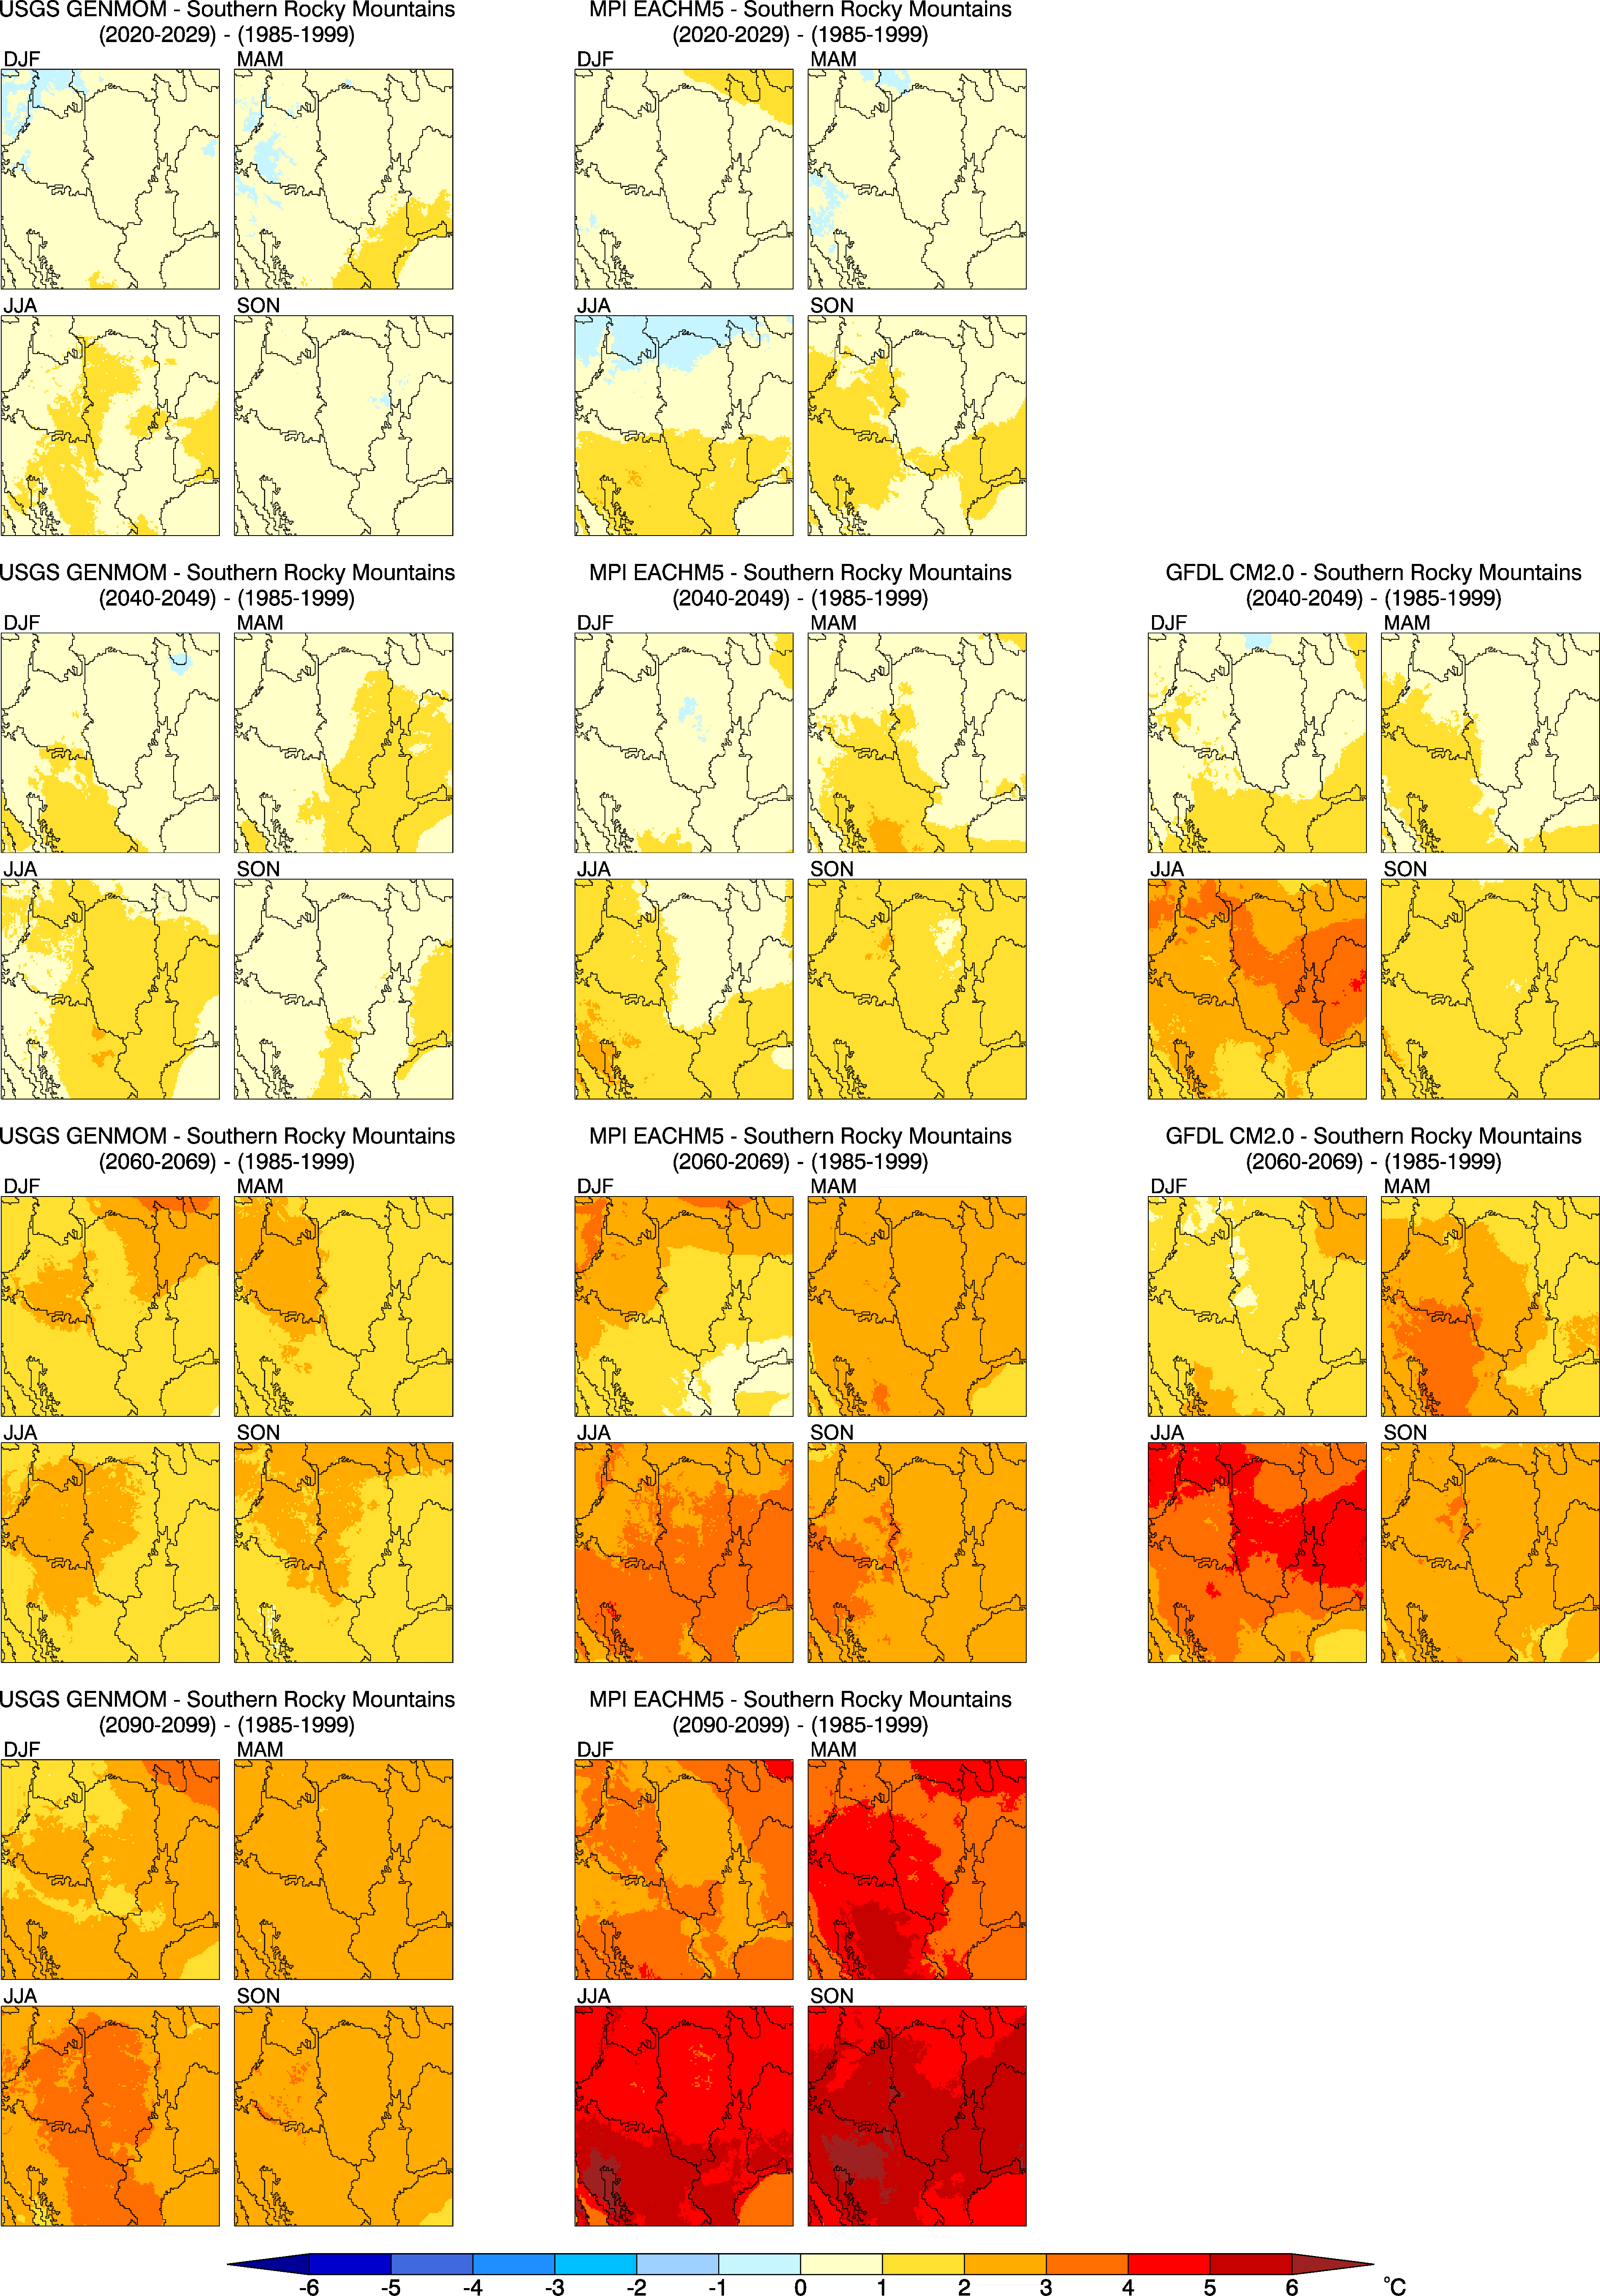
Figure 23. Differences between seasonal average 2-m air temperature climatologies for future decades (2020–2029, 2040–2049, 2060–2069, and 2090–2099) versus 1985–1999 over the SRM domain for the three RegCM3 projections.
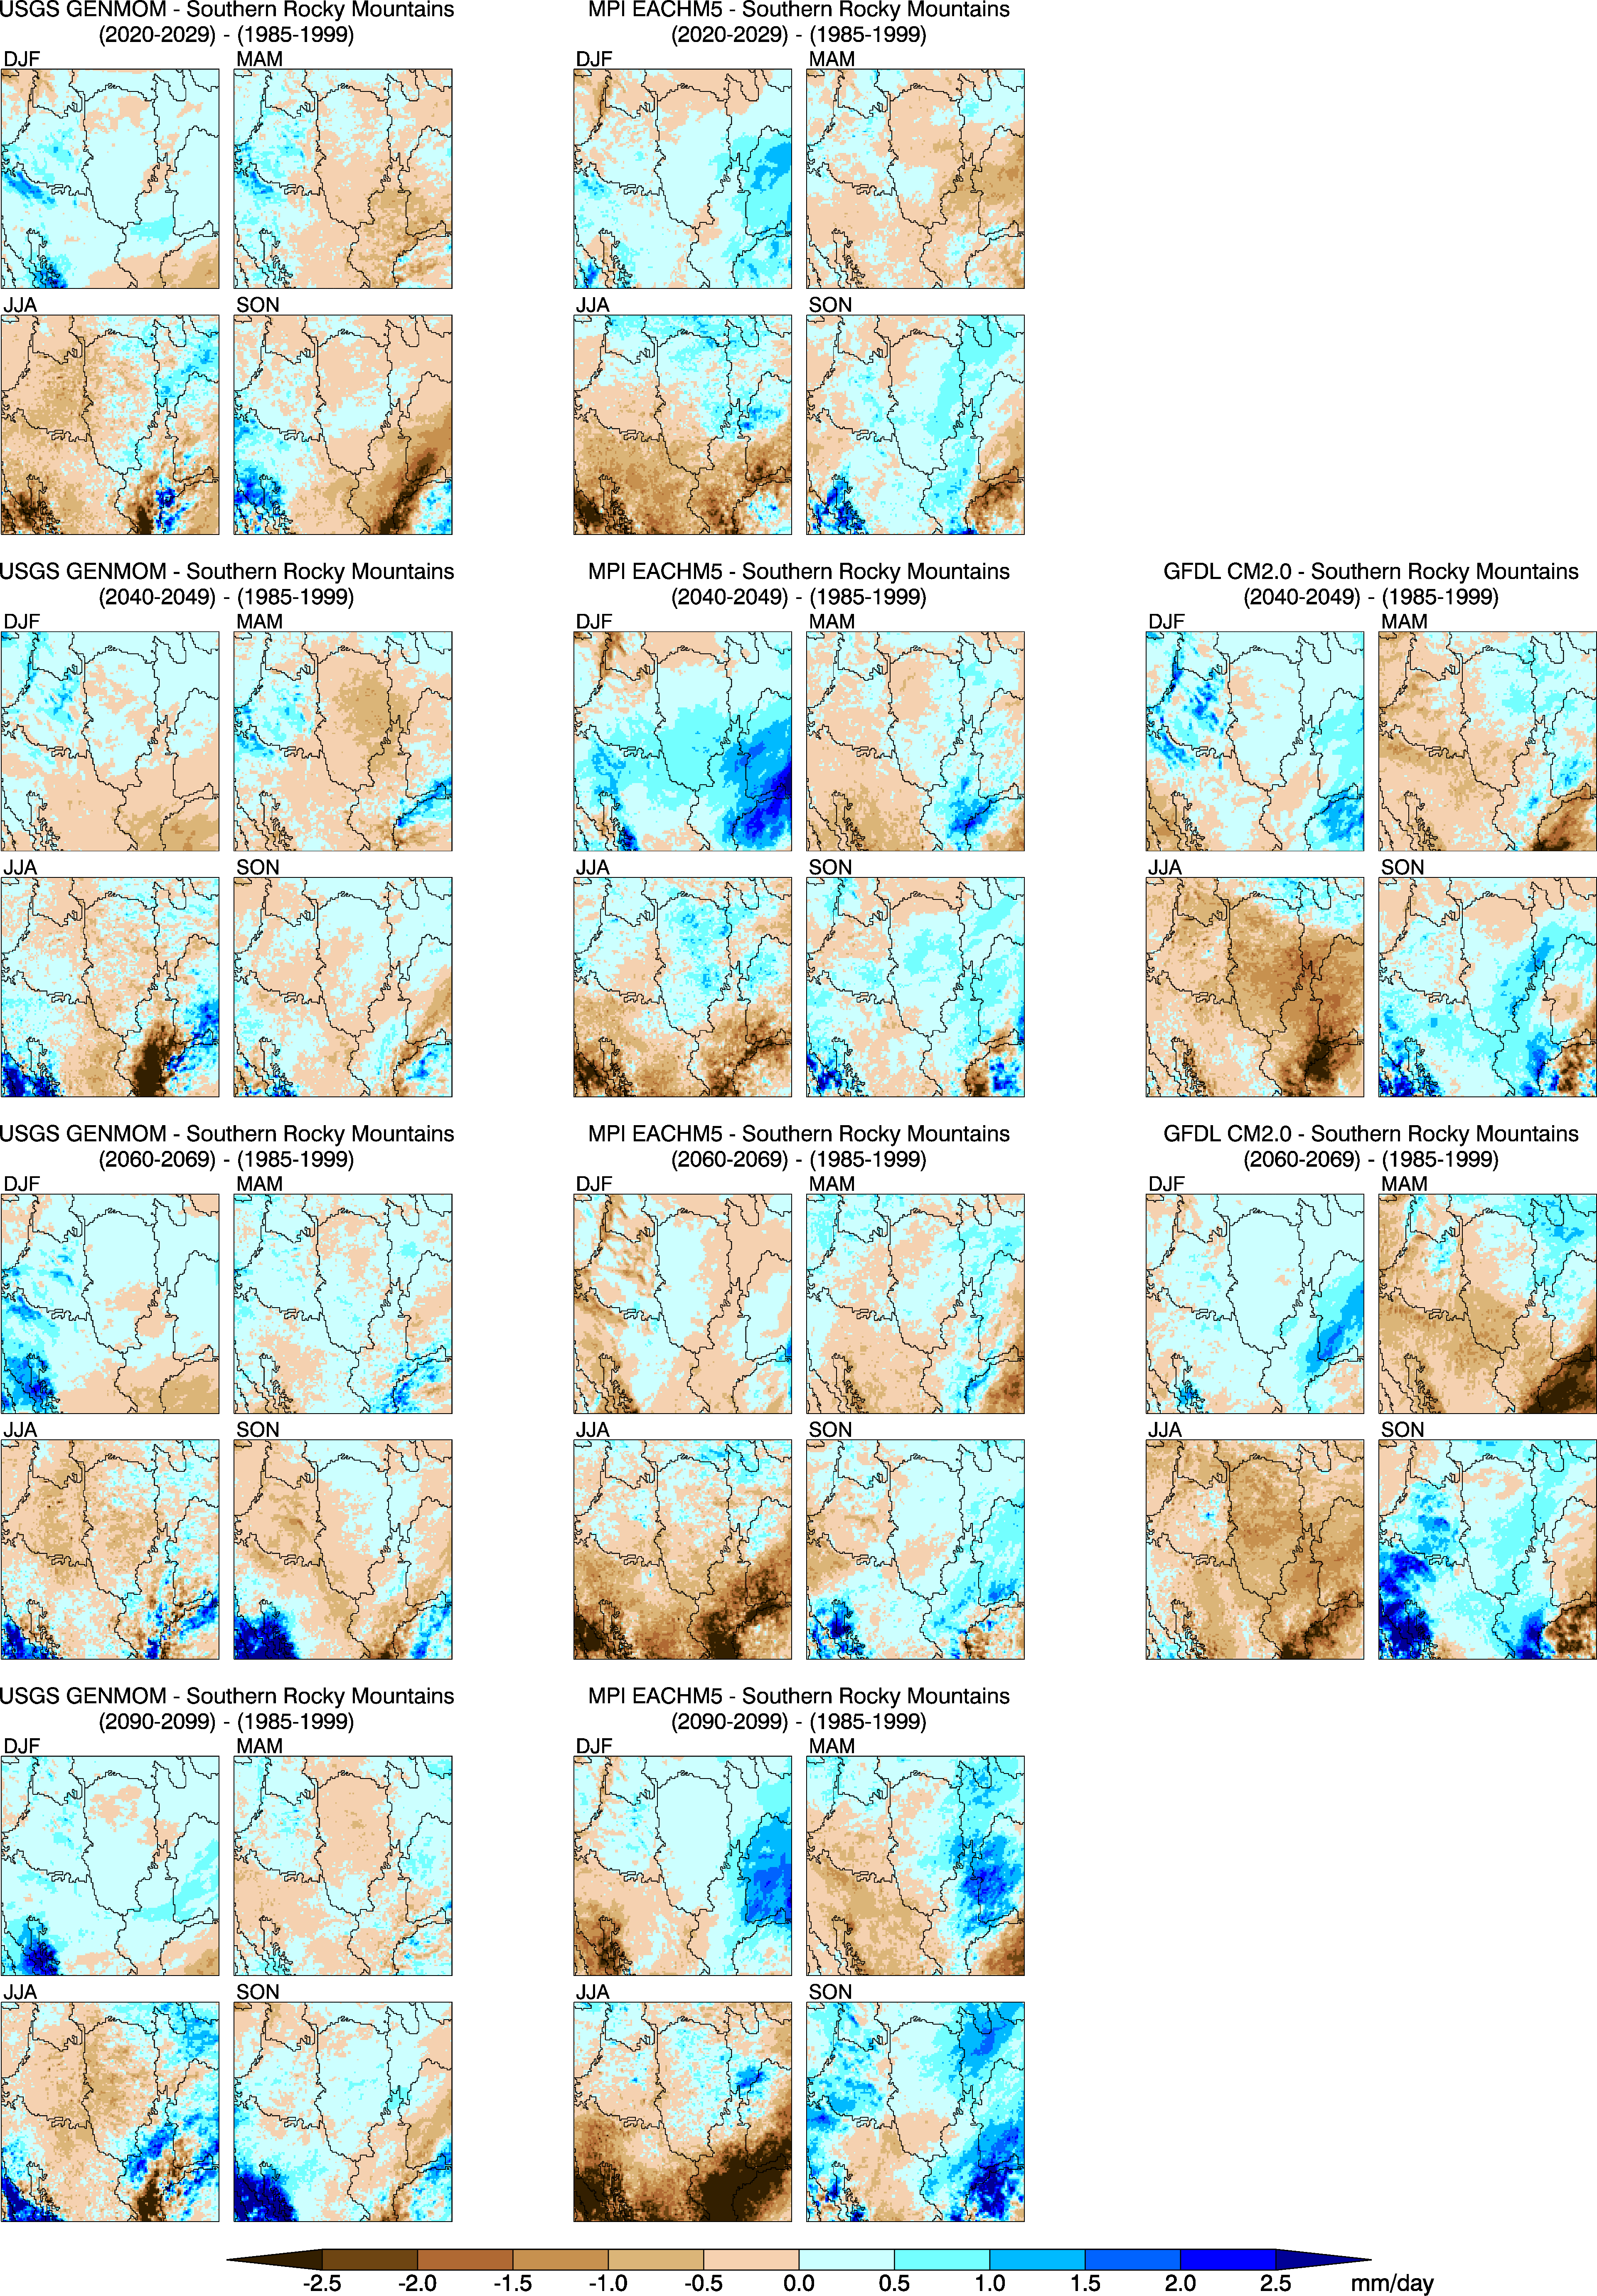
Figure 24. Differences between seasonal average precipitation climatologies for future decades (2020–2029, 2040–2049, 2060–2069, and 2090–2099) versus 1985–1999 over the SRM domain for the three RegCM3 projections.
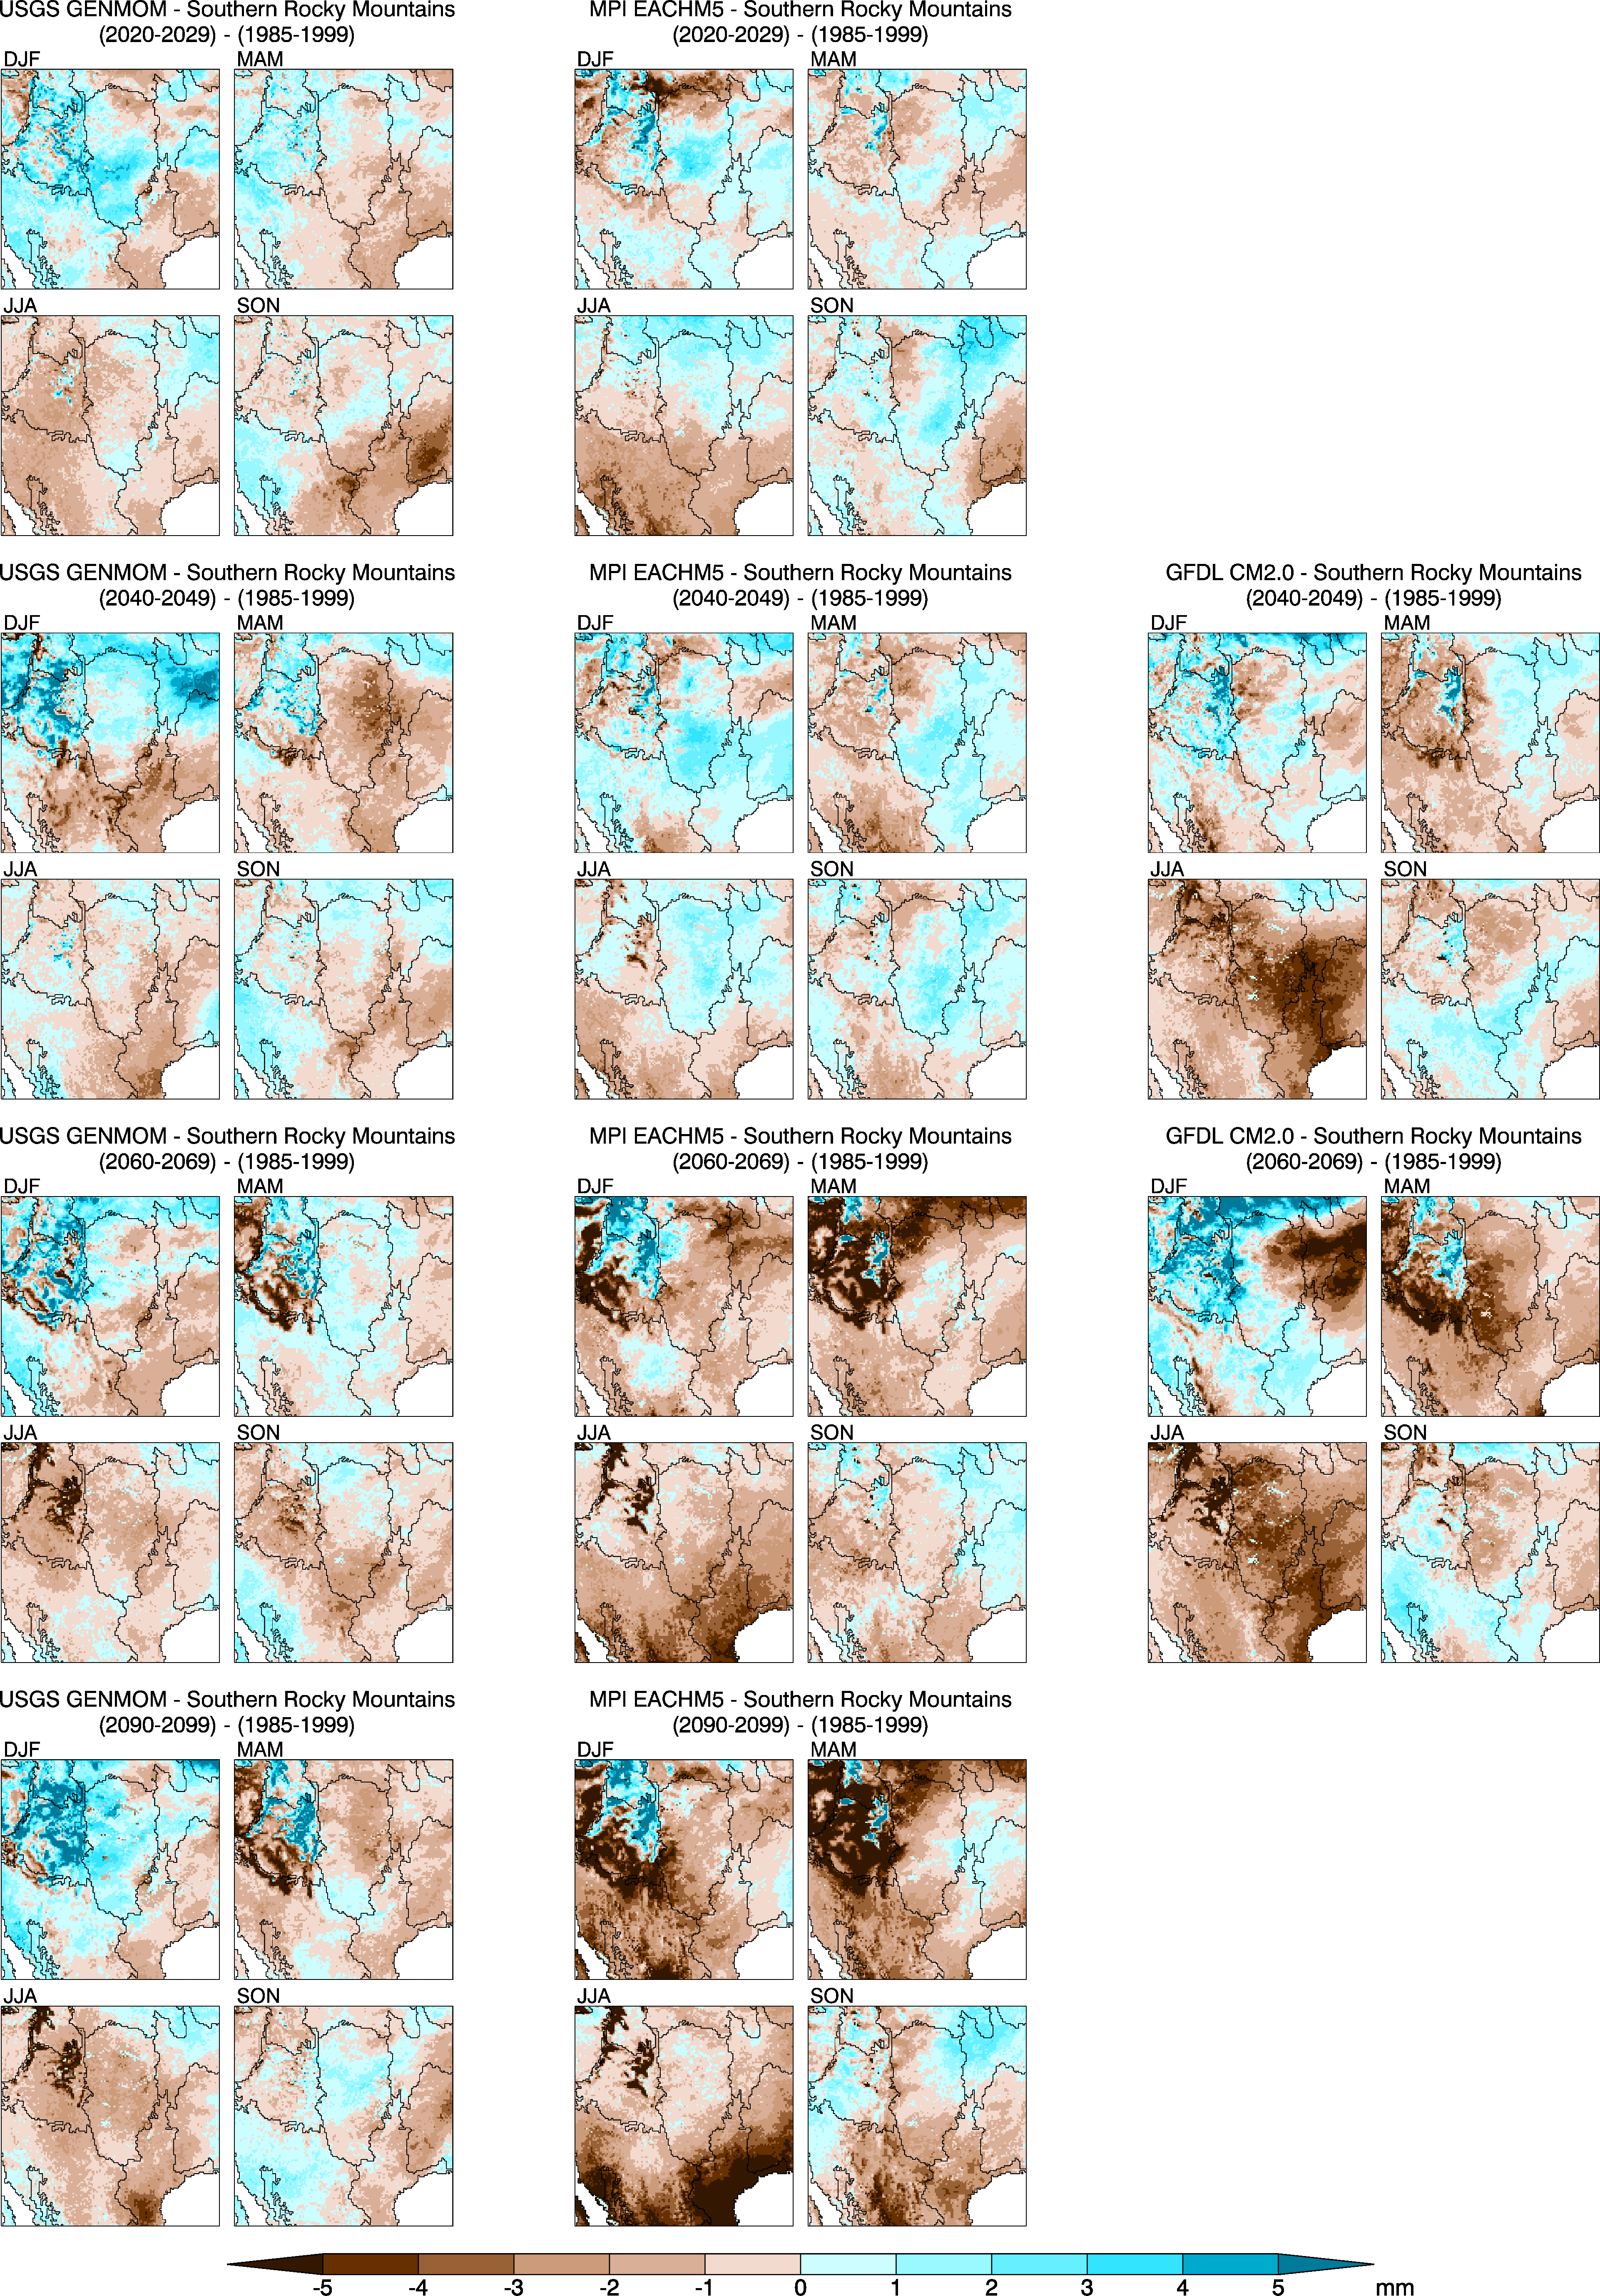
Figure 25. Differences between seasonal average snow water equivalent climatologies for future decades (2020–2029, 2040–2049, 2060–2069, and 2090–2099) versus 1985–1999 over the SRM domain for the three RegCM3 projections.
Figure 26.Differences between seasonal average root-zone soil moisture climatologies for future decades (2020–2029, 2040–2049, 2060–2069, and 2090–2099) versus 1985–1999 over the SRM domain for the three RegCM3 projections.
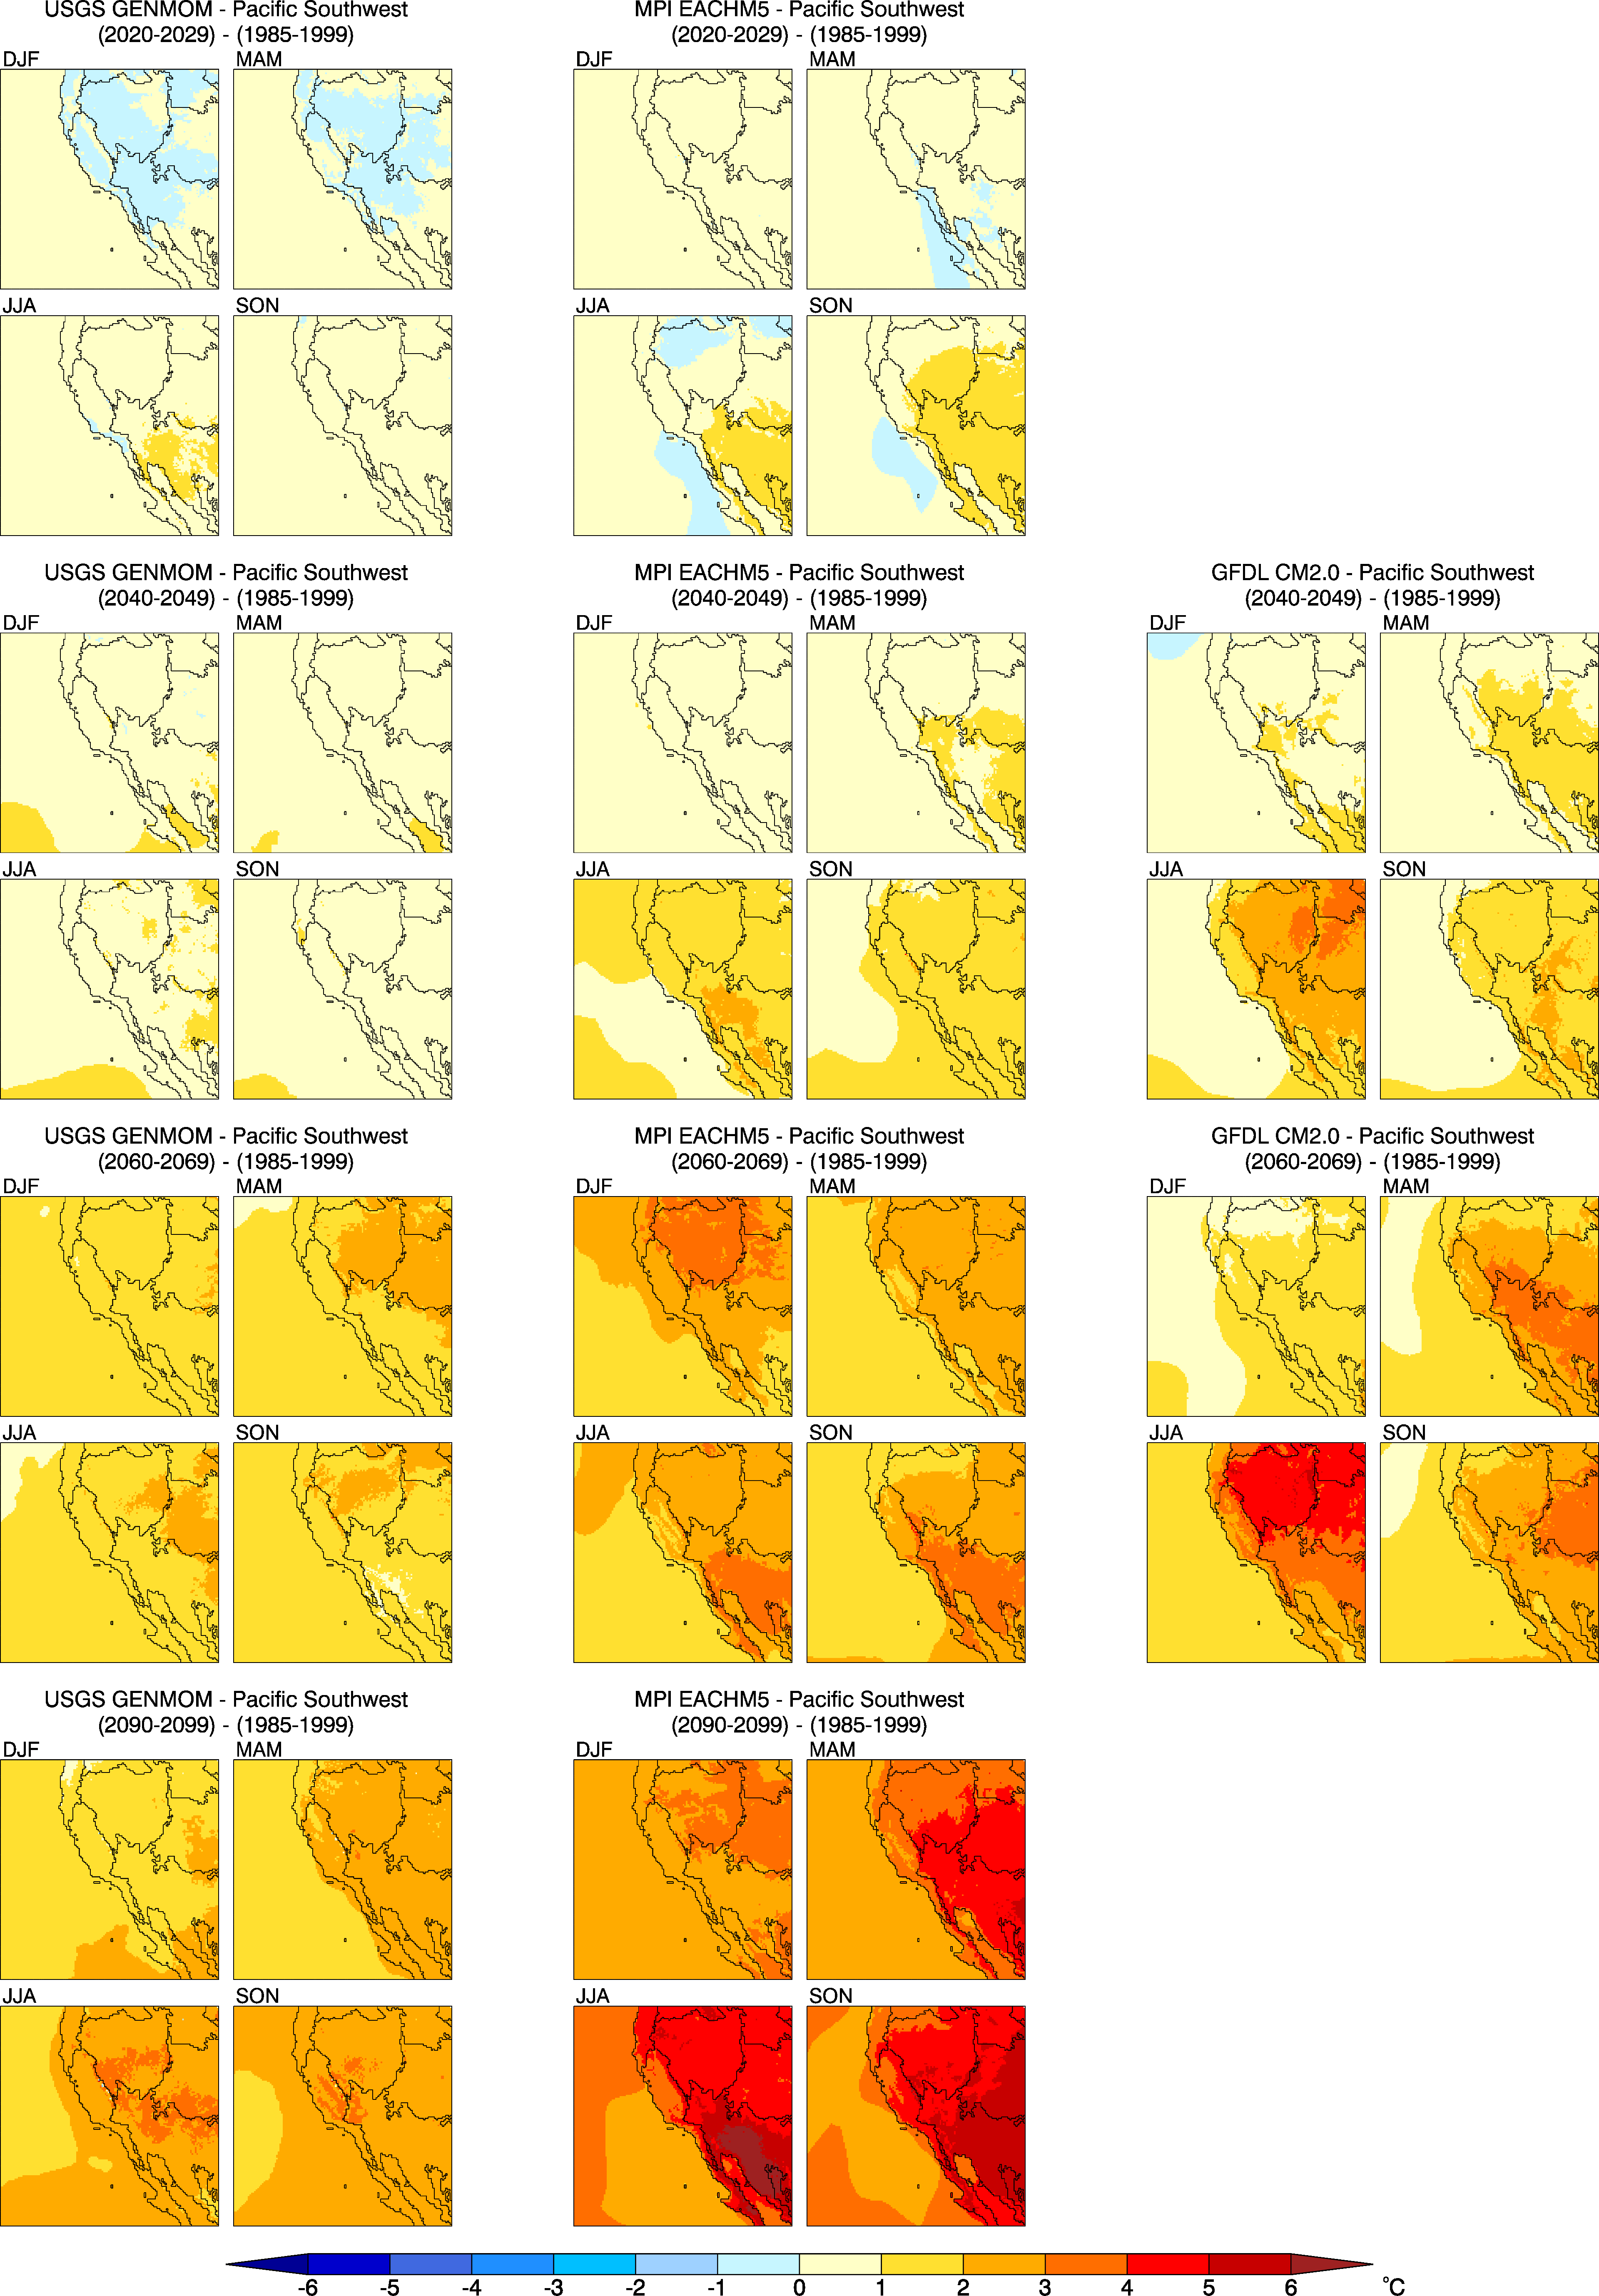
Figure 27. Differences between seasonal average 2-m air temperature climatologies for future decades (2020–2029, 2040–2049, 2060–2069, and 2090–2099) versus 1985–1999 over the PSW domain for the three RegCM3 projections.
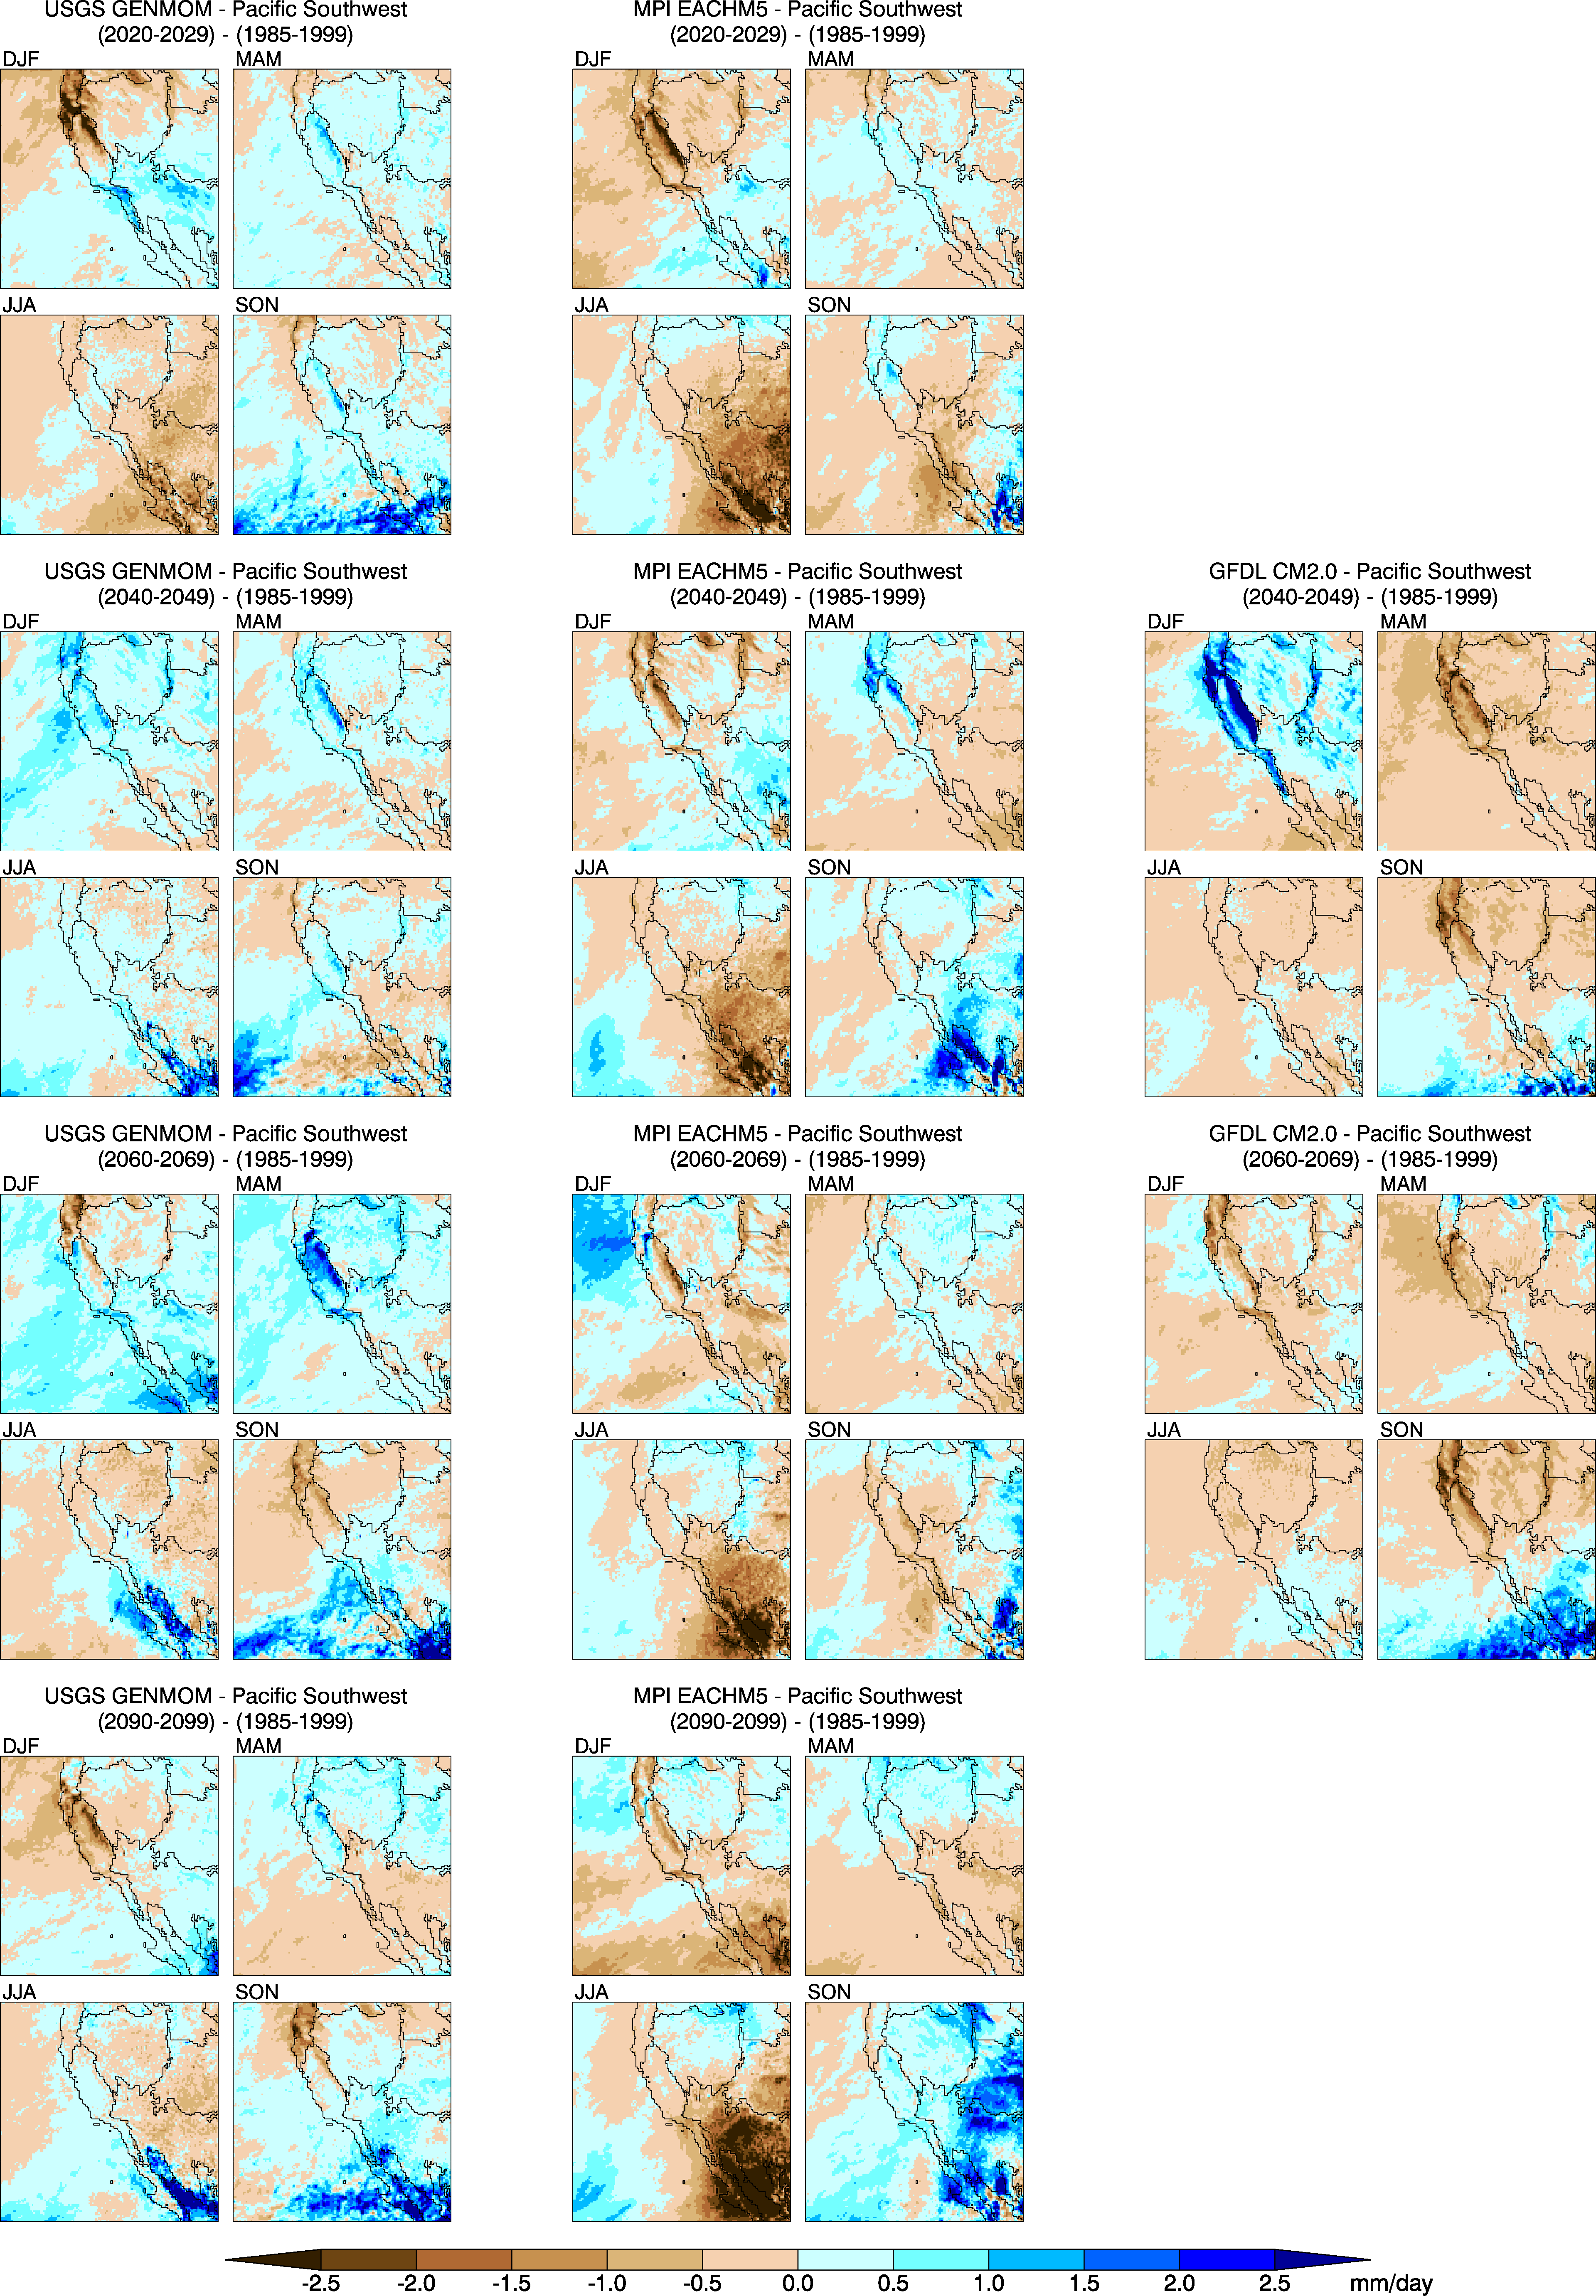
Figure 28. Differences between seasonal average precipitation climatologies for future decades (2020–2029, 2040–2049, 2060–2069, and 2090–2099) versus 1985–1999 over the PSW domain for the three RegCM3 projections.
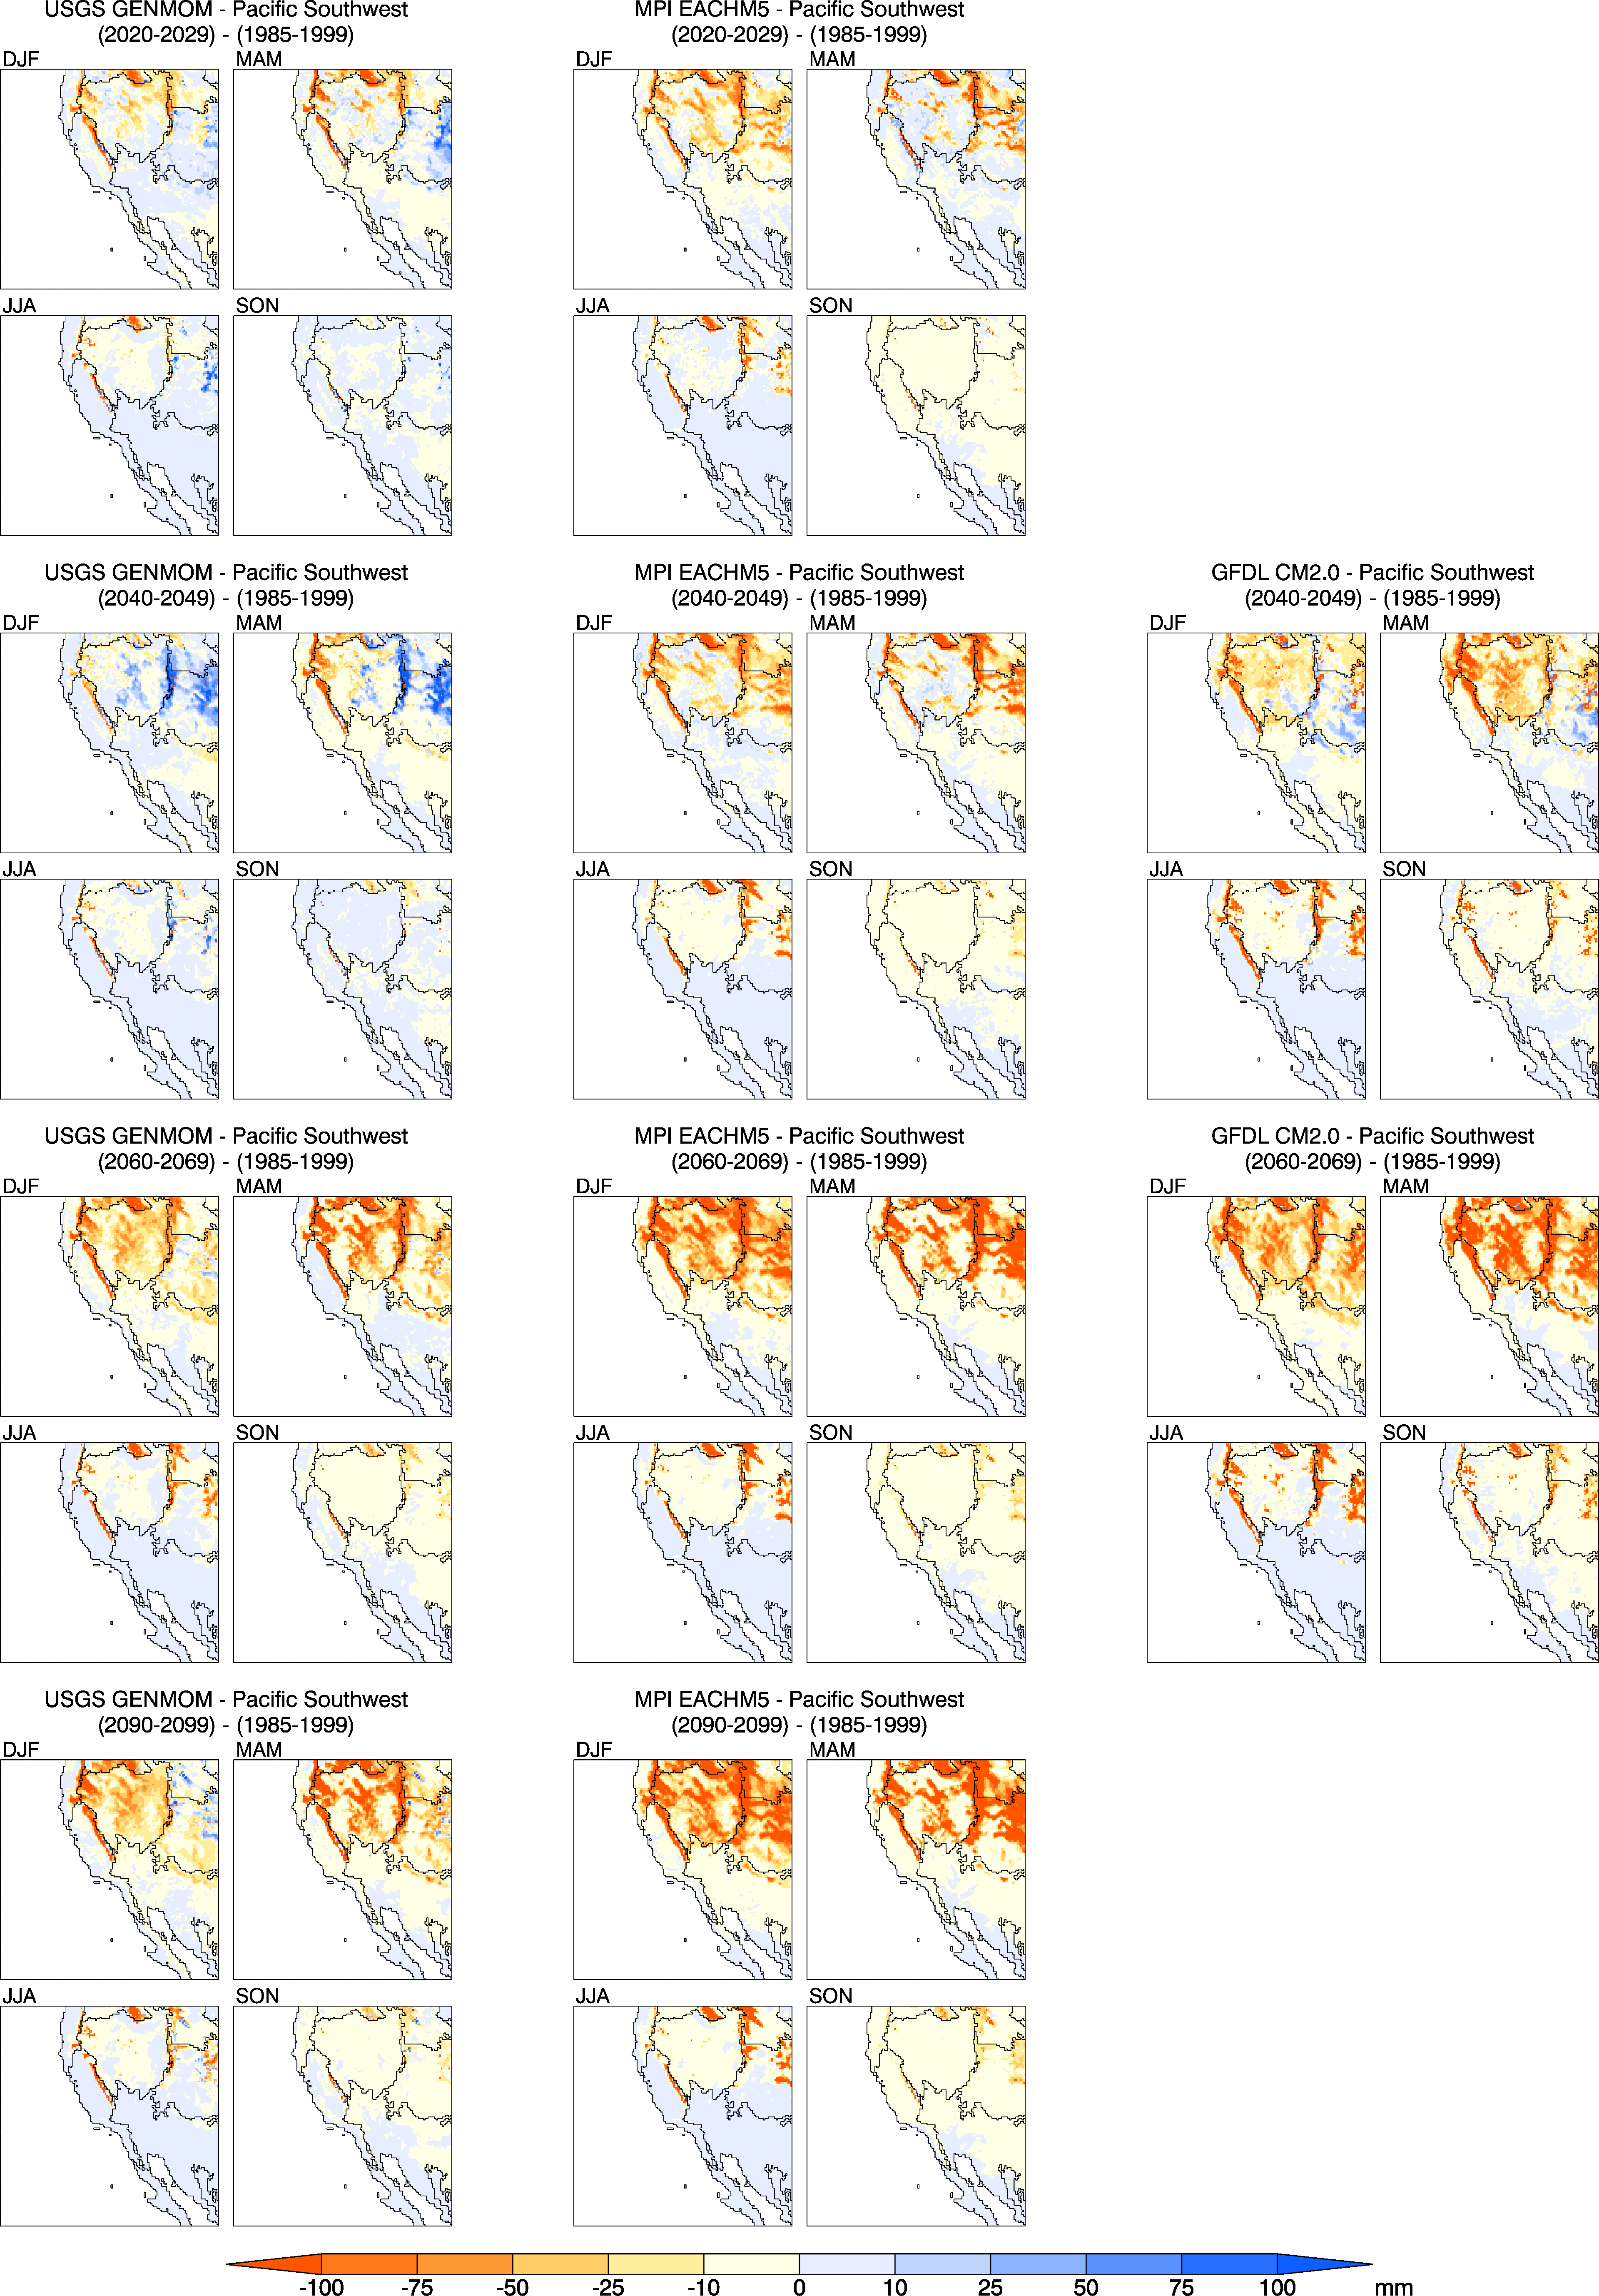
Figure 29. Differences between seasonal average snow water equivalent climatologies for future decades (2020–2029, 2040–2049, 2060–2069, and 2090–2099) versus 1985–1999 over the PSW domain for the three RegCM3 projections.
Figure 30. Differences between seasonal average root-zone soil moisture climatologies for future decades (2020–2029, 2040–2049, 2060–2069, and 2090–2099) versus 1985–1999 over the PSW domain for the three RegCM3 projections.
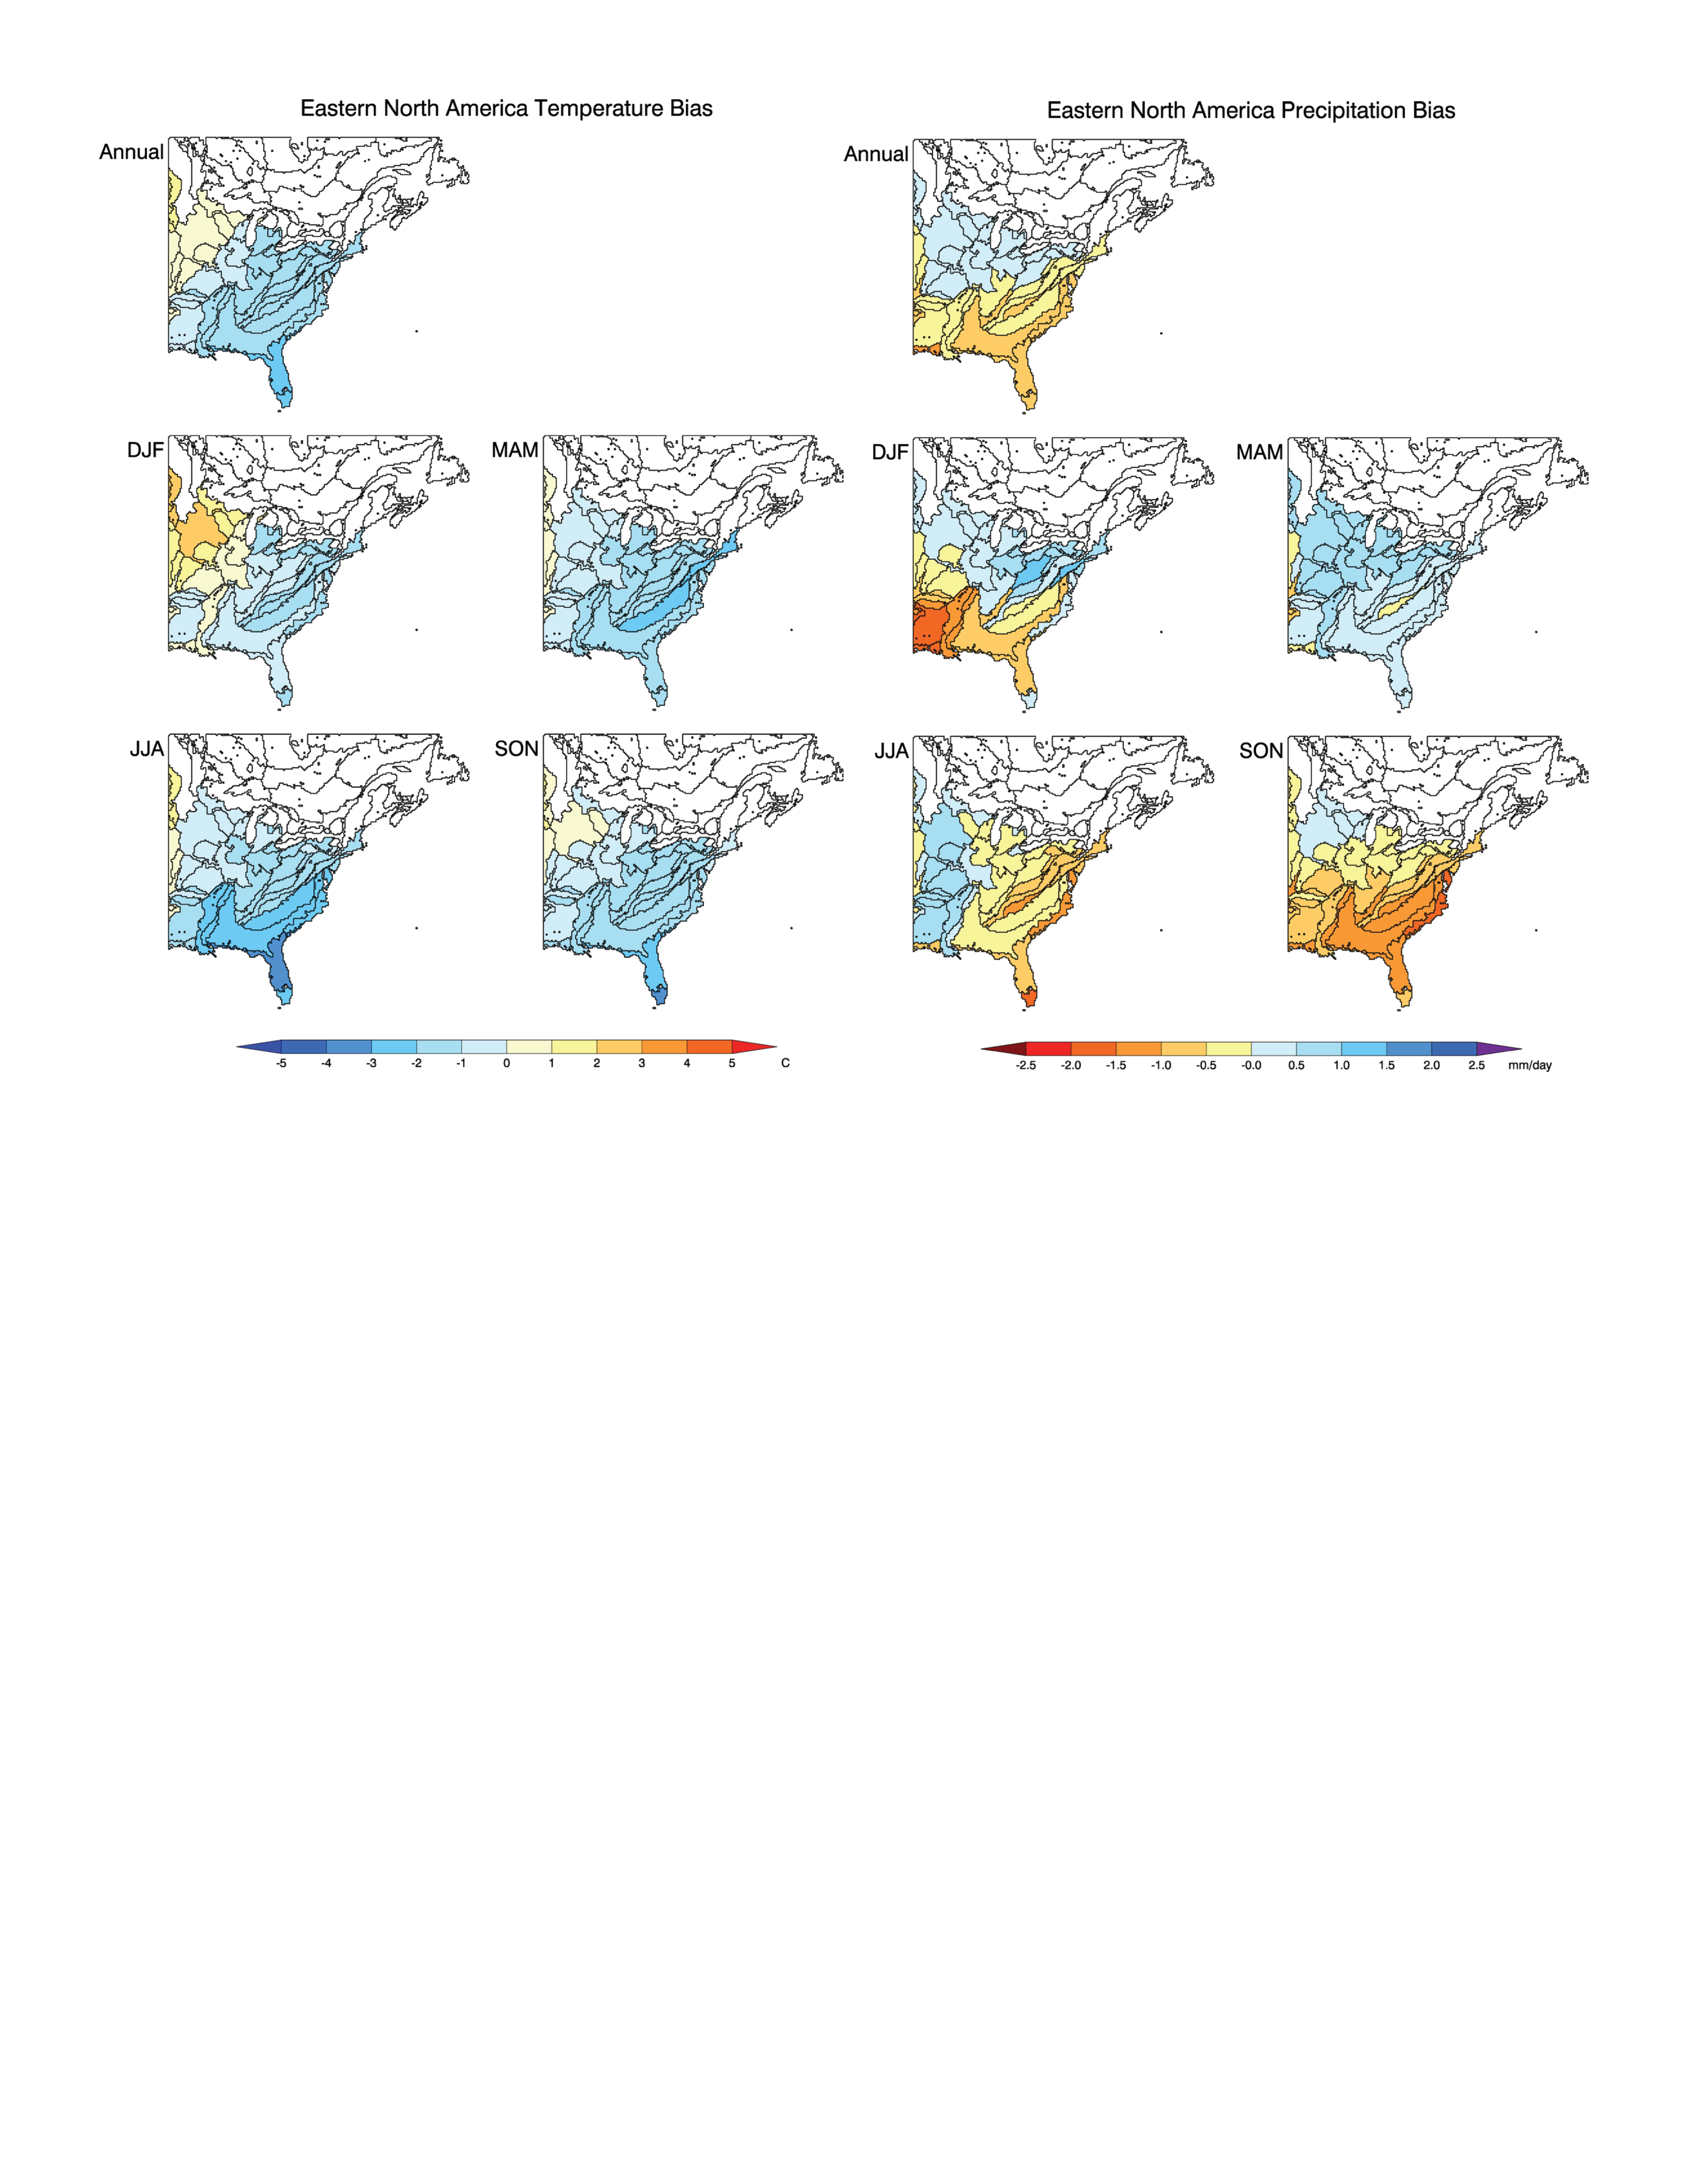
Figure 31. Annual and seasonal differences (biases) between simulated 2-m air temperatures (left) and precipitation rates (right) and PRISM values averaged over the EPA Level III ecoregions for the ENA domain.
Figure 32. Seasonal average climatologies (averaging period is 1985–1999) over the ENA domain for the four RegCM3 simulations.
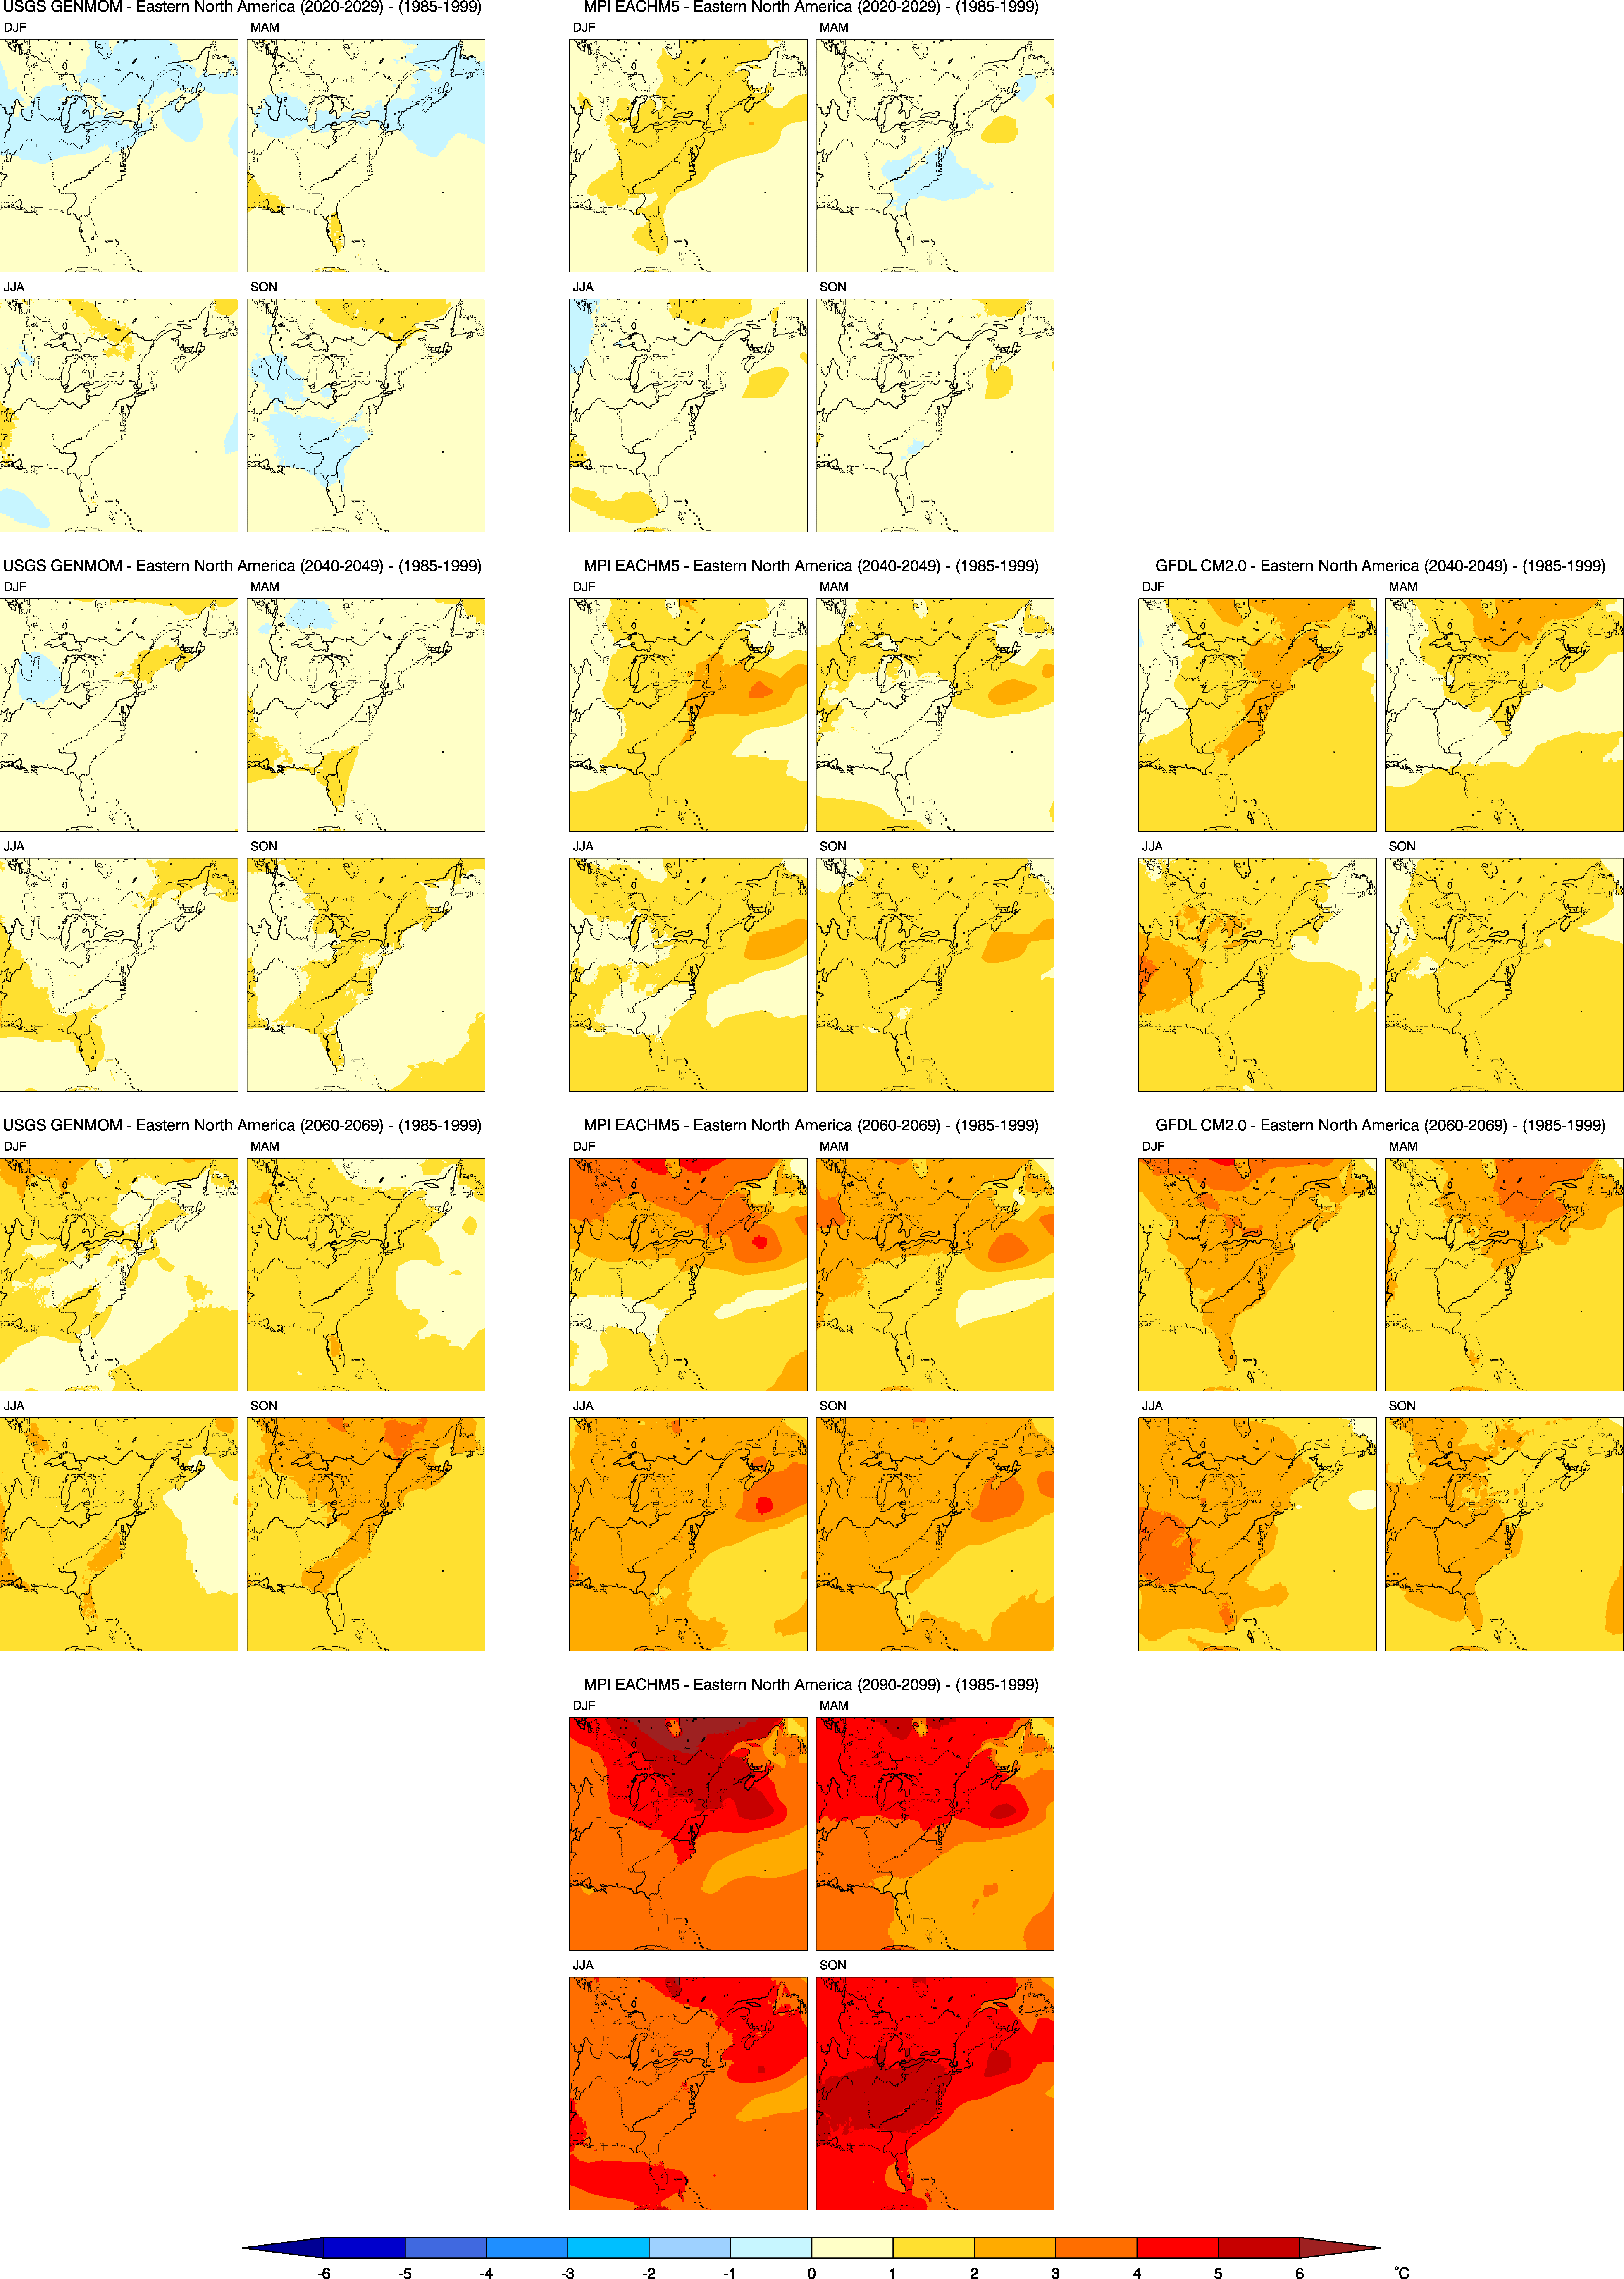
Figure 33. Differences between seasonal average 2-m air temperature climatologies for future decades (2020–2029, 2040–2049, 2060–2069, and 2090–2099) versus 1985–1999 over the ENA domain for the three RegCM3 projections.
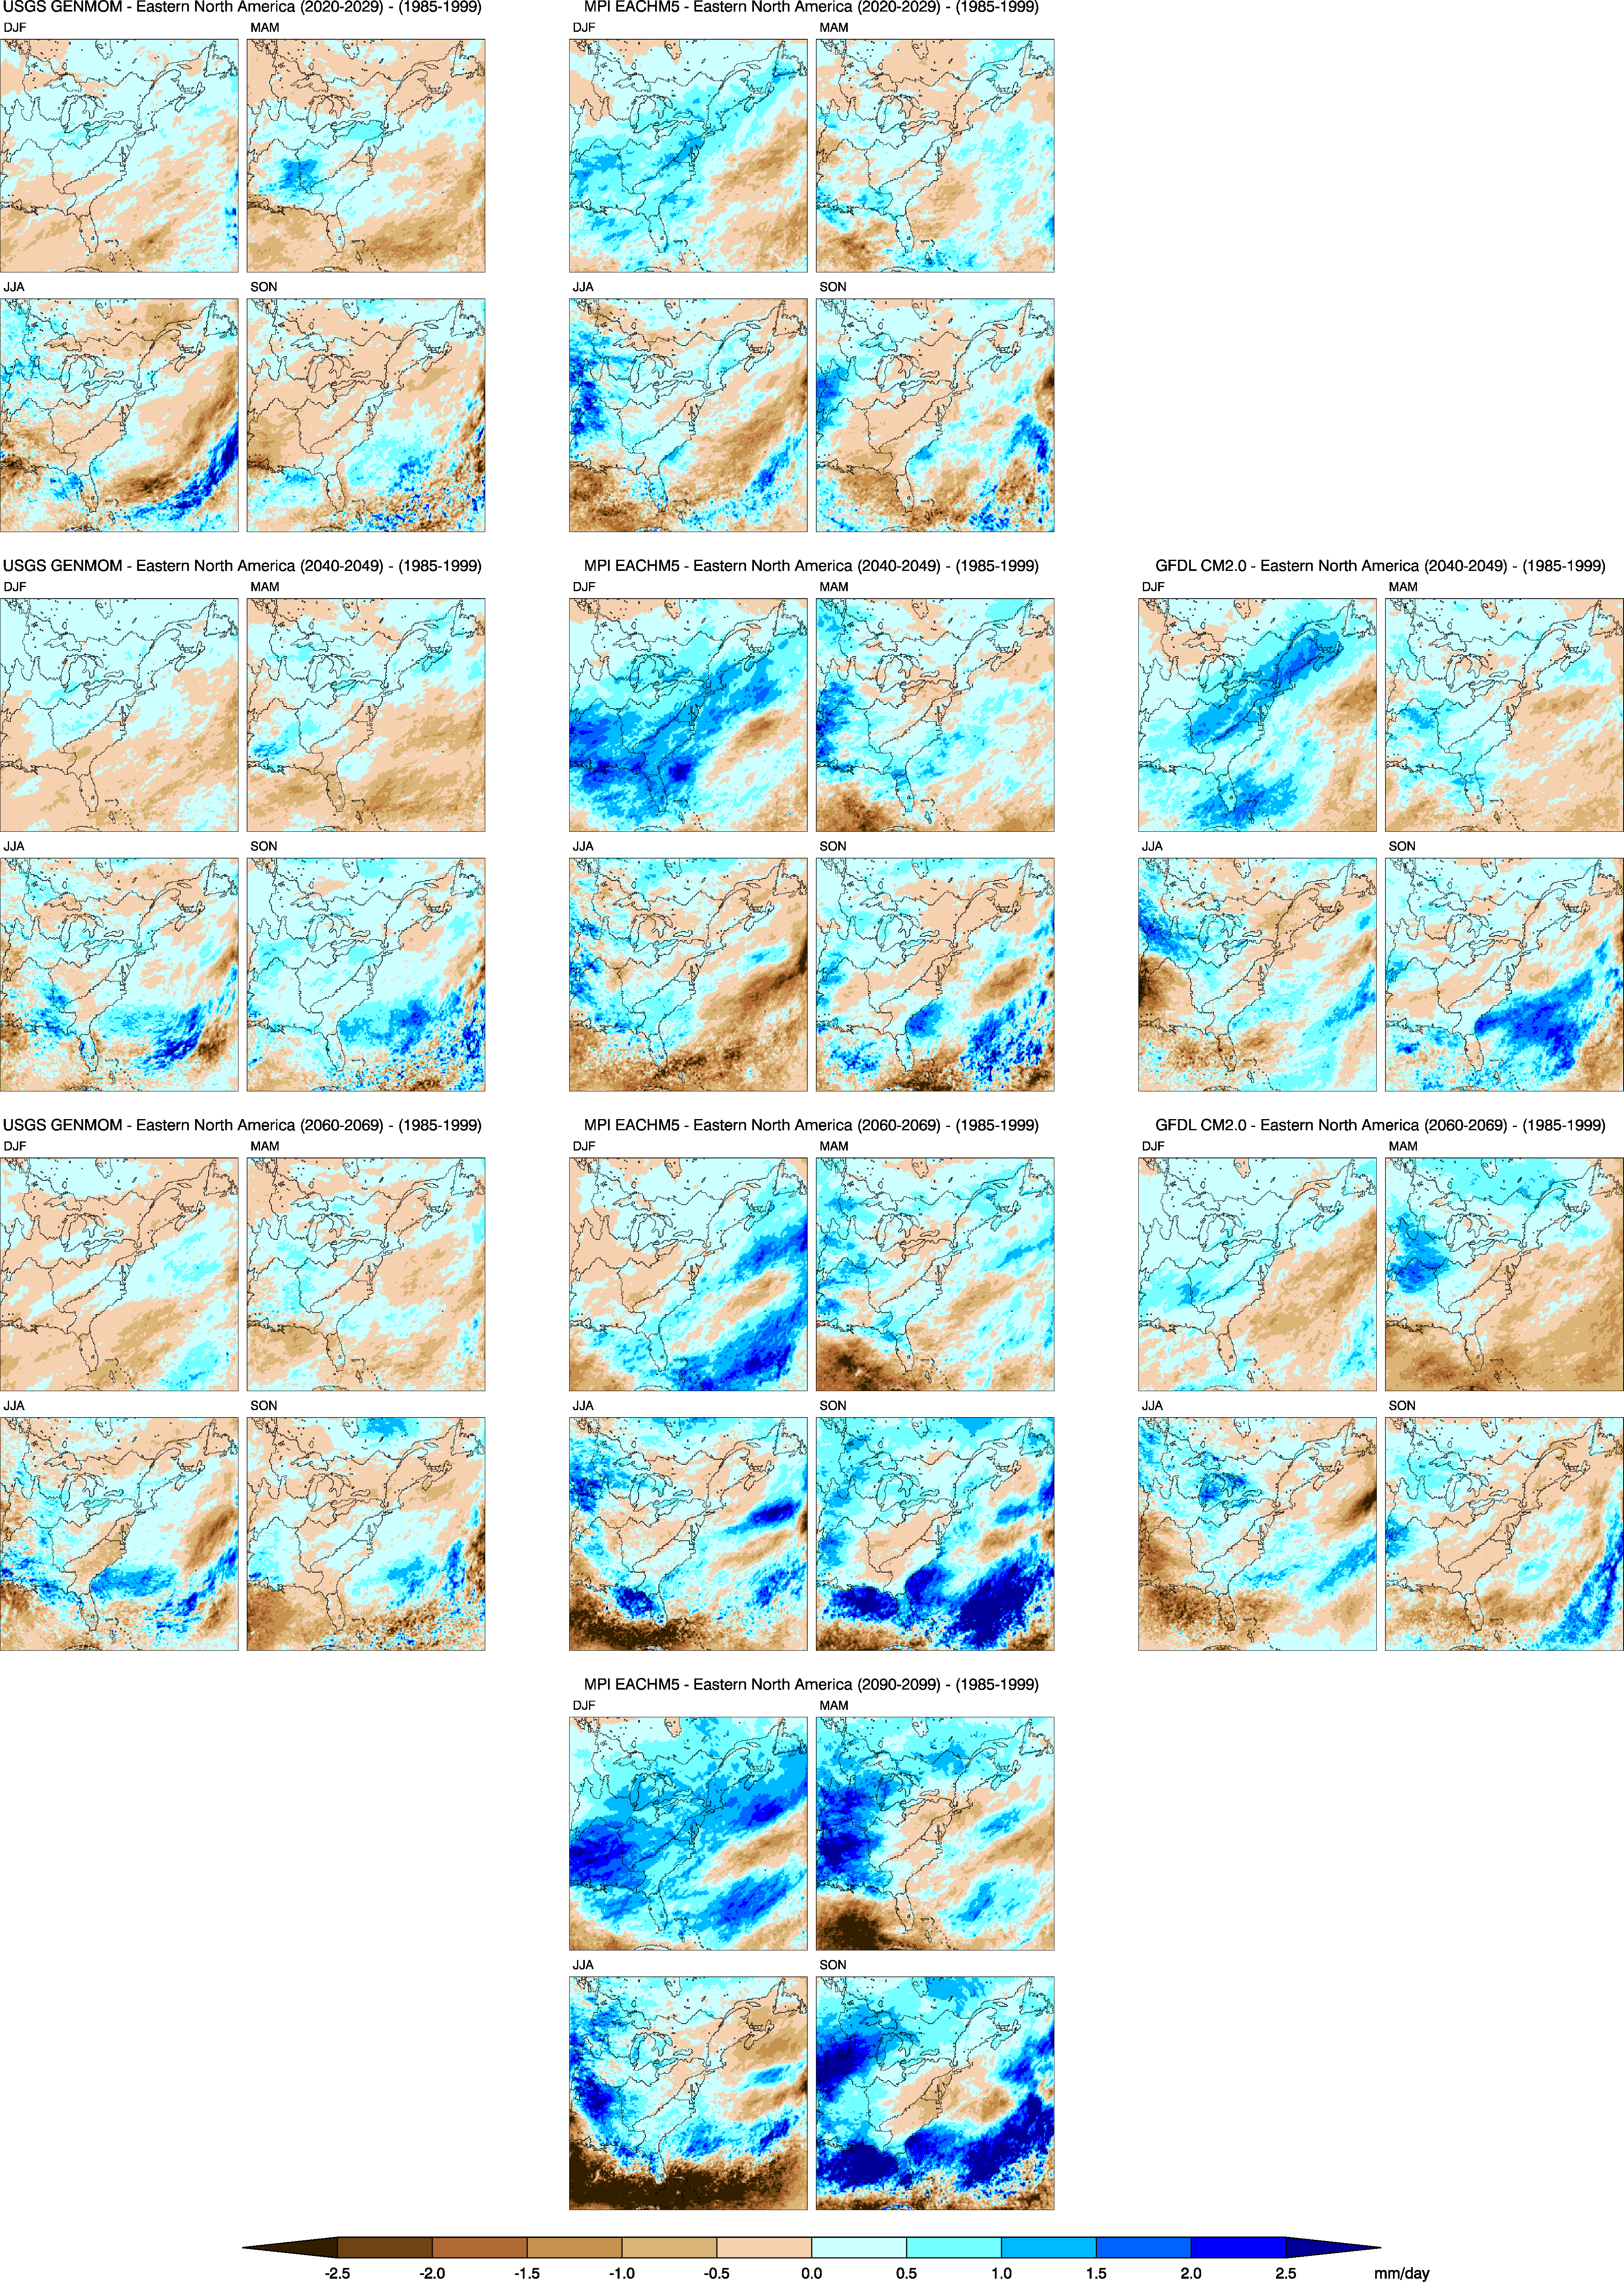
Figure 34. Differences between seasonal average precipitation climatologies for future decades (2020–2029, 2040–2049, 2060–2069, and 2090–2099) versus 1985–1999 over the ENA domain for the three RegCM3 projections.
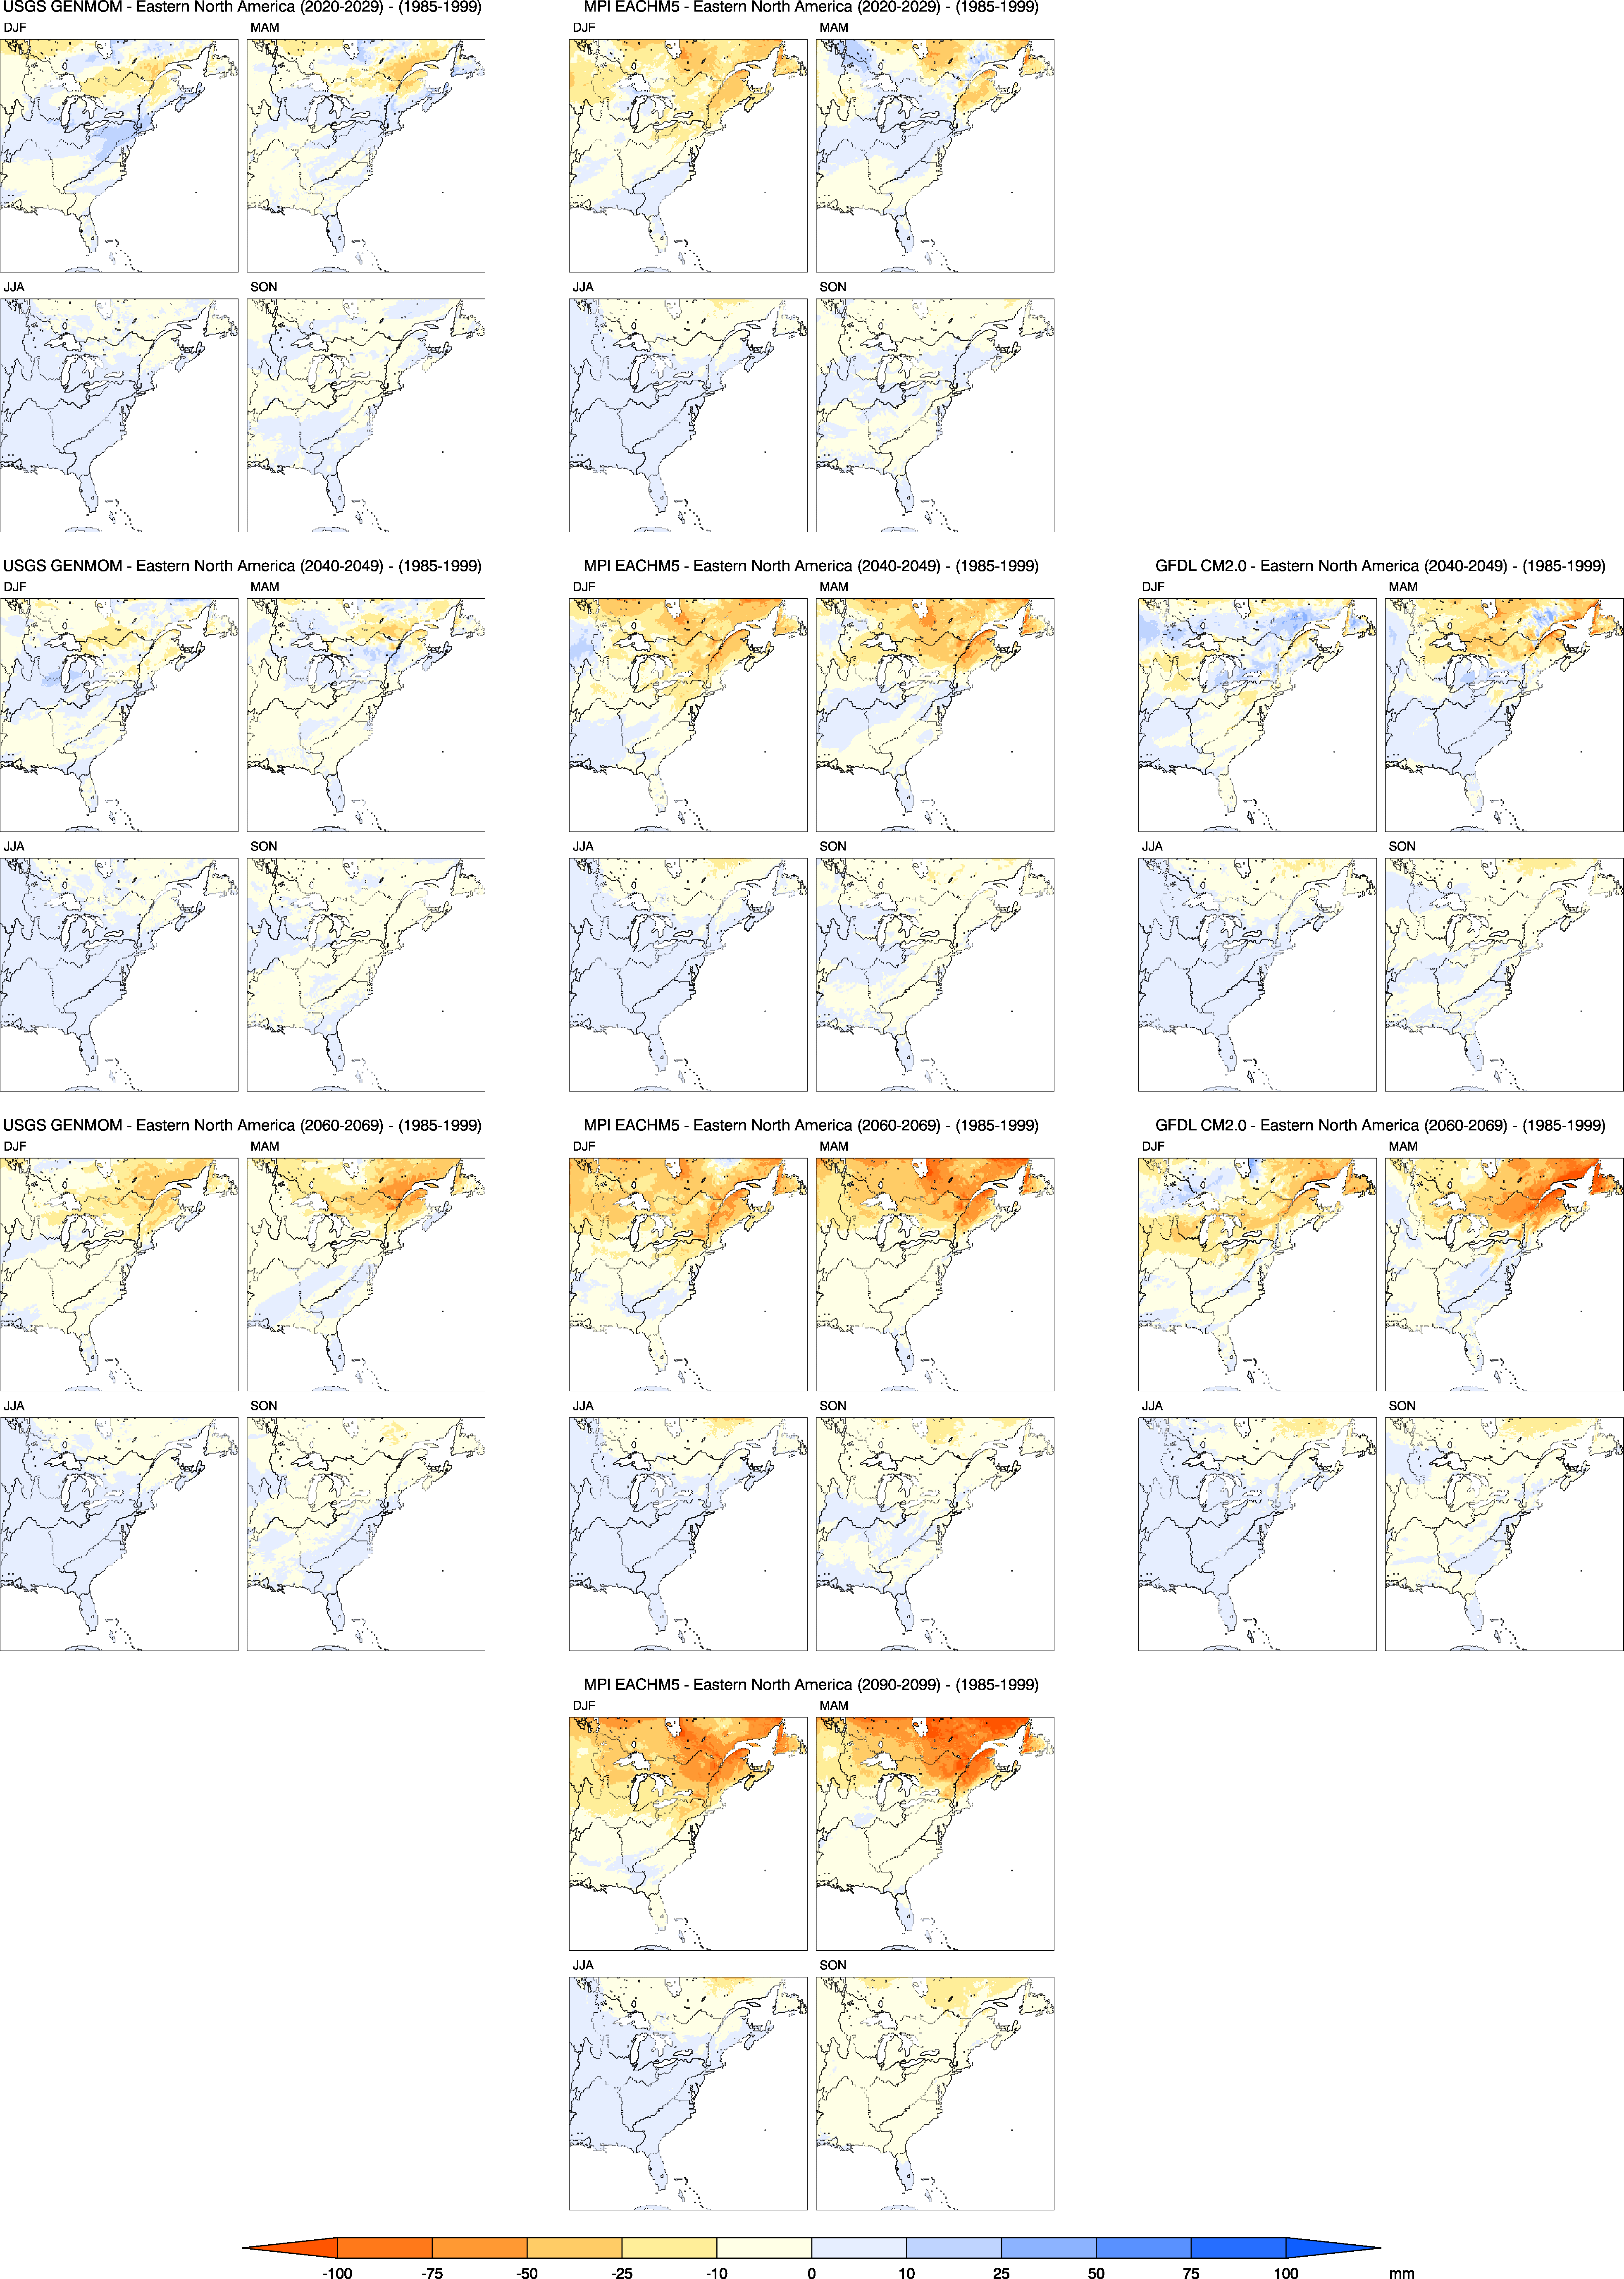
Figure 35. Differences between seasonal average snow water equivalent climatologies for future decades (2020–2029, 2040–2049, 2060–2069, and 2090–2099) versus 1985–1999 over the ENA domain for the three RegCM3 projections.
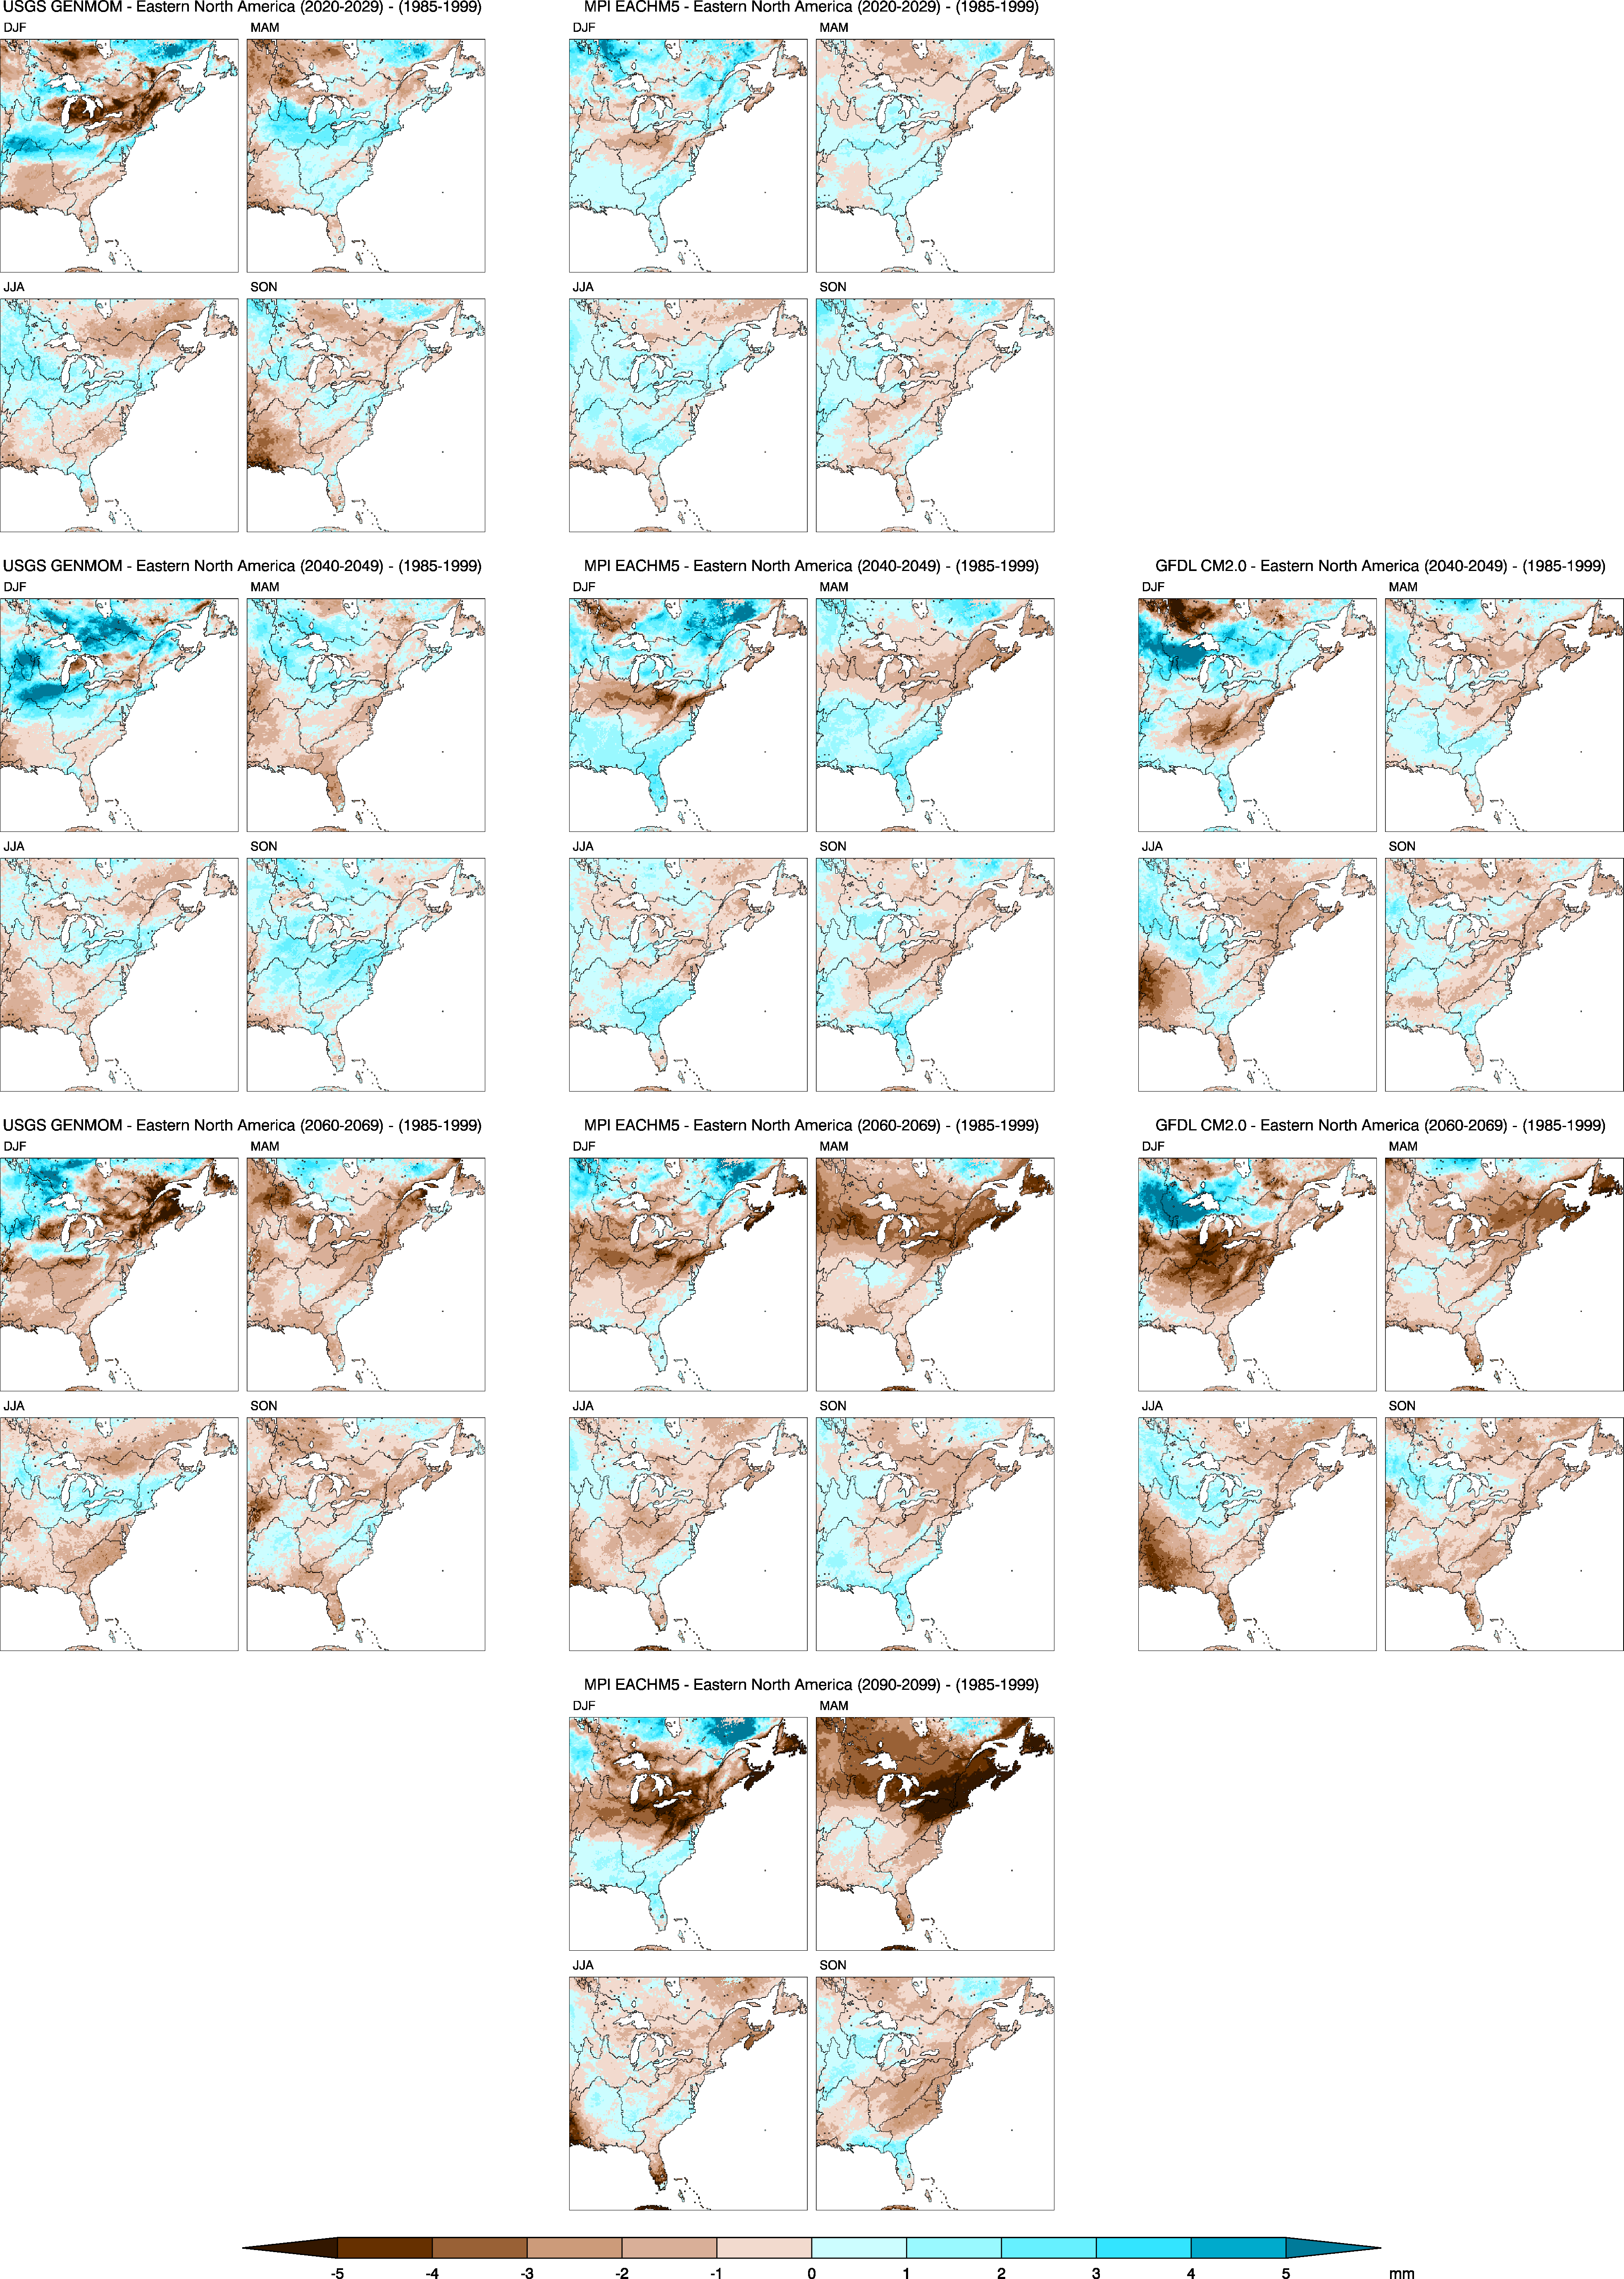
Figure 36. Differences between seasonal average root-zone soil moisture climatologies for future decades (2020–2029, 2040–2049, 2060–2069, and 2090–2099) versus 1985–1999 over the ENA domain for the three RegCM3 projections.
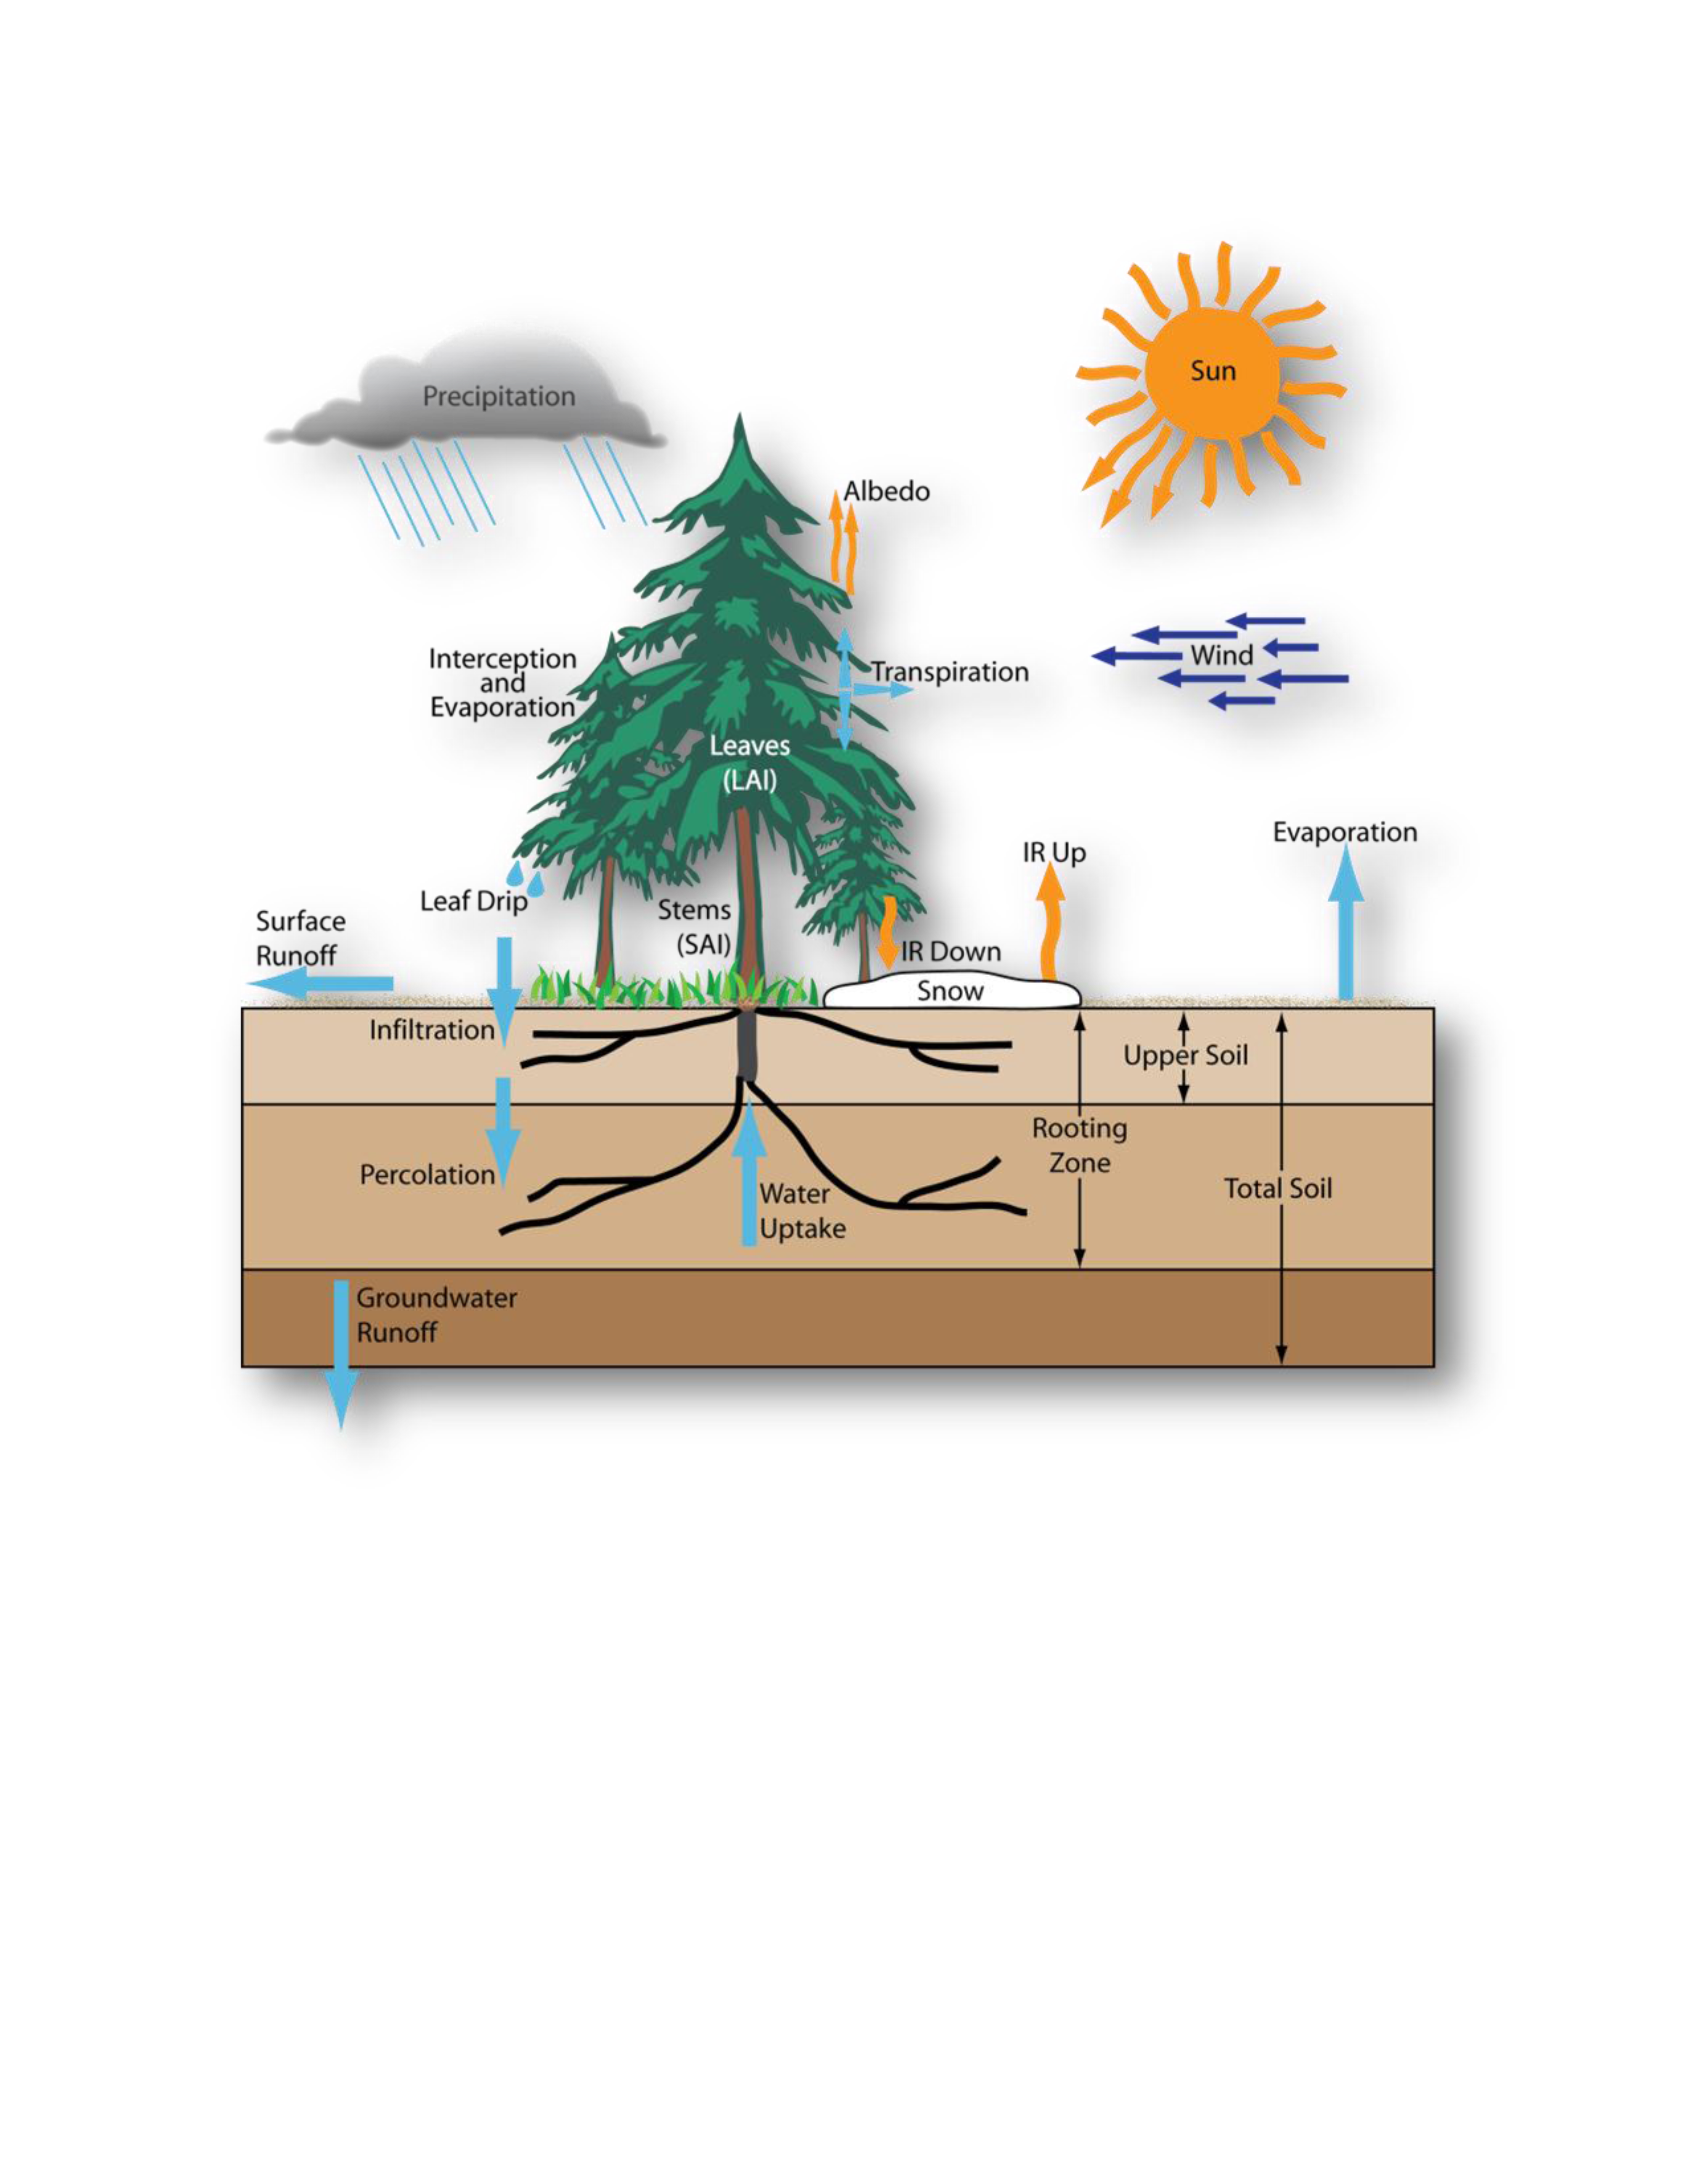
Figure 37. Diagram of the BATS surface physics model and processes represented, as implemented in RegCM3.