Overview
We are providing access to the northwest United States (US) and southwest Canada 30-second climate, bioclimate, and biome data produced by the USGS EFFECTS Project via our Thredds catalog and Regional Climate Downloader web application.
Project Description
Fine spatial resolution data of potential future climate and vegetation changes are important for understanding the potential impacts of climate change in regions of topographic complexity, such as the northwest US and southwest Canada. These data also are needed by natural resource managers for developing adaptive management responses to climate change. We downscaled climate data onto a 30-second grid of the northwest US and southwest Canada and used these data to calculate a set of bioclimatic variables. The climate data also were used as input to LPJ (Sitch et al. 2003), a dynamic global vegetation model, to simulate potential future vegetation changes for the study area.
Downscaled 1961-1990 historical climate data were developed using the University of East Anglia Climatic Research Unit’s (CRU’s) CRU CL 1.0, CRU CL 2.0, and CRU TS 2.1 data sets (New et al. 1999, 2002, Mitchell and Jones 2005; http://www.cru.uea.ac.uk/cru/data/hrg/). We used future climate simulations from the World Climate Research Programme’s (WCRP’s) Coupled Model Intercomparison Project phase 3 (CMIP3) multi-model dataset for five coupled atmosphere-ocean general circulation models: CCSM3 (Collins et al. 2006), CGCM3.1(T47) (Scinocca et al. 2008), GISS-ER (Schmidt et al. 2006), MIROC3.2(medres) (K-1 Model Developers 2004), and UKMO-HadCM3 (Gordon et al. 2000). Each model had climate simulations produced under the Intergovernmental Panel on Climate Change (IPCC) Special Report on Emissions Scenarios (SRES) A2 and A1B greenhouse gases emissions scenarios (Nakićenović et al. 2000). Additional information about the future climate simulations may be found on the CMIP3 (http://www-pcmdi.llnl.gov/ipcc/about_ipcc.php) and IPCC (https://www.ipcc.ch) web sites.
All of the data available here were developed for use in scientific research and as input for numerical models (e.g., vegetation models). They are based on estimates of historical climate and climate model simulations of future climate and thus they are projections, not predictions, of potential future climate, bioclimate, and vegetation changes.
Figures and animations displaying some of these data are available here.

Figure 1. Elevation (m) on the 30-second study area grid (Farr et al. 2007).
Suggested citations:
Shafer SL, Bartlein PJ, Gray EM, Pelltier RT (2015) Projected Future Vegetation Changes for the Northwest United States and Southwest Canada at a Fine Spatial Resolution Using a Dynamic Global Vegetation Model. PLoS ONE 10(10): e0138759. https://doi.org/10.1371/journal.pone.0138759 link
Shafer S.L., Bartlein P.J., 2015, Statistically-downscaled monthly historical (1901-2000) CRU TS 2.1 and projected future (2001-2099) CMIP3 A2 and A1B simulated temperature, precipitation, and sunshine data on a 30-second grid of the northwest United States and southwest Canada, version 1.0: U.S. Geological Survey Data Release. http://dx.doi.org/10.5066/F7H70CWW
Shafer S.L., Bartlein P.J., 2015, Bioclimatic variables calculated from statistically-downscaled historical (1901-2000) CRU TS 2.1 climate data and projected future (2001-2099) CMIP3 A2 and A1B simulated climate data on a 30-second grid of the northwest United States and southwest Canada, version 1.0: U.S. Geological Survey Data Release. http://dx.doi.org/10.5066/F7CF9N51
Shafer S.L., Bartlein P.J., 2015, LPJ biomes (30-year mean) simulated using monthly historical (1901-2000) CRU TS 2.1 climate data and projected future (2001-2099) CMIP3 A2 and A1B simulated climate data on a 30-second grid of the northwest United States and southwest Canada, version 1.0: U.S. Geological Survey Data Release. http://dx.doi.org/10.5066/F73X84PH
Publications using the downscaled potential future climate, bioclimate, and biome data should include the following acknowledgement:
“We acknowledge the modeling groups, the Program for Climate Model Diagnosis and Intercomparison (PCMDI) and the WCRP’s Working Group on Coupled Modelling (WGCM) for their roles in making available the WCRP CMIP3 multi-model dataset. Support of this dataset is provided by the Office of Science, U.S. Department of Energy.”
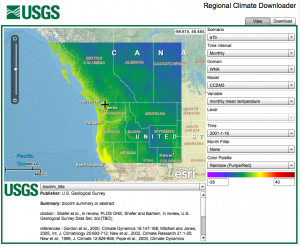
View and download data using the Regional Climate Downloader
Disclaimers
These data were developed for scientific research applications. Although they have been processed successfully on a computer system at the U.S. Geological Survey (USGS), no warranty expressed or implied is made regarding the display or utility of the data on any other system or for general or scientific purposes, nor shall the act of distribution constitute any such warranty. The USGS or the U.S. Government shall not be held liable for improper or incorrect use of the data described and/or contained herein. In addition, any use of trade, firm, or product names is for descriptive purposes only and does not imply endorsement by the U.S. Government.
Acknowledgements
This research was supported by the U.S. Geological Survey’s National Climate Change and Wildlife Science Center and Climate Research and Development Program. We acknowledge the modeling groups, the Program for Climate Model Diagnosis and Intercomparison (PCMDI) and the World Climate Research Programme’s (WCRP’s) Working Group on Coupled Modelling (WGCM) for their roles in making available the WCRP CMIP3 multi-model dataset. Support of the WCRP CMIP3 dataset is provided by the Office of Science, U.S. Department of Energy.
References
Collins WD, Bitz CM, Blackmon ML, Bonan GB, Bretherton CS, et al. 2006. The Community Climate System Model Version 3 (CCSM3). J Clim 19: 2122-2143.
Farr TG, Rosen PA, Caro E, Crippen R, Duren R, Hensley S, et al. 2007. The shuttle radar topography mission. Rev Geophys 45: RG2004. doi: 10.1029/2005RG000183
Gordon C, Cooper C, Senior CA, Banks H, Gregory JM, Johns TC, et al. 2000. The simulation of SST, sea ice extents and ocean heat transports in a version of the Hadley Centre coupled model without flux adjustments. Clim Dynamics 16: 147-168.
K-1 Model Developers. 2004. K-1 coupled GCM (MIROC) description. Hasumi H, Emori S, editors. Tokyo, Japan: Center for Climate System Research, University of Tokyo.
Mitchell TD, Jones PD. 2005. An improved method of constructing a database of monthly climate observations and associated high-resolution grids. Intl J Climatol 25: 693-712.
Nakićenović N, Alcamo J, Davis G, de Vries B, Fenhann J, et al. 2000. Special report on emissions scenarios. Cambridge, UK: Cambridge University Press.
New M, Hulme M, Jones P. 1999. Representing twentieth-century space-time climate variability. Part I: Development of a 1961–90 mean monthly terrestrial climatology. J Clim 12: 829-856.
New M, Lister D, Hulme M, Makin I. 2002. A high-resolution data set of surface climate over global land areas. Clim Res 21: 1-25.
Schmidt GA, Ruedy R, Hansen JE, Aleinov I, Bell N, et al. 2006. Present day atmospheric simulations using GISS ModelE: Comparison to in-situ, satellite and reanalysis data. J Clim 19: 153-192.
Scinocca JF, McFarlane NA, Lazare M, Li J, Plummer D. 2008. Technical note: the CCCma third generation AGCM and its extension into the middle atmosphere. Atmos Chem Phys 8: 7055-7074.
Sitch S, Smith B, Prentice IC, Arneth A, Bondeau A, Cramer W, et al. 2003. Evaluation of ecosystem dynamics, plant geography and terrestrial carbon cycling in the LPJ dynamic global vegetation model. Glob Change Biol 9: 161-185.