The Regional Climate Downloader (RCD) is a web application that can be used to visualize and download climate data. The RCD uses the Web Mapping Service (WMS) that is built into the Thredds Data Server, (see Disclaimer and Terms of Use) that allows users to map and download monthly average data for over 60 surface variables generated by the Dynamical Downscaling project. The time coverage of these simulations ranges from 1968 to 2100, depending on the region of simulation and the driving GCM. Decadal, monthly and daily data are available for the Dynamical Downscaling project. Other datasets such as CIG are also available from within RCD.
Using the RCD application:
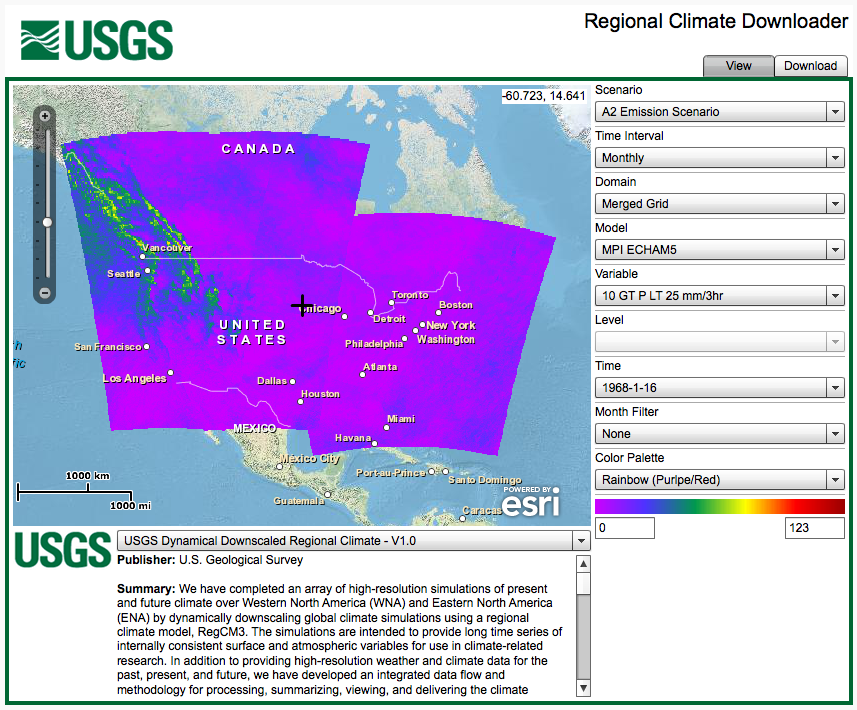
When first opened, the RCD displays a map of the data coverage of the five model domains in their Lambert Conformal projects. The center of the map can be changed by clicking and dragging the map. Zooming is controlled either by the zoom tool in the upper left-hand part of the map or by the mouse scroll wheel.
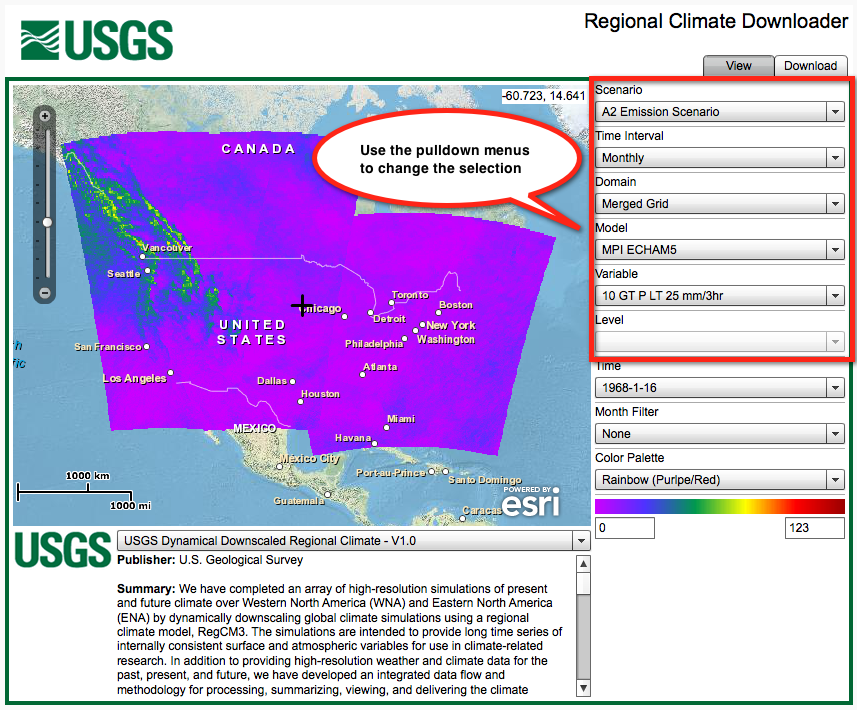
Refer to the above figure. The control panel on the right-hand-side has pull-down menus that are used to select what is displayed on the map and in the time series plot below. The current data set is limited to the IPCC AR4 A2 Emission Scenario. The Domain pull-down menu controls which of the five individual model domains or the Merged Grid is displayed. The Model pull-down menu allows you to choose from the four downscaled GCMs (NOAA/NCAR Reanalysis, MPI EHCAM5, GFDL CM2.0 and GENMOM). The Variable pull-down menu allows you to select any of the surface variables (click here for more information about each variable). The Time pull-down menu is used to set the time period of interest and the Month Filter is used to only show data from a given month.
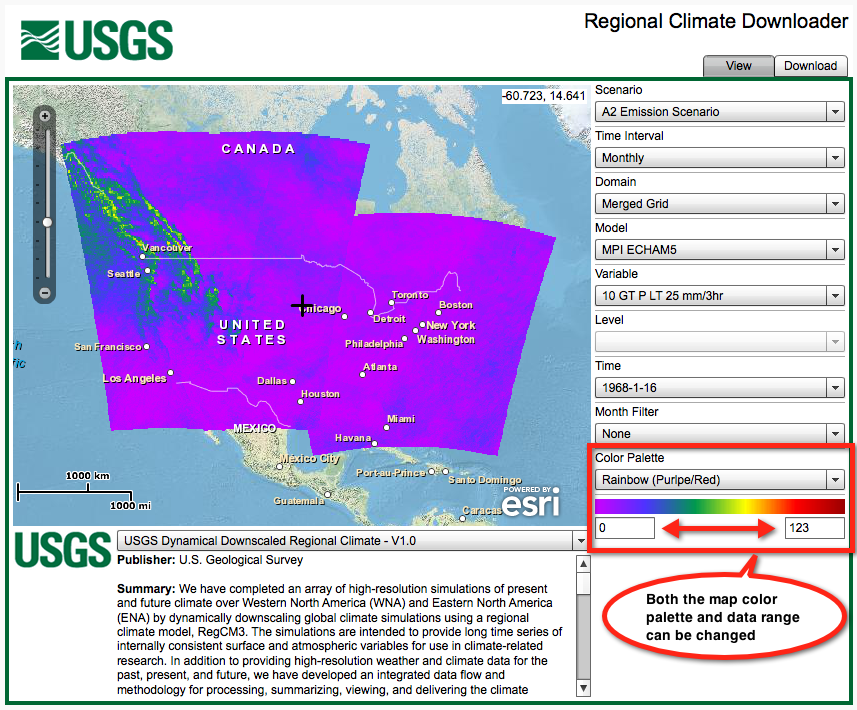
The Color Palette pull-down menu gives you the ability to change the color scheme for the map. Sometimes different colors schemes will help visualize and interpret the data more clearly. Below the color bar, there are two text boxes where you can manually specify the minimum (left) and maximum (right) values for the mapped data. Areas on the map that appear black are values that fall outside the minimum/maximum range.
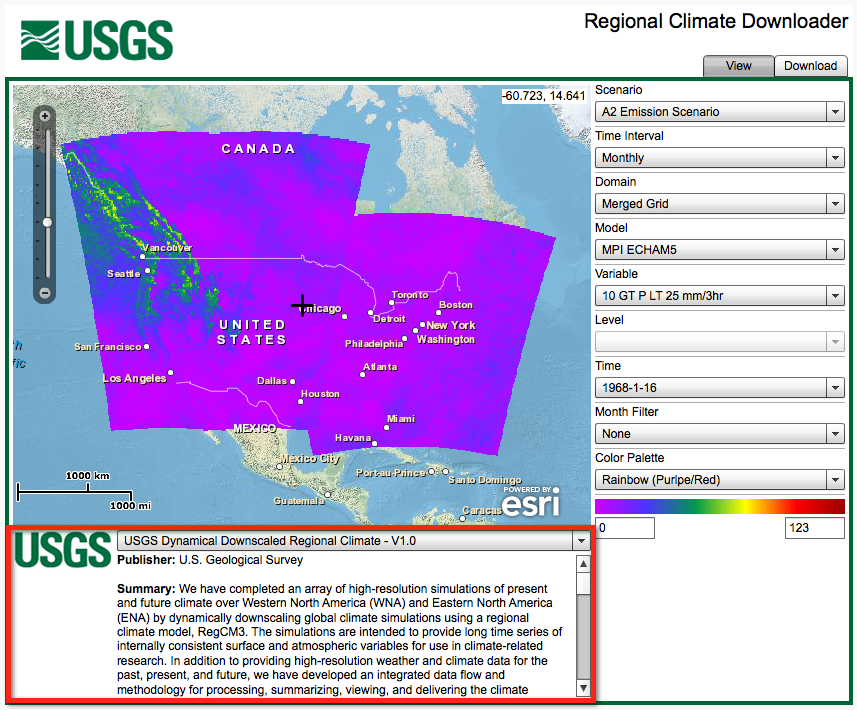
The metadata section of the application gives you a brief description of the dataset, the publishing authority, citation text and terms of use. From this panel you can change the selected dataset to one of the datasets currently available from our Thredds catalog.
Downloading data using the RCD application:
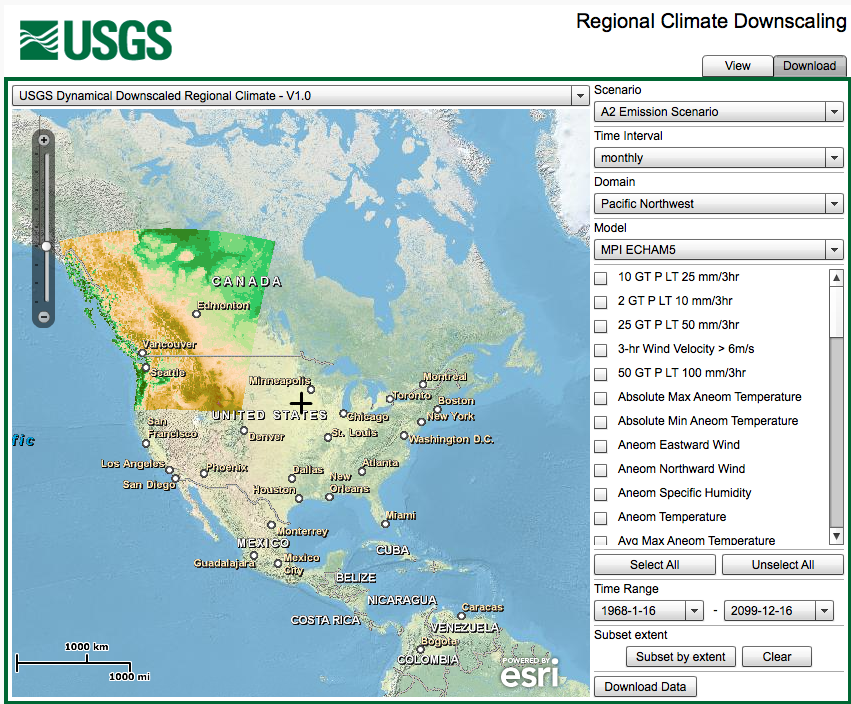 The RCD application has a Download tab in the top right corner of the application. Clicking on the tab changes the window to allow the user to customize a download from the Thredds catalog. The domain topography is mapped in the download view to give a visual impression of the grid resolution and to assist in selecting areas to download. You can choose which variables you would like to download and set the time range of interest. The default set up downloads data for selected variable(s) for all grid points in the domain. You can also select a subarea of the domain by drawing a bounding rectangle on the map. Reducing the number of variables, or the temporal and spatial coverage greatly reduces the size of the file to be downloaded and the time it takes to download it. The maximum file size that can be dowloaded through Thredds Data Service is 2 Gigabytes.
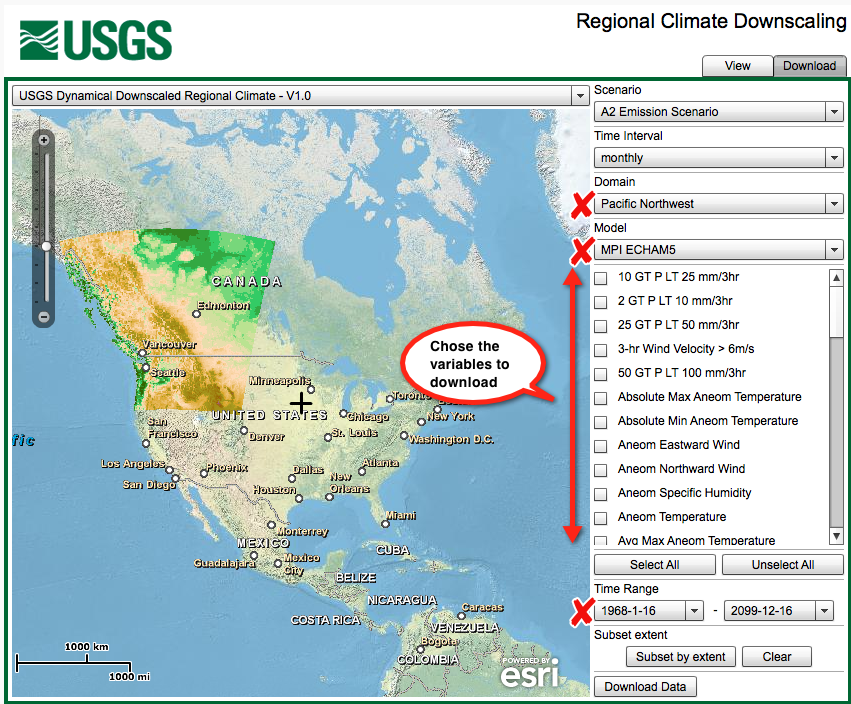 The Scenario, Time Interval, Domain and Model pull-down menus were discussed above. The Merged Grid is intended for viewing and getting a close approximation of the data, but to assure accuracy, only the data from the individual domains can be downloaded (see the FAQ). The model topography for the selected domain is shown in the map to give you a sense of the grid resolution. The control panel contains a list of the variables currently available in the Thredds catalog, and it allows you to select which variables you would like to download. The two Time Range pull-down menus allow you to specify the date range you are interested in.
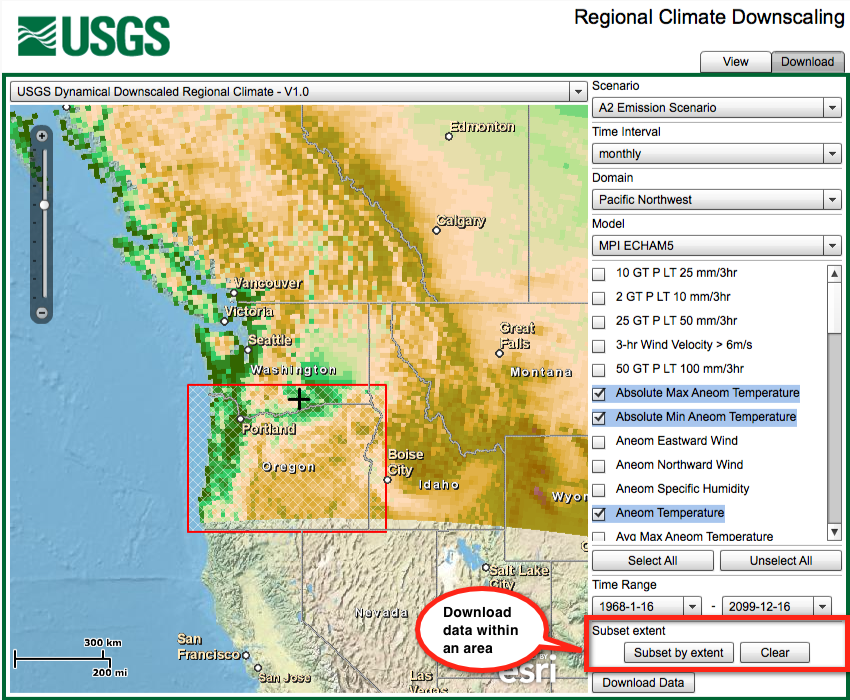 After you have selected the Domain, Model, Variables and Time Range you can subset the model domain by drawing a box around the area of interest. This greatly reduces the size of the file download. If you do not select a subset extent, then the whole model domain will be included. Keep in mind that downloading too much data at once will slow the time to create your download file and will take longer to download.
When you have made your selections, click on the Download Data button to begin downloading your customized file. The RCD application will open a file download link in a new browser window and the data will download in NetCDF file format. Note that some pop-up blockers may need to be turned off or modified to enable the donwload. There are many applications that can read the NetCDF files directly. Viewers such as Integrated Data Viewer (IDV), ncBrowse, ncView, and Panoply are easy-to-use programs for viewing model data in NetCDF format. The NetCDF files can also be imported directly by analysis software packages such as ArcMap GIS, IDL, MATLAB, NCL and R.
