Datasets:
Data Access:
What is the Merged Grid in the Regional Climate Downloader and the Thredds catalog?
Regional Climate Change Viewer:
Datasets:
Currently available datasets
Dynamically Downscaled
USGS Dynamically downscaled climate simulations over North America:
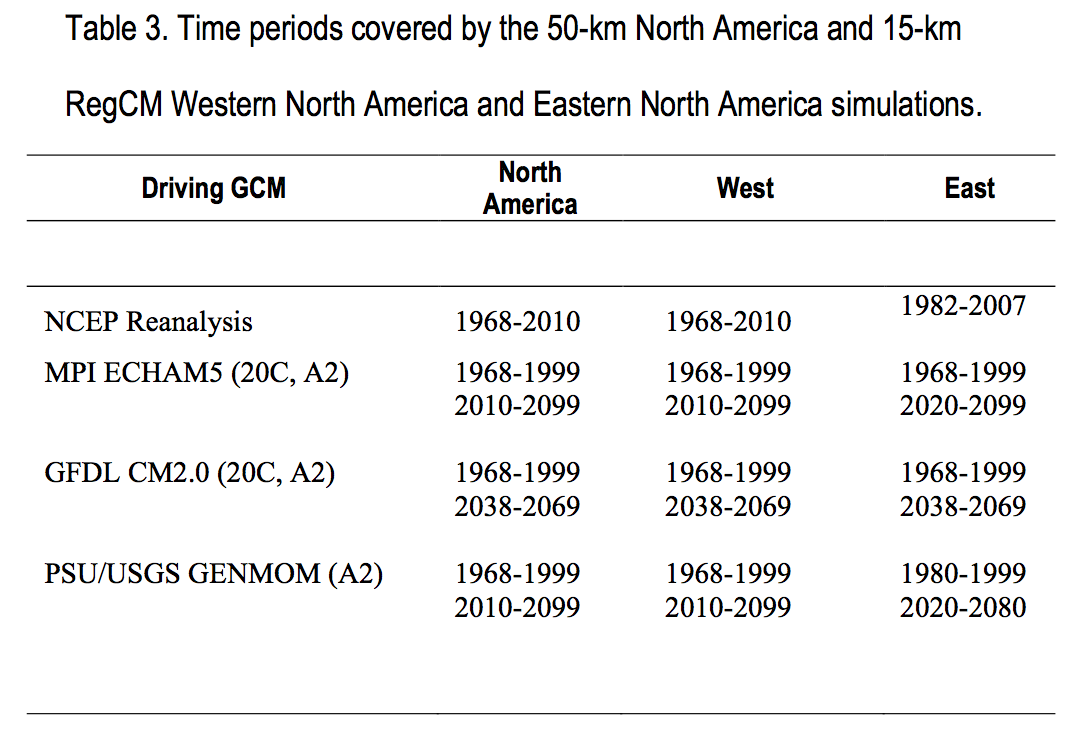
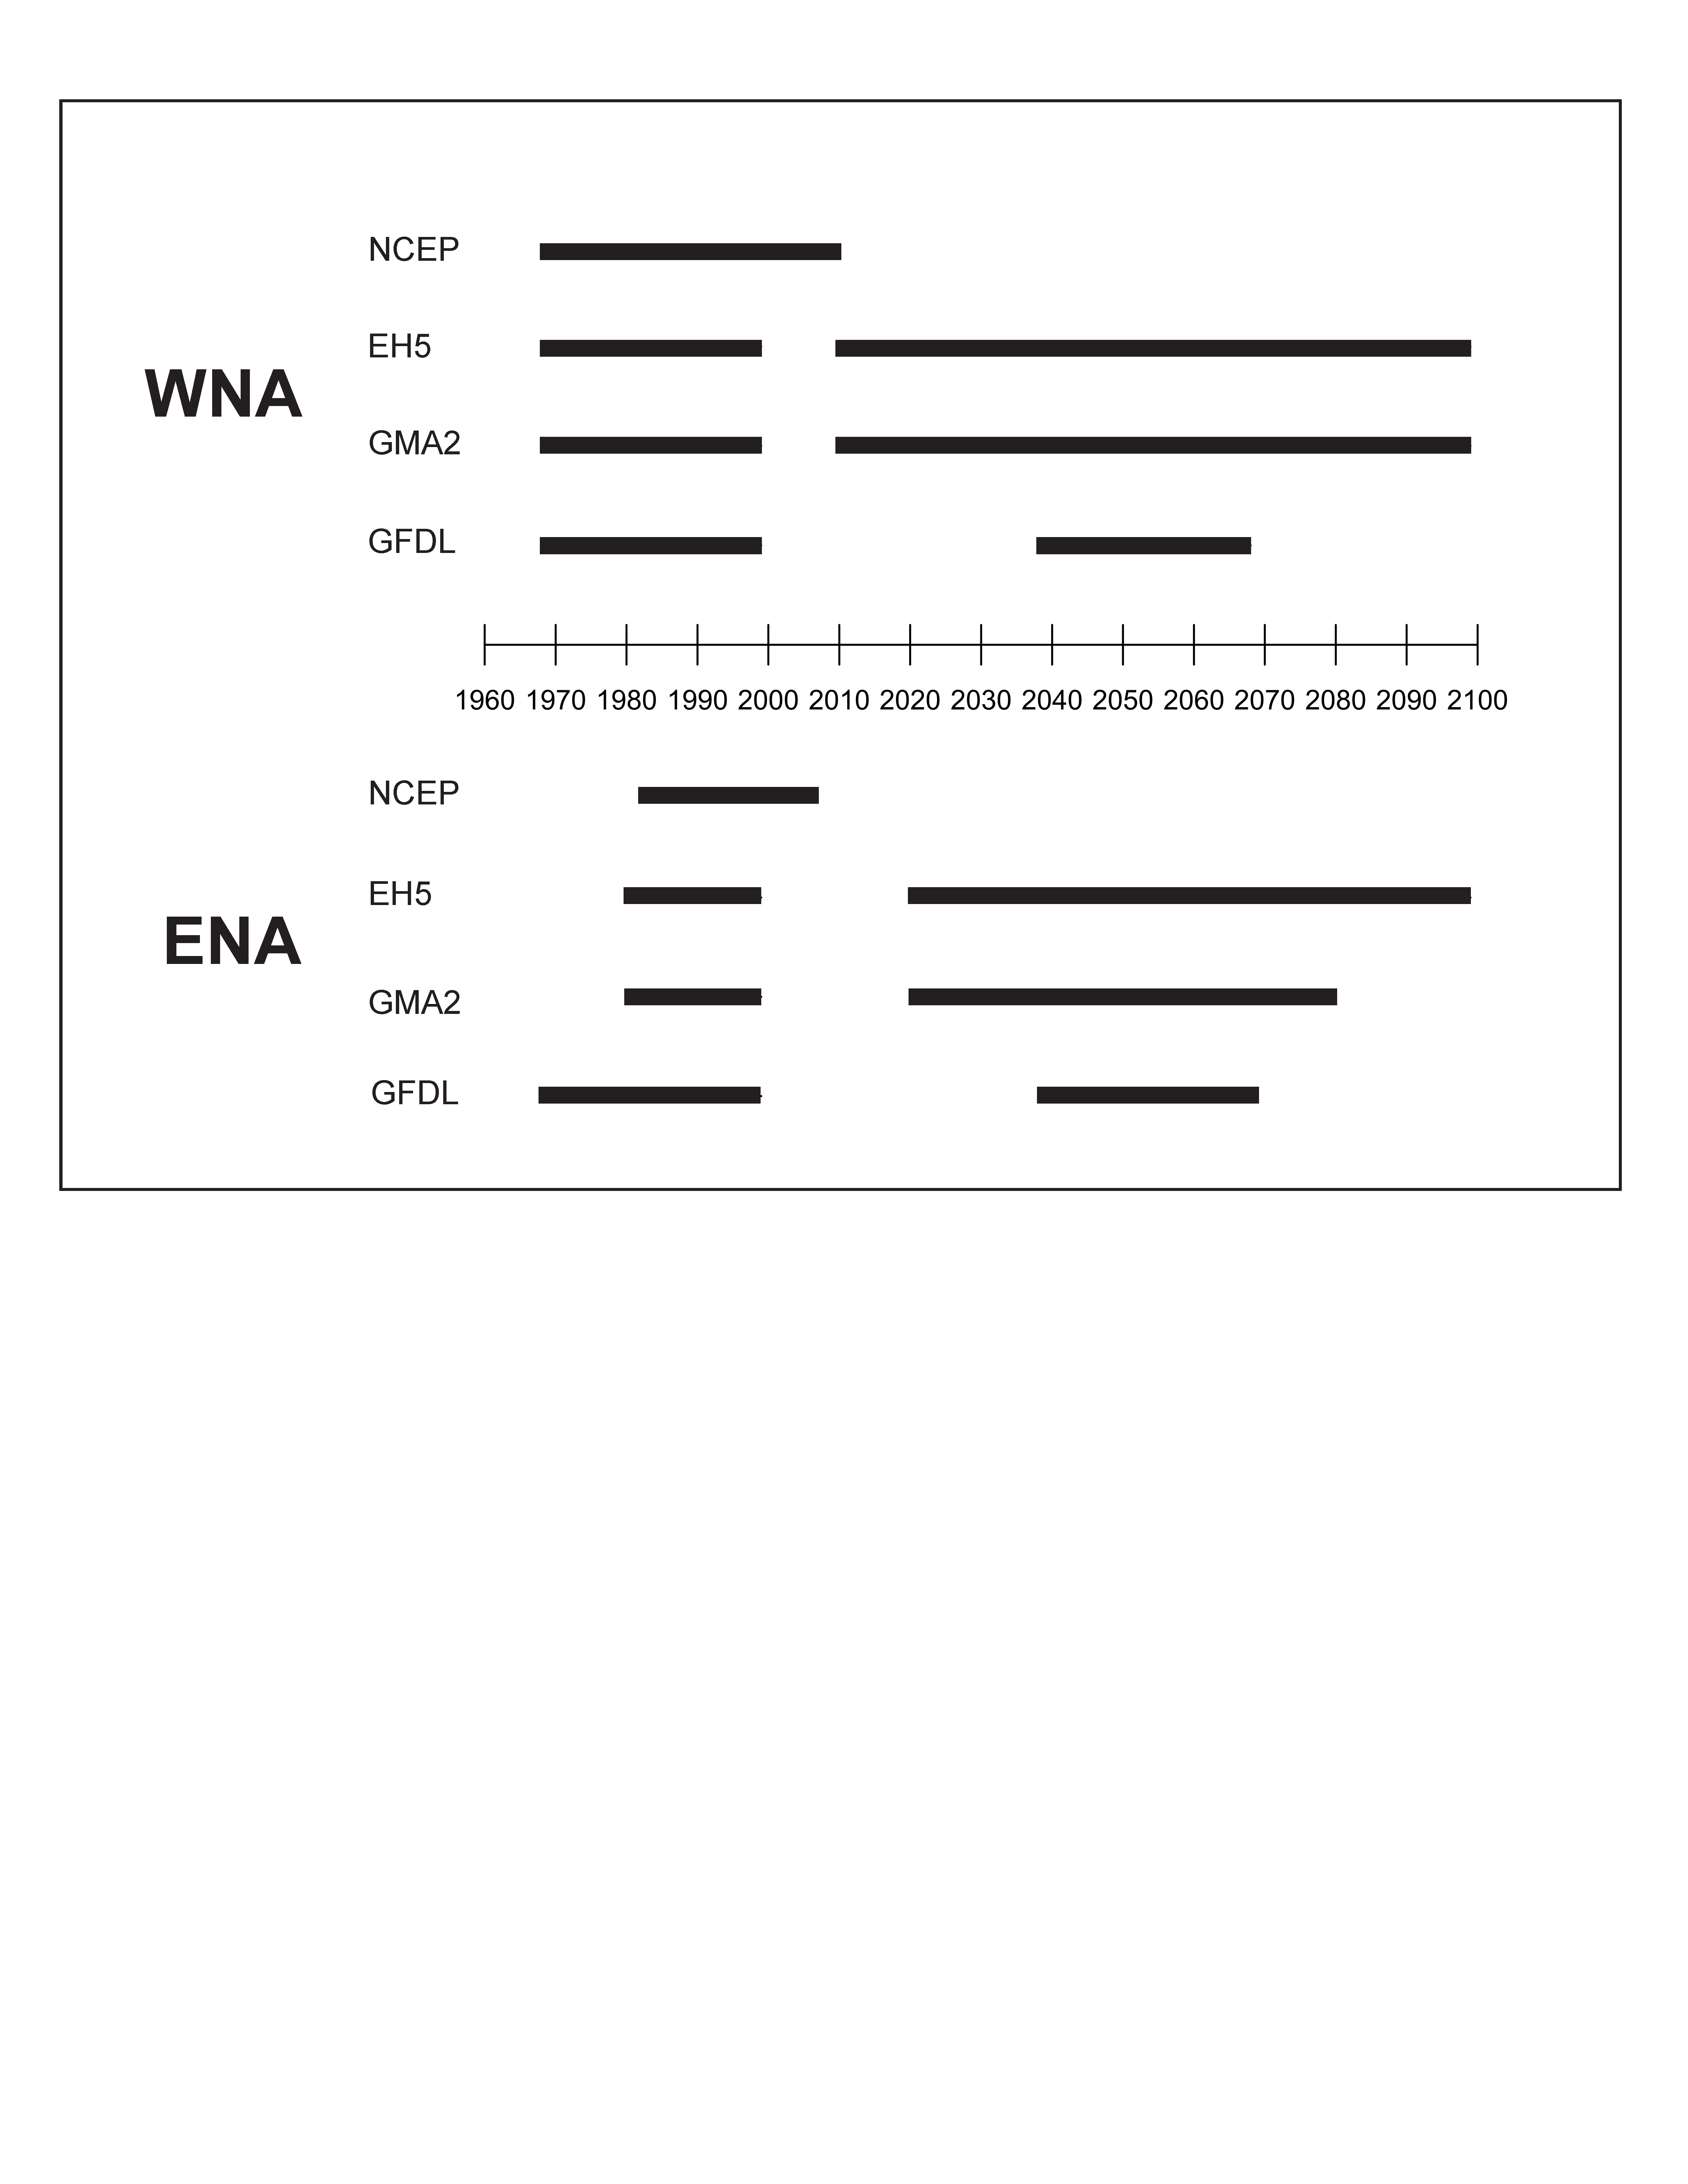
We are currently providing access to daily, monthly, decadal average surface files for all 15-km domains over their respective periods of simulation (table 3, fig. 3).
Statistically Downscaled
Northwest US and Southwest Canada:
We are providing access to the northwest United States (US) and southwest Canada 30-second climate, bioclimate, and biome data produced by the USGS EFFECTS Project via our Thredds catalog and Regional Climate Downloader web application.
Regional Climate and Hydrologic Change: Internally Consistent Future Climate Projections for Resource Management created by the Climate Impacts Group.
Data Access:
What is the Merged Grid in the Regional Climate Downloader and the Thredds Catalog?
The Merged Grid is an artificial grid created from the five continental U.S. model domains and should only be used for visualization and not research. The Merged Grid does not maintain the original Lambert Conformal Conic 15 km equal area grid used in the RegCM3 simulations, but rather regrids and reprojects the data to an arbitrary grid spacing using the ‘geographic’ projection. The Merged Grid is created by stacking the Pacific Northwest, Pacific Southwest, Northern Rocky Mountains, Southern Rocky Mountains, and Eastern North America grids (in that order). Since the domains are stacked into one master grid, there are seems and edge effects where the domains overlap. For research purposes, one or more of the original Lambert Conformal Conic 15km grids should be used.
Regional Climate Change Viewer:
Can I use the data downloaded from the Regional Climate Change Viewer in my research/planning project?
The data used in the Regional Climate Change Viewer (RCCV) should be considered an estimate and is intended for presentation only and should not be used in research, planning or policy documents. The reason for this is because the data used in RCCV is based on the Merged Grid, which does not maintain the original Lambert Conformal Conic 15 km equal area grid used in the RegCM3 simulations. The original five continental U.S. model domains are merged into one grid using a regridding procedure. The Dynamically Downscaled data can be used in research/planning/policy grade work, but an analyst should use one or more of the original model domains, not the merged grid, and be aware of the caveats used in regridding and interpolation procedures.
Known software issues:
10/17/2011
For some Mac users running OS X, the mouse cursor disappears while interacting with the maps in the RCD web application. This is related to the version of Adobe Flash Player included in OS X. The problem can be fixed by installing Flash Player 11, which can be downloaded here: http://get.adobe.com/flashplayer/
Some iPad users have experienced problems while viewing the figures in the Open File Report PDF. This is related to the installed reader on the iPad. A PDF reader that has successfully fixed the problem can be downloaded here: http://itunes.apple.com/us/app/pdf-reader-ipad-edition/id367816156?mt=8