The Regional Climate Change Viewer (RCCV) is intended to be an easy-to-use tool to visualize and download a selected subset of the Dynamically Downscaled climate data set. The application offers a limited set of common variables that have been averaged over predefined geographic areas that currently include states and counties and USGS Hydrologic Unit Codes. The application facilitates comparisons of climate variables for future time periods (i.e., years 2030-2039, 2050-2059, etc.) with present-day (1980-1999) climatologies. The data used in the RCCV application can also be downloaded for personal use.
The data set is comprised of four General Circulation Models (GCMs) that have been dynamically downscaled using RegCM3 regional climate model. The RCCV application allows you to view the output of three models both individually and as an ensemble average (mean of all three models). There are three limitations of the RCCV that should be kept in mind when viewing or downloading the data: 1) data are not available for all models over the entire 2020-2100 time period. For example, the GFDL CM2.0 data are limited to 2040-2049, 2050-2059, and 2060-2069. 2) The data used in the RCCV application is derived by combining five model domains into one master merged grid. This regridding process changes the projection and spacing of the grid cells (see FAQ). 3) The RCCV application averages the model data over a polygon (state/county), but only includes grid cells whose center is contained within the polygon. Because of these limitations we caution that the data should be considered as estimates and should not be used in research, planning, or policy documents (see the Disclaimer and Terms of Use).
Model evaluation plots are available for each geographical area of interest. These plots provide basic comparisons of simulated and observed temperature and precipitation climatologies and time series. Daily time series plots are also provided. Information and background for the evaluation plots is found here.
Using the RCCV application:
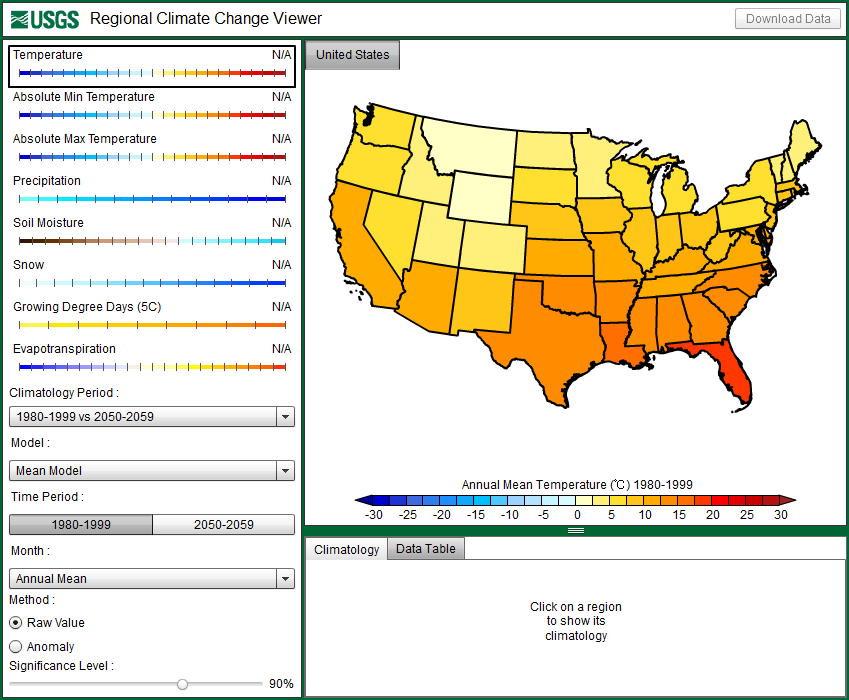
At the highest level, the application opens a map of the United States, as shown above. Click on the state of interest and the map will zoom into that state. For this tutorial, we will focus on the county of Riverside, California as illustrated below:
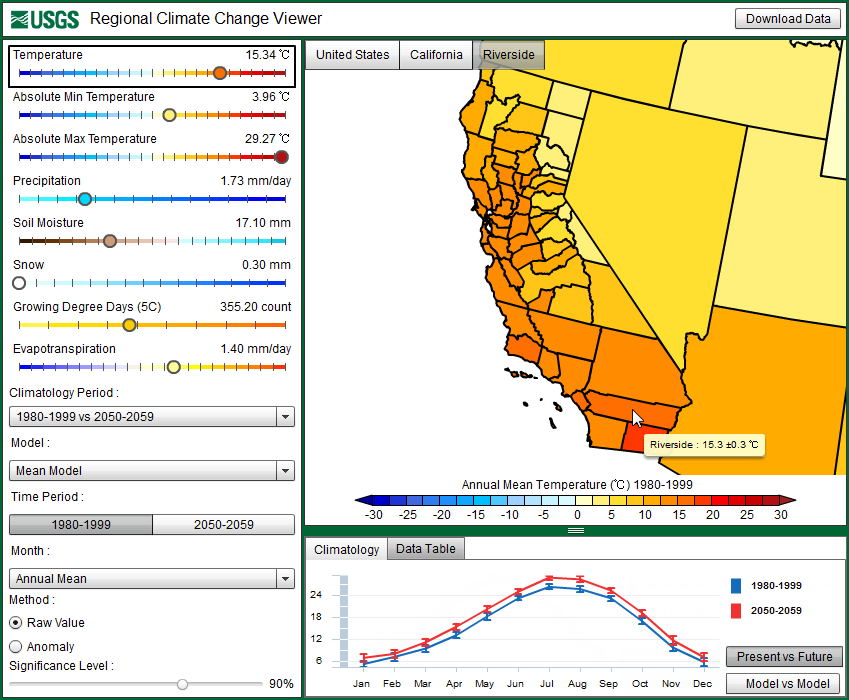
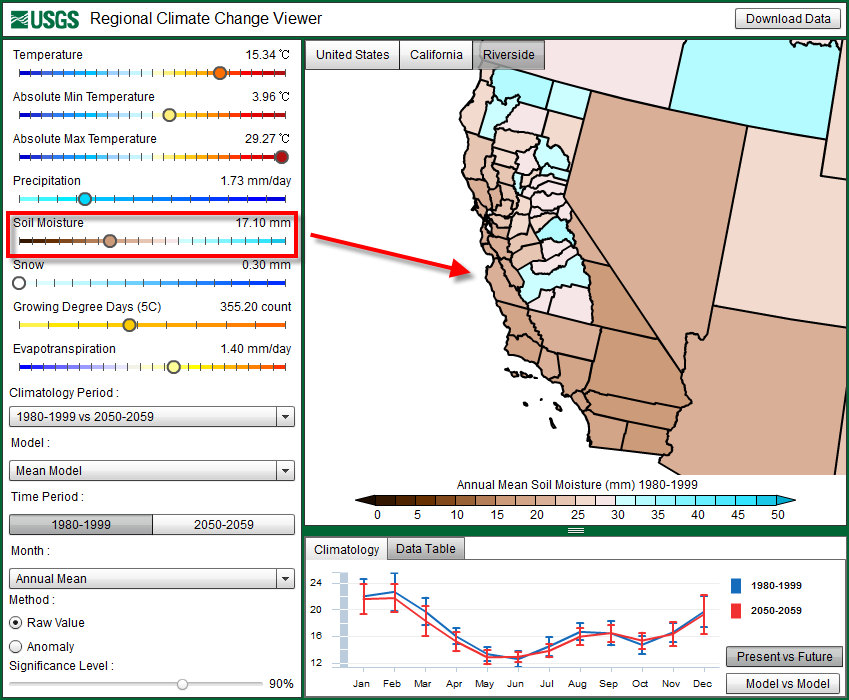
The application controls are divided into several sections. The top-left section displays the currently available climate variables, the units of each variable, and the variable values that are averages of the model grid points over the selected geographic area. The colored dots on the scales indicate the average value. Clicking on a variable will display the map and chart for that variable in the main map panel:
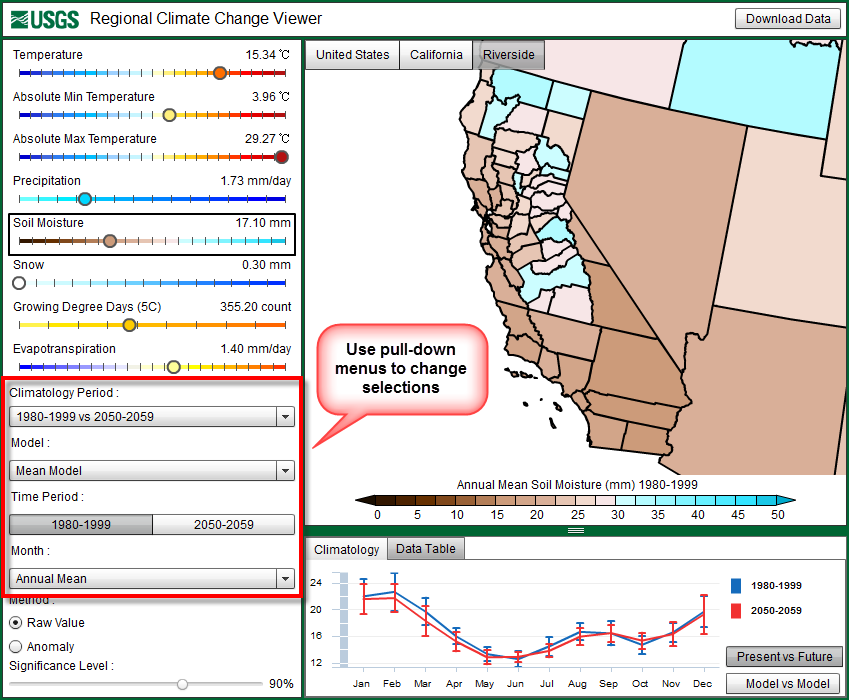
The application allows you to view data for each decade between 2020 and 2100, which can be used to look at simulated, long-term changes and trends. The Dynamically Downscaled climate data set is composed of four General Circulation Models (GCMs) that have been dynamically downscaled using RegCM3. The RCCV application allows you to view the output of three models and their ensemble average (mean of all three models); however, it is important to keep in mind that data are not available for all models over the entire 2020-2100 time period. For example, the data from GFDL CM2.0 is limited to 2040-2049, 2050-2059, and 2060-2069. In addition to changing the climatology period, the application also allows you to choose which month to view, as well as the annual average:
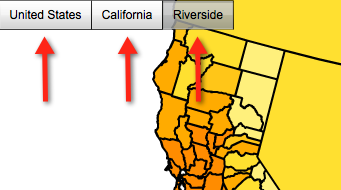
By clicking on a state on the map, the application both zooms to that state and displays the statewide average climate fields for each of the eight variables in the left-hand control panel, as well as the statewide monthly climatology in a chart below the map. By clicking on a county, the county average is likewise displayed. The button menu at the top of the map always displays the current state/county that is selected. By clicking the “United States” button, the application will zoom out back to the national level.
The chart at the bottom of the application shows the monthly climatology (with variability error bars) for both the present and future time periods. As climate changes, these lines become progressively more separated. The charts are interactive and can be used to control which month the map above displays:

In addition to viewing the Present vs Future climatology, the application can also be used to compare and contrast the different model simulations. Since each model contains uncertainties, many models, or an “ensemble”, are used to build confidence in understanding future climate change. Using an ensemble model approach results in multiple possible outcomes. It is important to understand where the models agree and also where they disagree. Clicking on the “Model vs Model” button near the climatology graph will display the model differences:

Assessing changes in climate:
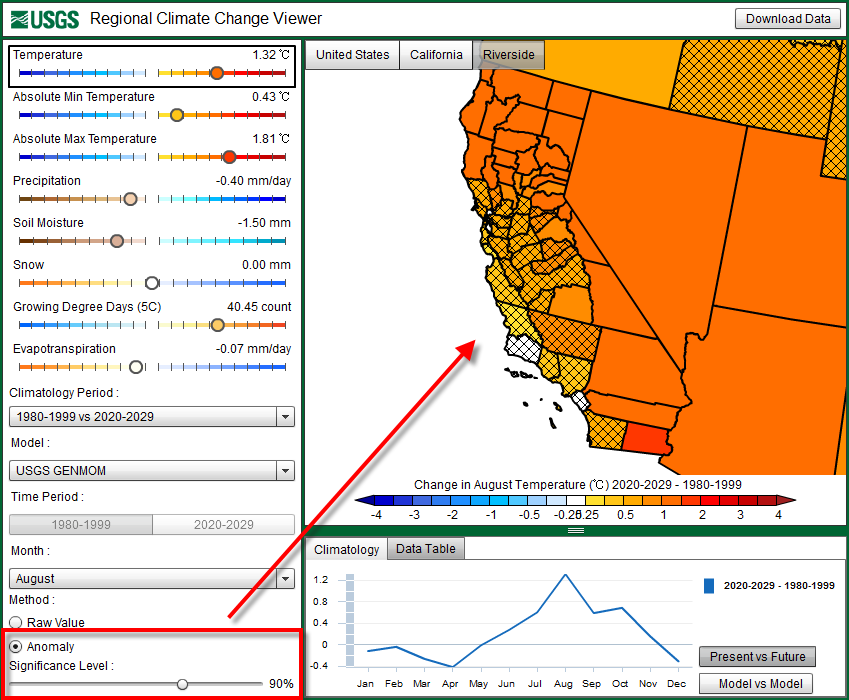
In addition to viewing data from both present and future simulations, the application can also calculate the change (or “anomaly”) between the two time periods and display whether or not that changes are “statistically significant” at certain levels. By switching the method into “Anomaly Mode”, the application calculates the future-minus-present difference. The map and chart then display those differences accordingly. In our sample case of Riverside, CA the strongest warming occurs in the summer months, peaking in August. Areas that are hatched with black lines are regions where the future-present changes are not statistically significant (i.e., the changes are smaller than the year to year variability). In the bottom left-hand corner of the application is a Significance Level slider, which allows you to change the significance threshold from 70% to 99%. This is a measure of statistical significance of the simulated differences in climate between the two time periods.
Downloading Data:
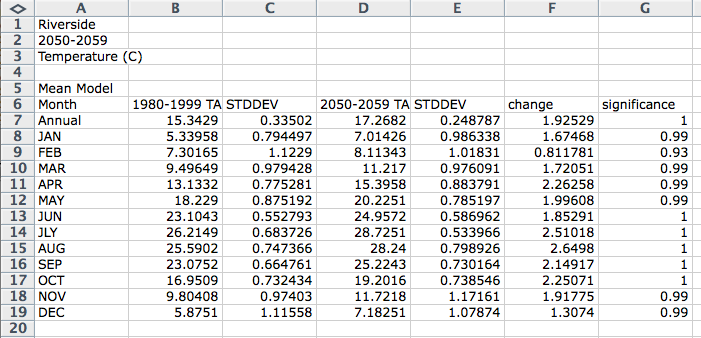
When a state or county is selected on the map, the Download Data button in the top-right of the application becomes active. The Download Data button allows you to download a .CSV file for the current variable for the selected state or county. The .CSV file is viewable with several speadsheet applications, such as Microsoft Excel or OpenOffice Calc. The file will contain data for all the models available for the given time period:
These data should be considered to be approximate and should not be used in research, planning, or policy documents (see the FAQ).

