Fire Program Analysis Fire-Occurrence Database (FPA-FOD)
1 Fire Program Analysis Fire-Occurrence Database
Spatial wildfire occurrence data for the United States, 1992-2013/Fire Program Analysis Fire-Occurrence Database [FPA_FOD_20150323] (3nd Edition) (Short, K.C., 2014, Earth Syst. Sci. Data, 6, 1-27) – http://www.fs.usda.gov/rds/archive/Product/RDS-2013-0009.3/.
1.1 Overview
This is the K.C. Short (2014) data set, 2015 version (updated through 2013), read in directly from the source Microsoft Access data base, so there was no external manipulation of the data. Note that the connection to the particular Access database (FPA_FOD_20150323.accdb) is established externally to R using (on Windows) the Data Sources tool (i.e. Control Panel > Administrative Tools > Data Sources (ODBC)).
1.2 Read data
Read the data from the Access database:
library(RODBC)
# add DSN: Control Panel > Administrtative Tools > Data Sources (ODBC)
dbname <- "FPA_FOD_20150323.accdb"
fpafod.db <- odbcConnect(dbname)
odbcGetInfo(fpafod.db)
## DBMS_Name DBMS_Ver Driver_ODBC_Ver
## "ACCESS" "12.00.0000" "03.51"
## Data_Source_Name Driver_Name Driver_Ver
## "FPA_FOD_20150323.accdb" "ACEODBC.DLL" "Microsoft Access database engine"
## ODBC_Ver Server_Name
## "03.80.0000" "ACCESS"sqlTables(fpafod.db, tableType="TABLE")## TABLE_CAT TABLE_SCHEM
## 1 E:\\Projects\\fire\\DailyFireStarts\\data\\RDS-2013-0009.3\\source\\FPA_FOD_20150323.accdb <NA>
## 2 E:\\Projects\\fire\\DailyFireStarts\\data\\RDS-2013-0009.3\\source\\FPA_FOD_20150323.accdb <NA>
## TABLE_NAME TABLE_TYPE REMARKS
## 1 Fires TABLE <NA>
## 2 NWCG_UnitIdActive_20120305 TABLE <NA>sqlColumns(fpafod.db, "Fires")$COLUMN_NAME## [1] "FOD_ID" "FPA_ID" "SOURCE_SYSTEM_TYPE"
## [4] "SOURCE_SYSTEM" "NWCG_REPORTING_AGENCY" "NWCG_REPORTING_UNIT_ID"
## [7] "NWCG_REPORTING_UNIT_NAME" "SOURCE_REPORTING_UNIT" "SOURCE_REPORTING_UNIT_NAME"
## [10] "LOCAL_FIRE_REPORT_ID" "LOCAL_INCIDENT_ID" "FIRE_CODE"
## [13] "FIRE_NAME" "ICS_209_INCIDENT_NUMBER" "ICS_209_NAME"
## [16] "MTBS_ID" "MTBS_FIRE_NAME" "COMPLEX_NAME"
## [19] "FIRE_YEAR" "DISCOVERY_DATE" "DISCOVERY_DOY"
## [22] "DISCOVERY_TIME" "STAT_CAUSE_CODE" "STAT_CAUSE_DESCR"
## [25] "CONT_DATE" "CONT_DOY" "CONT_TIME"
## [28] "FIRE_SIZE" "FIRE_SIZE_CLASS" "LATITUDE"
## [31] "LONGITUDE" "OWNER_CODE" "OWNER_DESCR"
## [34] "STATE" "COUNTY" "FIPS_CODE"
## [37] "FIPS_NAME"Define query
query1 <- paste("SELECT FOD_ID,NWCG_REPORTING_AGENCY,FIRE_YEAR,DISCOVERY_DATE,DISCOVERY_DOY,",
  "STAT_CAUSE_CODE,CONT_DATE,CONT_DOY,FIRE_SIZE,LATITUDE,LONGITUDE,STATE FROM Fires", sep="")
Get the data (this can take a little while).
fpafod <- sqlQuery(fpafod.db, query1)odbcClose(fpafod.db)Summarize
head(fpafod)## FOD_ID NWCG_REPORTING_AGENCY FIRE_YEAR DISCOVERY_DATE DISCOVERY_DOY STAT_CAUSE_CODE CONT_DATE
## 1 1 FS 2005 2005-02-02 33 9 2005-02-02
## 2 2 FS 2004 2004-05-12 133 1 2004-05-12
## 3 3 FS 2004 2004-05-31 152 5 2004-05-31
## 4 4 FS 2004 2004-06-28 180 1 2004-07-03
## 5 5 FS 2004 2004-06-28 180 1 2004-07-03
## 6 6 FS 2004 2004-06-30 182 1 2004-07-01
## CONT_DOY FIRE_SIZE LATITUDE LONGITUDE STATE startday startmon AREA_HA
## 1 33 0.10 40.03694 -121.0058 CA 2 2 0.0404686
## 2 133 0.25 38.93306 -120.4044 CA 12 5 0.1011715
## 3 152 0.10 38.98417 -120.7356 CA 31 5 0.0404686
## 4 185 0.10 38.55917 -119.9133 CA 28 6 0.0404686
## 5 185 0.10 38.55917 -119.9331 CA 28 6 0.0404686
## 6 183 0.10 38.63528 -120.1036 CA 30 6 0.0404686summary(fpafod)## FOD_ID NWCG_REPORTING_AGENCY FIRE_YEAR DISCOVERY_DATE DISCOVERY_DOY
## Min. : 1 ST/C&L :1254551 Min. :1992 Min. :1992-01-01 Min. : 1.0
## 1st Qu.: 465673 FS : 206731 1st Qu.:1998 1st Qu.:1998-04-25 1st Qu.: 89.0
## Median : 985582 BIA : 108423 Median :2003 Median :2003-06-30 Median :164.0
## Mean : 32179232 BLM : 90801 Mean :2003 Mean :2003-03-31 Mean :164.9
## 3rd Qu.: 1761114 IA : 21841 3rd Qu.:2008 3rd Qu.:2008-05-05 3rd Qu.:230.0
## Max. :201940182 NPS : 19571 Max. :2013 Max. :2013-12-31 Max. :366.0
## (Other): 25558
## STAT_CAUSE_CODE CONT_DATE CONT_DOY FIRE_SIZE LATITUDE
## Min. : 1.000 Min. :1992-01-01 00:00:00 Min. : 1.0 Min. : 0.0 Min. :17.94
## 1st Qu.: 3.000 1st Qu.:1996-09-03 00:00:00 1st Qu.:104.0 1st Qu.: 0.1 1st Qu.:32.83
## Median : 5.000 Median :2003-05-07 00:00:00 Median :183.0 Median : 1.0 Median :35.40
## Mean : 5.921 Mean :2003-04-05 08:42:42 Mean :173.9 Mean : 73.0 Mean :36.79
## 3rd Qu.: 9.000 3rd Qu.:2009-06-26 00:00:00 3rd Qu.:232.0 3rd Qu.: 3.6 3rd Qu.:40.77
## Max. :13.000 Max. :2013-12-31 00:00:00 Max. :366.0 Max. :606945.0 Max. :70.14
## NA's :854941 NA's :854941
## LONGITUDE STATE startday startmon AREA_HA
## Min. :-178.80 CA :173634 Min. : 1.0 Min. : 1.000 Min. : 0.00
## 1st Qu.:-109.83 GA :162479 1st Qu.: 8.0 1st Qu.: 3.000 1st Qu.: 0.04
## Median : -91.18 TX :125227 Median :15.0 Median : 6.000 Median : 0.40
## Mean : -95.29 NC :104263 Mean :15.5 Mean : 5.935 Mean : 29.55
## 3rd Qu.: -82.25 FL : 85576 3rd Qu.:23.0 3rd Qu.: 8.000 3rd Qu.: 1.45
## Max. : -65.26 SC : 78127 Max. :31.0 Max. :12.000 Max. :245622.14
## (Other):998170length(fpafod[,1])## [1] 1727476str(fpafod, strict.width="cut")## 'data.frame': 1727476 obs. of 15 variables:
## $ FOD_ID : int 1 2 3 4 5 6 7 8 9 10 ...
## $ NWCG_REPORTING_AGENCY: Factor w/ 11 levels "BIA","BLM","BOR",..: 6 6 6 6 6 6 6 6 6 6 ...
## $ FIRE_YEAR : int 2005 2004 2004 2004 2004 2004 2004 2005 2005 2004 ...
## $ DISCOVERY_DATE : Date, format: "2005-02-02" "2004-05-12" "2004-05-31" ...
## $ DISCOVERY_DOY : int 33 133 152 180 180 182 183 67 74 183 ...
## $ STAT_CAUSE_CODE : num 9 1 5 1 1 1 1 5 5 1 ...
## $ CONT_DATE : POSIXct, format: "2005-02-02" "2004-05-12" "2004-05-31" ...
## $ CONT_DOY : int 33 133 152 185 185 183 184 67 74 184 ...
## $ FIRE_SIZE : num 0.1 0.25 0.1 0.1 0.1 0.1 0.1 0.8 1 0.1 ...
## $ LATITUDE : num 40 38.9 39 38.6 38.6 ...
## $ LONGITUDE : num -121 -120 -121 -120 -120 ...
## $ STATE : Factor w/ 52 levels "AK","AL","AR",..: 5 5 5 5 5 5 5 5 5 5 ...
## $ startday : num 2 12 31 28 28 30 1 8 15 1 ...
## $ startmon : num 2 5 5 6 6 6 7 3 3 7 ...
## $ AREA_HA : num 0.0405 0.1012 0.0405 0.0405 0.0405 ...Get the startday number (startdaynum day number in the year), and month (startmon) and day (startday) of each record.
library(lubridate)
fpafod$DISCOVERY_DATE <- as.Date(fpafod$DISCOVERY_DATE)
fpafod$startday <- as.numeric(format(fpafod$DISCOVERY_DATE, format="%d"))
fpafod$startmon <- as.numeric(format(fpafod$DISCOVERY_DATE, format="%m"))
Convert acres to hectares
fpafod$AREA_HA <- fpafod$FIRE_SIZE * 0.4046861.3 All fires
1.3.1 Maps
Map the data:
library(maps)
plot(fpafod$LONGITUDE, fpafod$LATITUDE, ylim=c(17,80), xlim=c(-180,-55), type = "n")
map("world", add = TRUE, lwd = 2, col = "gray")
points(fpafod$LONGITUDE, fpafod$LATITUDE, pch = 16, cex=0.2, col="red")
1.3.2 Time series
Number of fires by different causes
# 1 Lightning; 2 Equipment Use; 3 Smoking; 4 Campfire; 5 Debris Burning; 6 Railroad; 7 Arson; 8 Children;
# 9 Miscellaneous; 10 Fireworks; 11 Power Line; 12 Structure; 13 Missing/Undefined;
table(fpafod$STAT_CAUSE_CODE)
##
## 1 2 3 4 5 6 7 8 9 10 11 12 13
## 260311 137575 49633 68684 390702 32569 267987 58354 291678 10350 11315 3178 145140Number of fires per year
hist(fpafod$FIRE_YEAR, xlim=c(1980,2015), ylim=c(0,150000),breaks=seq(1979.5,2015.5,by=1))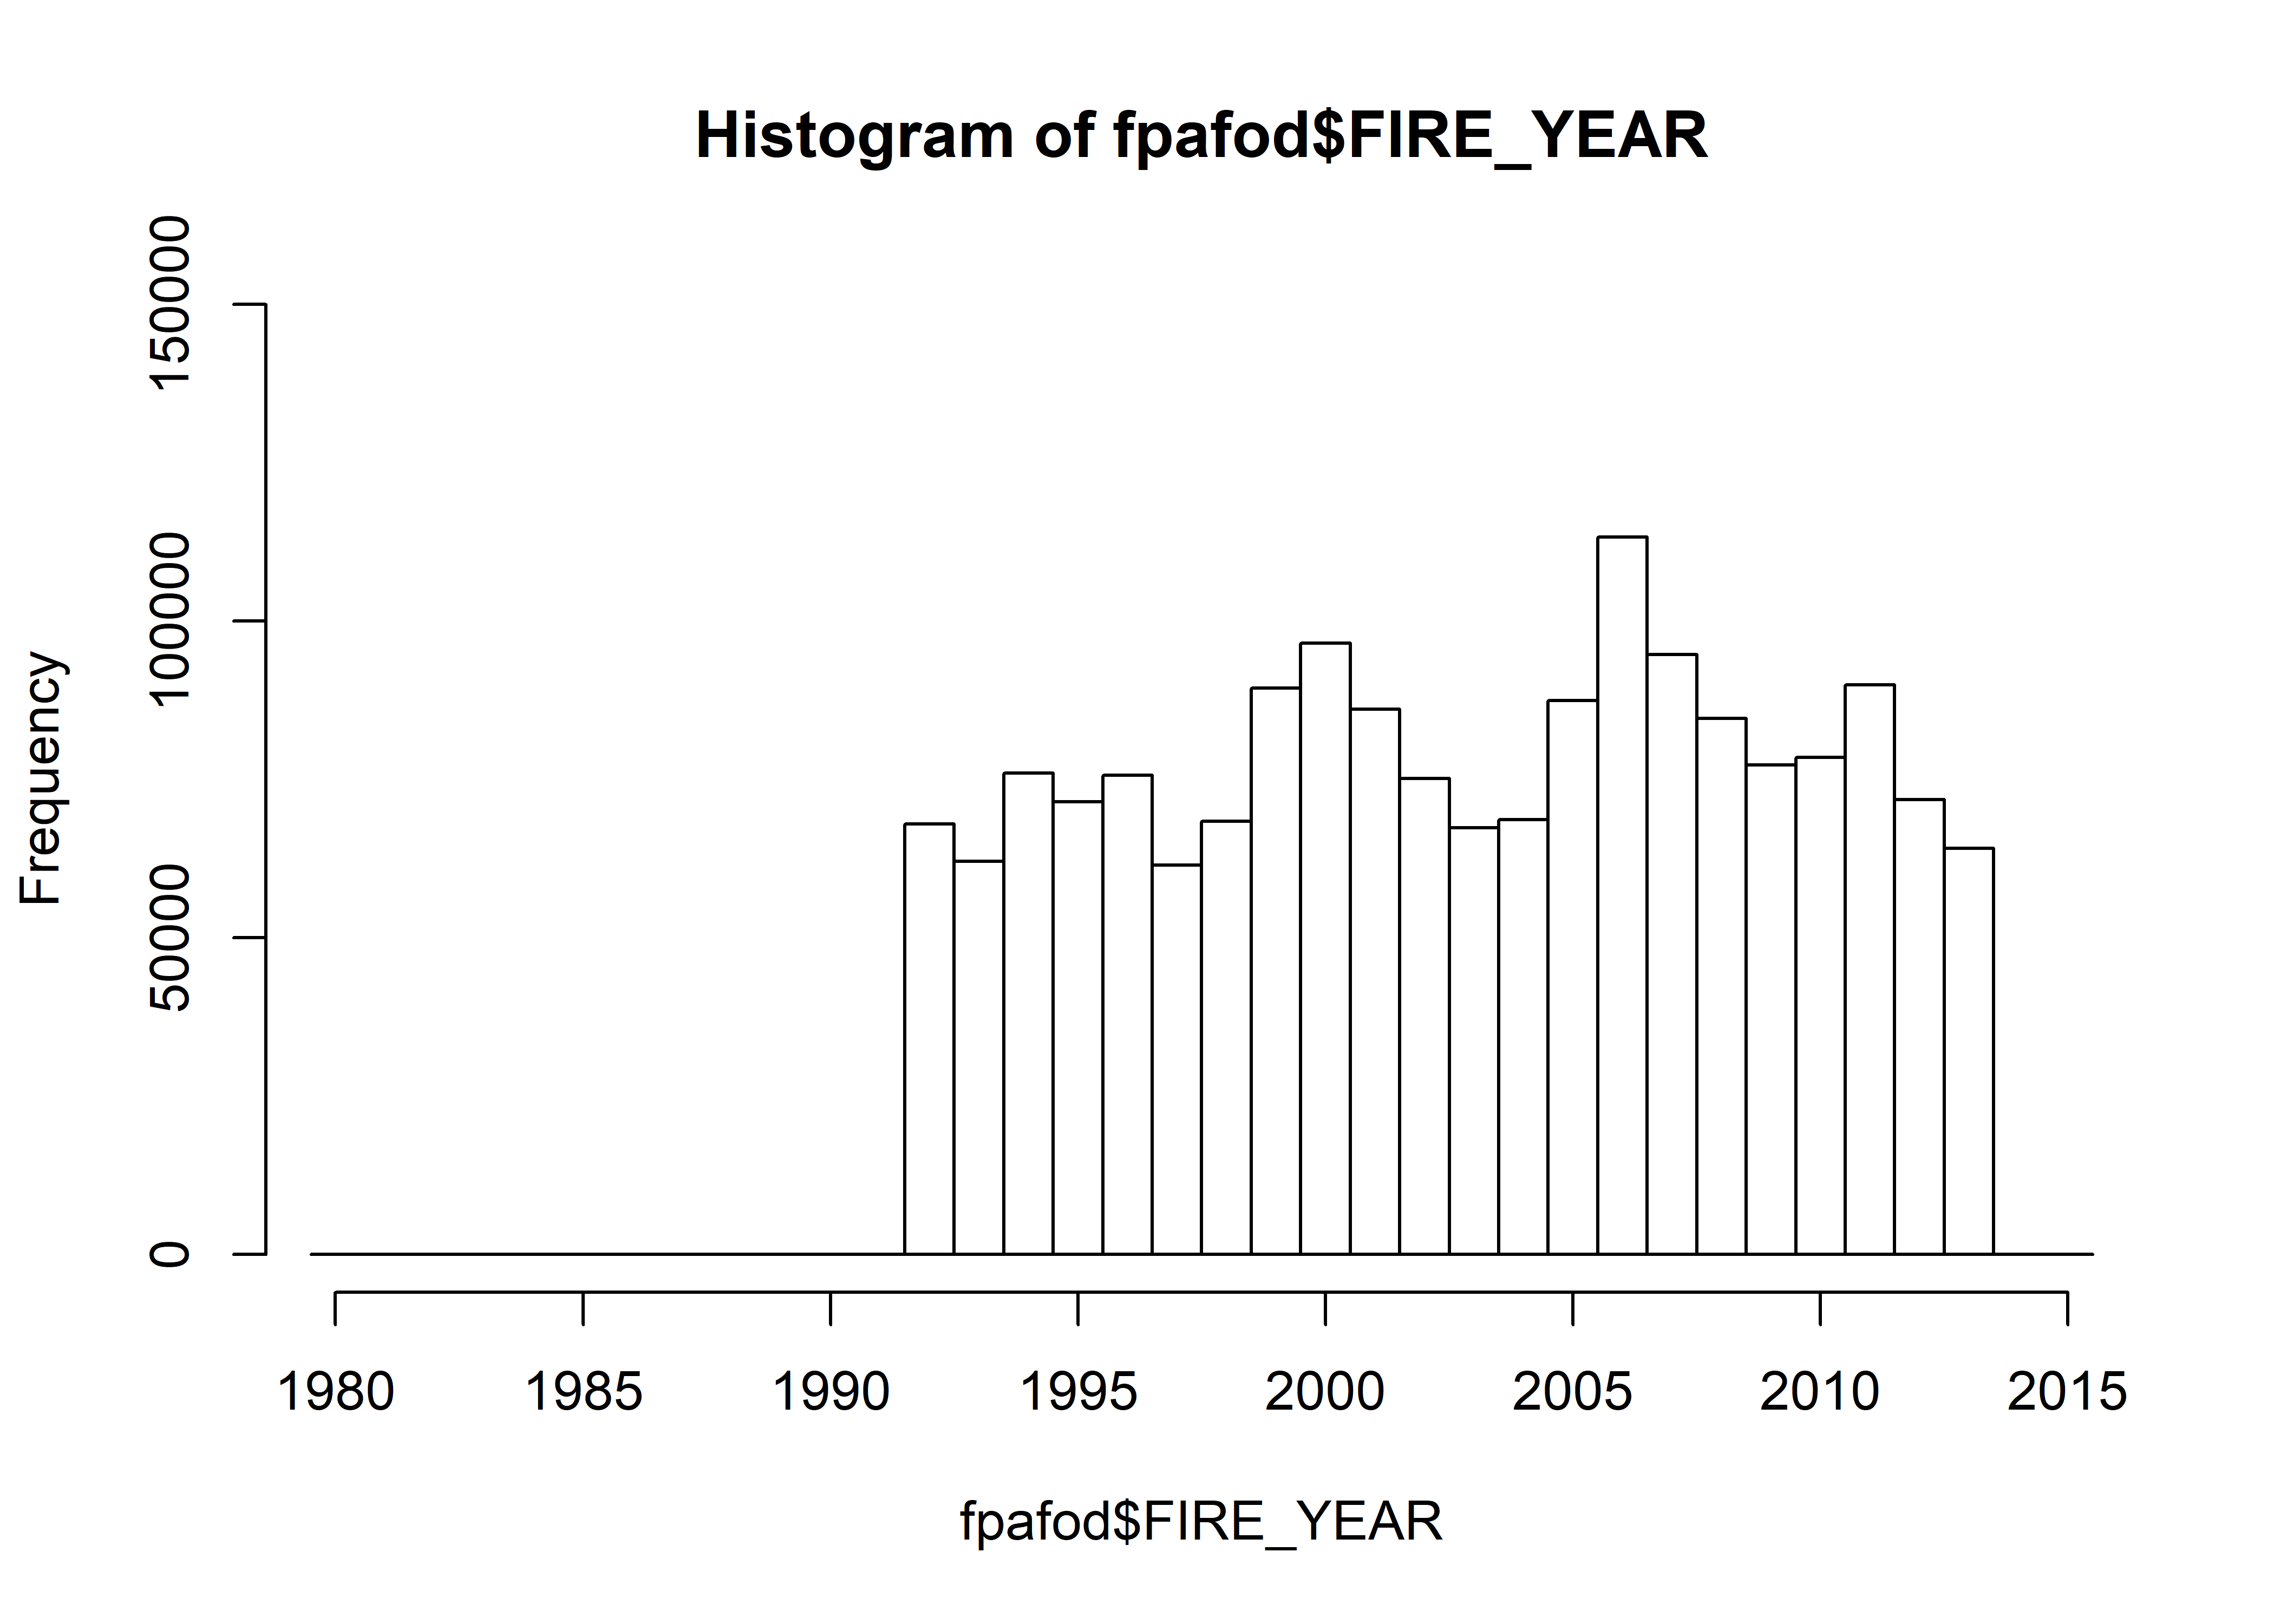
table(fpafod$FIRE_YEAR)##
## 1992 1993 1994 1995 1996 1997 1998 1999 2000 2001 2002 2003 2004 2005 2006
## 67964 62022 75989 71496 75604 61472 68388 89398 96454 86069 75136 67380 68616 87391 113242
## 2007 2008 2009 2010 2011 2012 2013
## 94681 84654 77262 78485 89897 71768 64108hist(fpafod$FIRE_YEAR[fpafod$STAT_CAUSE_CODE == 1], xlim=c(1980,2015), ylim=c(0,150000),
breaks=seq(1979.5,2014.5,by=1), main="fpafod Natural")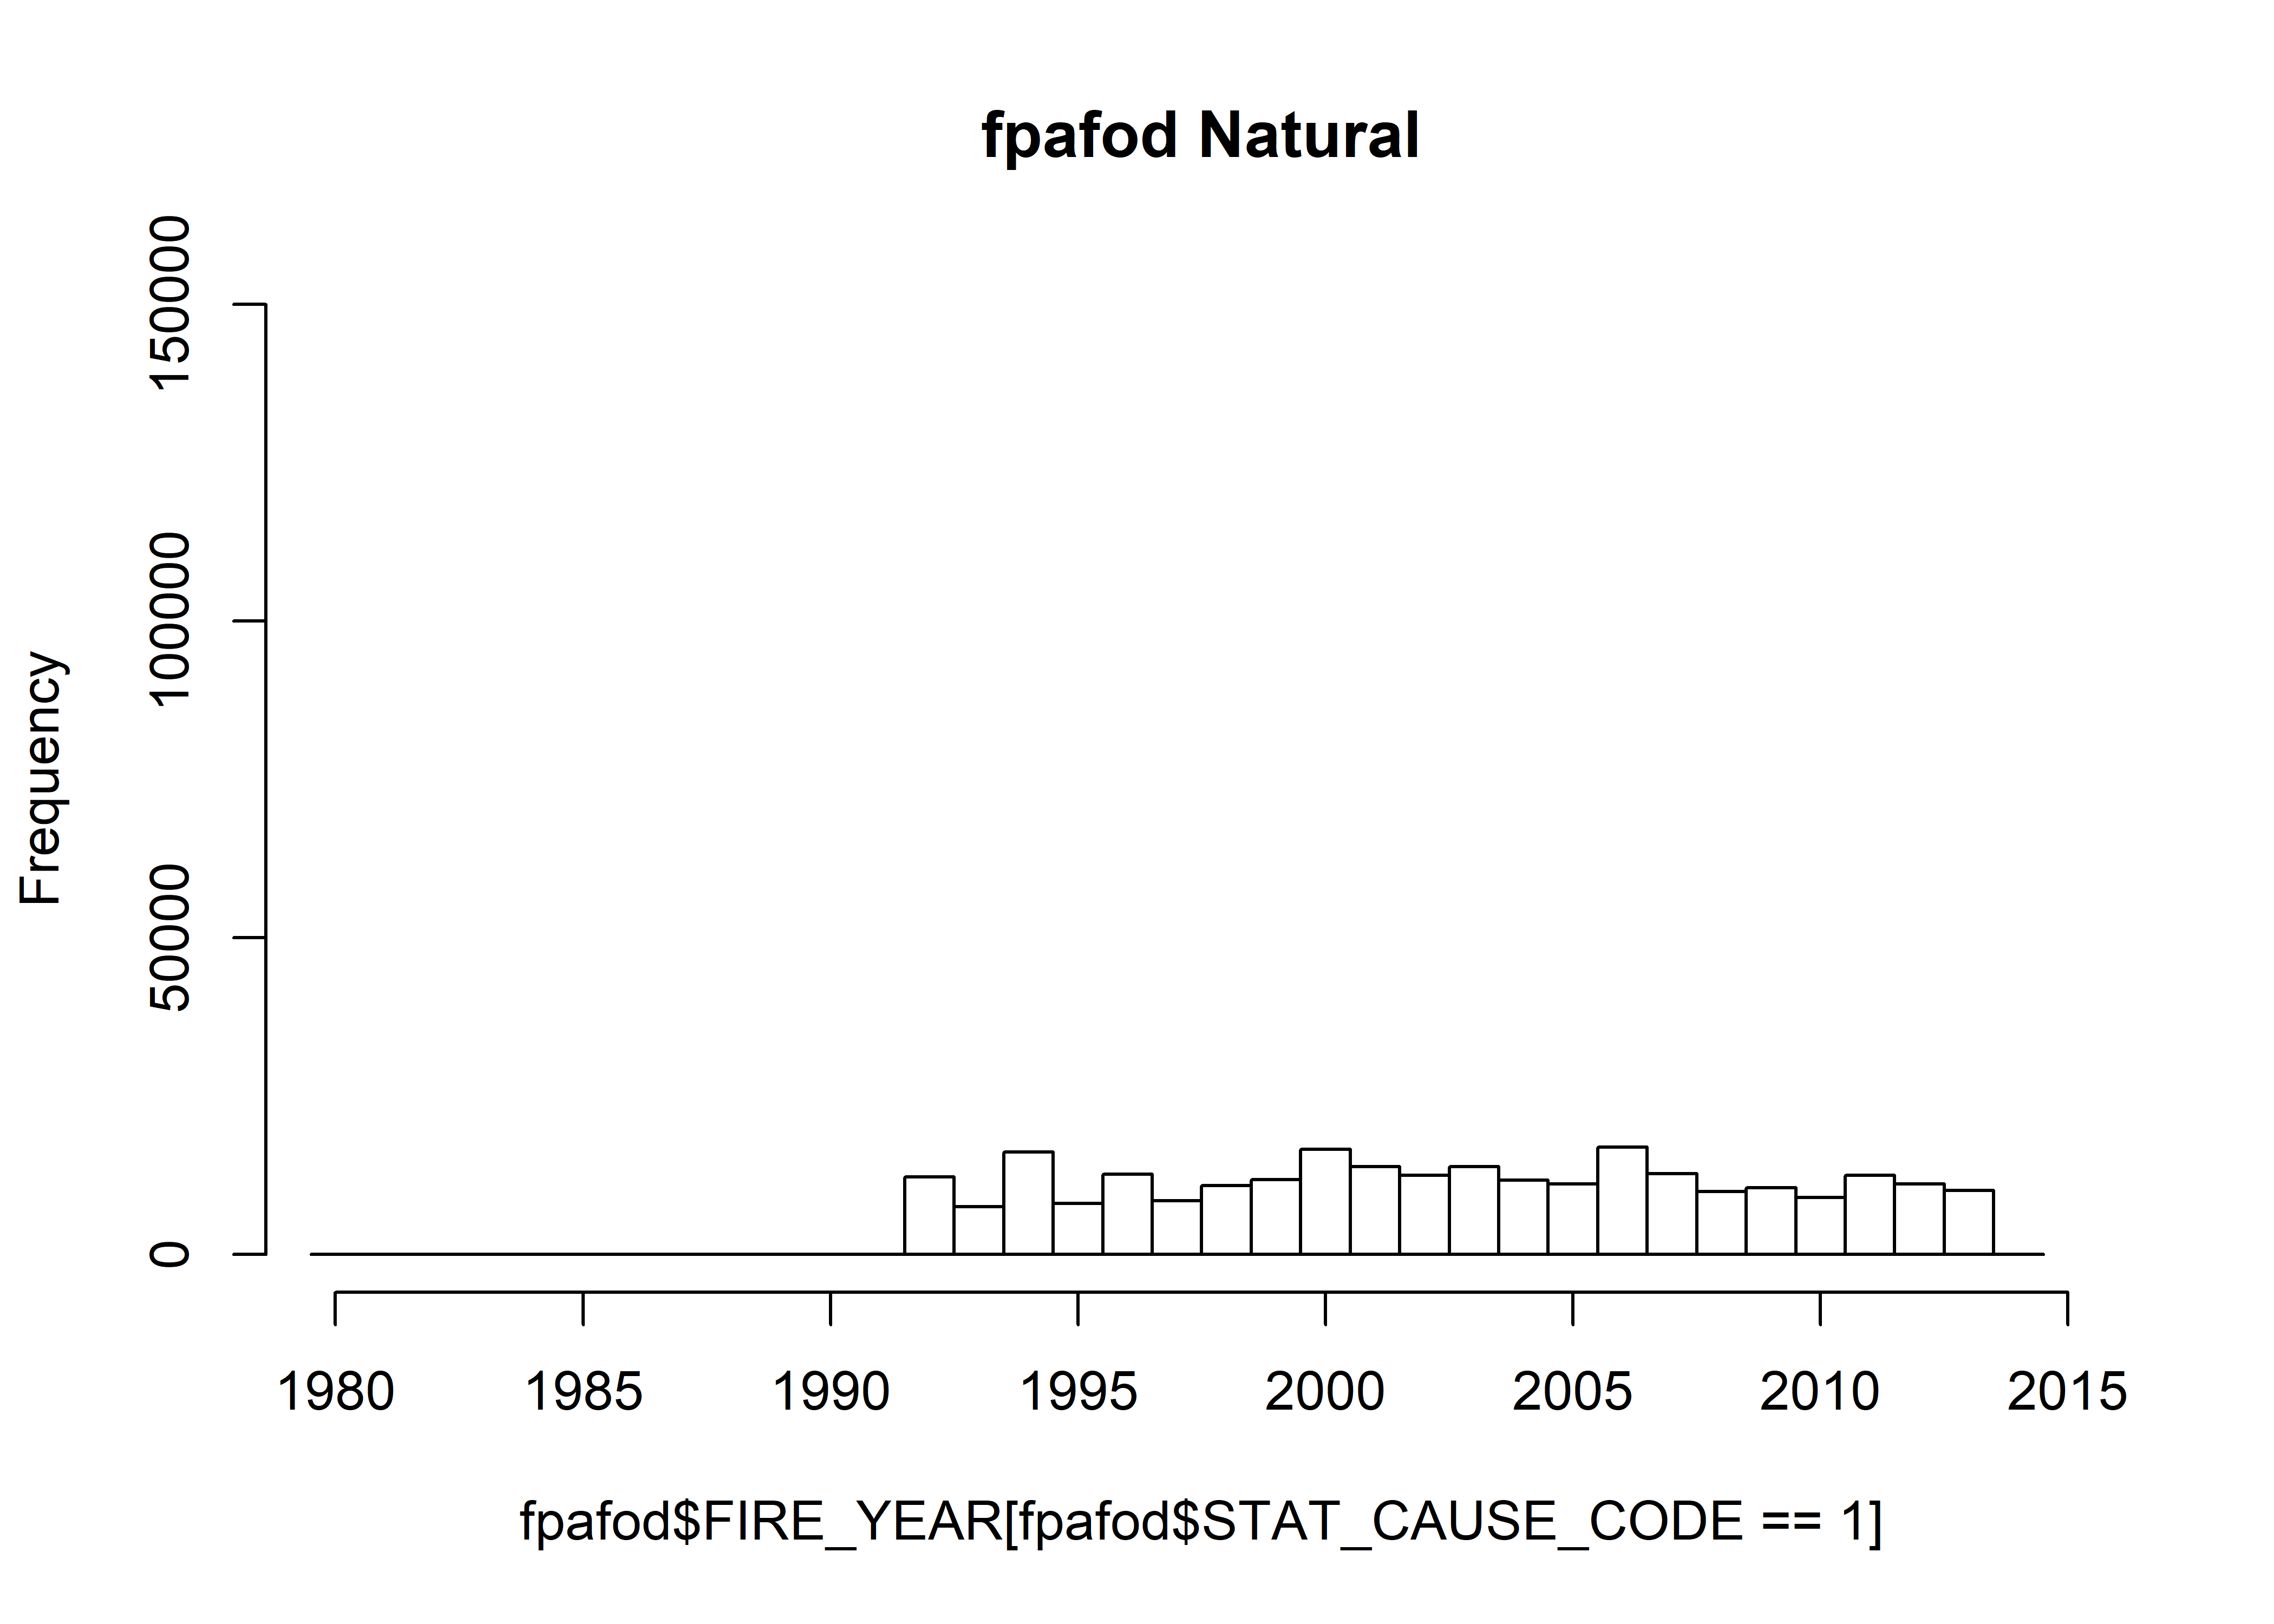
table(fpafod$FIRE_YEAR[fpafod$STAT_CAUSE_CODE == 1])##
## 1992 1993 1994 1995 1996 1997 1998 1999 2000 2001 2002 2003 2004 2005 2006 2007 2008
## 12240 7545 16212 8078 12643 8456 10893 11810 16559 13842 12480 13849 11732 11104 16958 12719 9914
## 2009 2010 2011 2012 2013
## 10492 8980 12539 11130 10136hist(fpafod$FIRE_YEAR[fpafod$STAT_CAUSE_CODE > 1], xlim=c(1980,2015), ylim=c(0,150000),
breaks=seq(1979.5,2014.5,by=1), main="fpafod Human")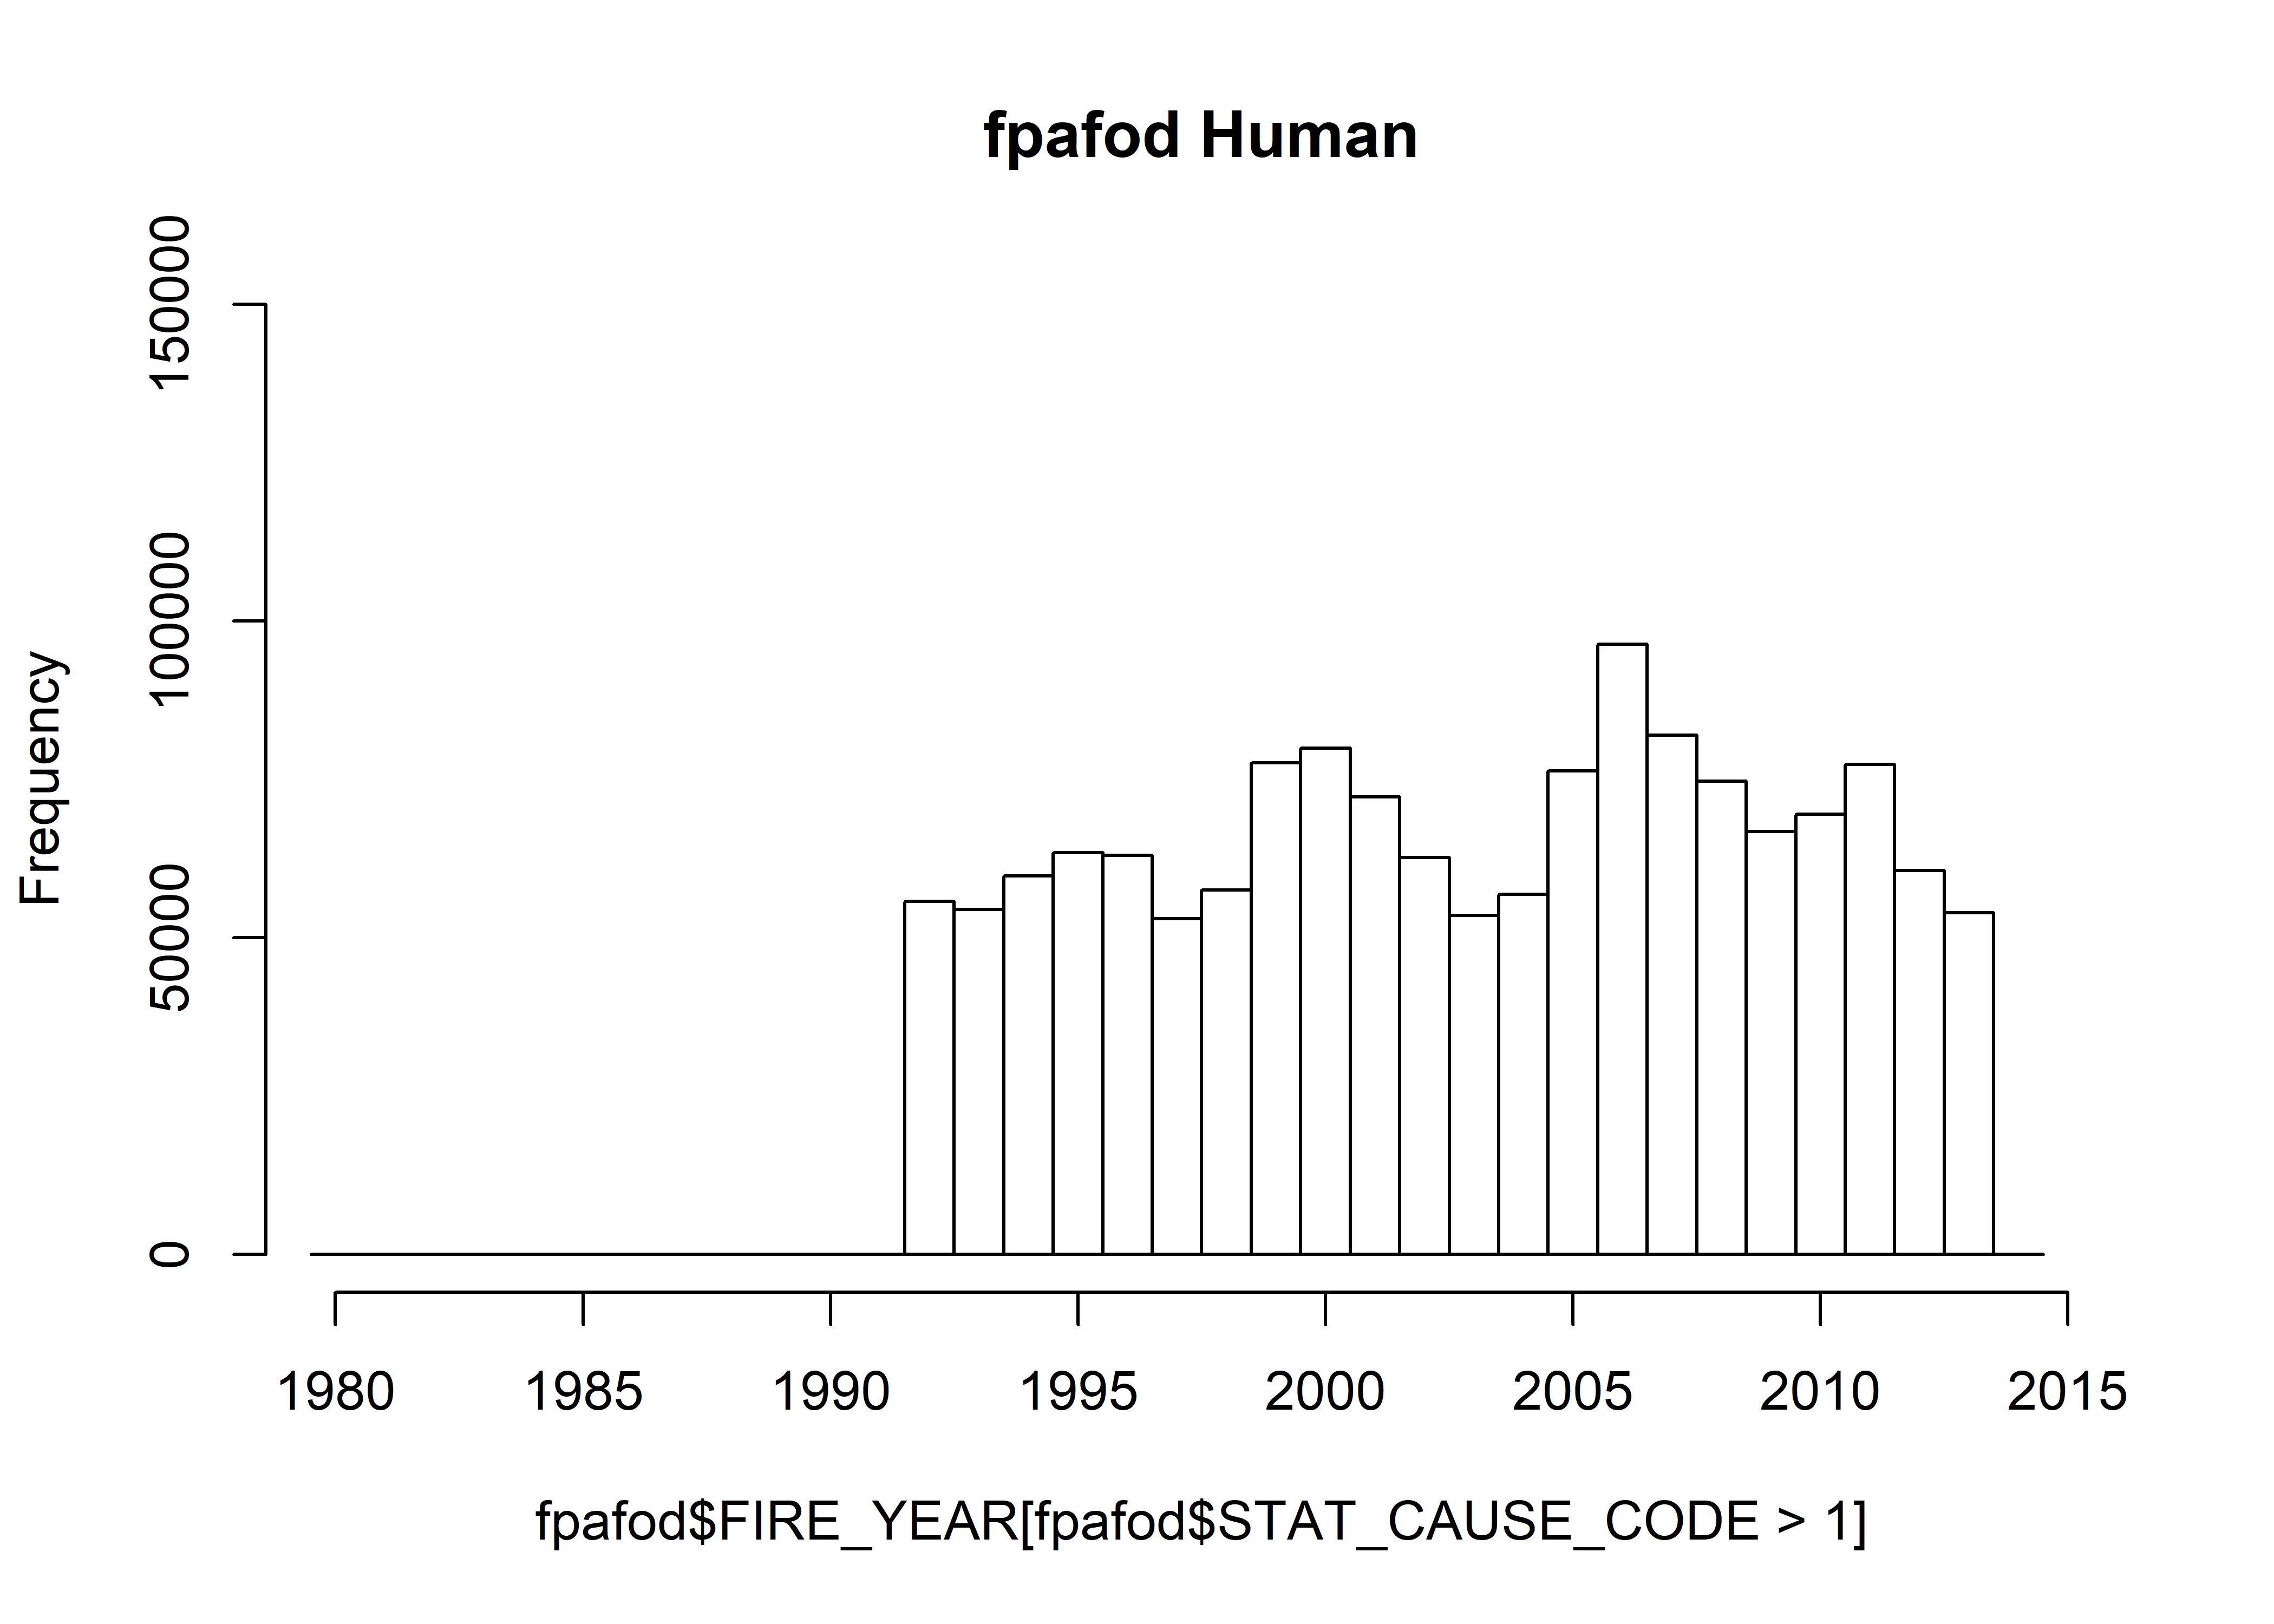
table(fpafod$FIRE_YEAR[fpafod$STAT_CAUSE_CODE > 1])##
## 1992 1993 1994 1995 1996 1997 1998 1999 2000 2001 2002 2003 2004 2005 2006 2007 2008
## 55724 54477 59777 63418 62961 53016 57495 77588 79895 72227 62656 53531 56884 76287 96284 81962 74740
## 2009 2010 2011 2012 2013
## 66770 69505 77358 60638 53972Get the total area burned by year
total_by_year <- tapply(fpafod$AREA_HA, fpafod$FIRE_YEAR, sum)
total_by_year
## 1992 1993 1994 1995 1996 1997 1998 1999 2000 2001
## 889967.4 886494.5 1666373.0 829494.6 2430644.9 1301188.9 806010.4 2455889.8 3090726.6 1506323.0
## 2002 2003 2004 2005 2006 2007 2008 2009 2010 2011
## 2752402.0 1810067.0 3331301.4 3901577.5 4062770.0 3748792.6 2187148.7 2449661.4 1411129.9 3891441.7
## 2012 2013
## 3820172.7 1816678.9year <- as.numeric(unlist(dimnames(total_by_year)))
total_by_year <- as.numeric(total_by_year)
plot(total_by_year ~ year, pch=16, type="o", lwd=3, col="red", main="Total Area Burned (ha) (U.S. All)")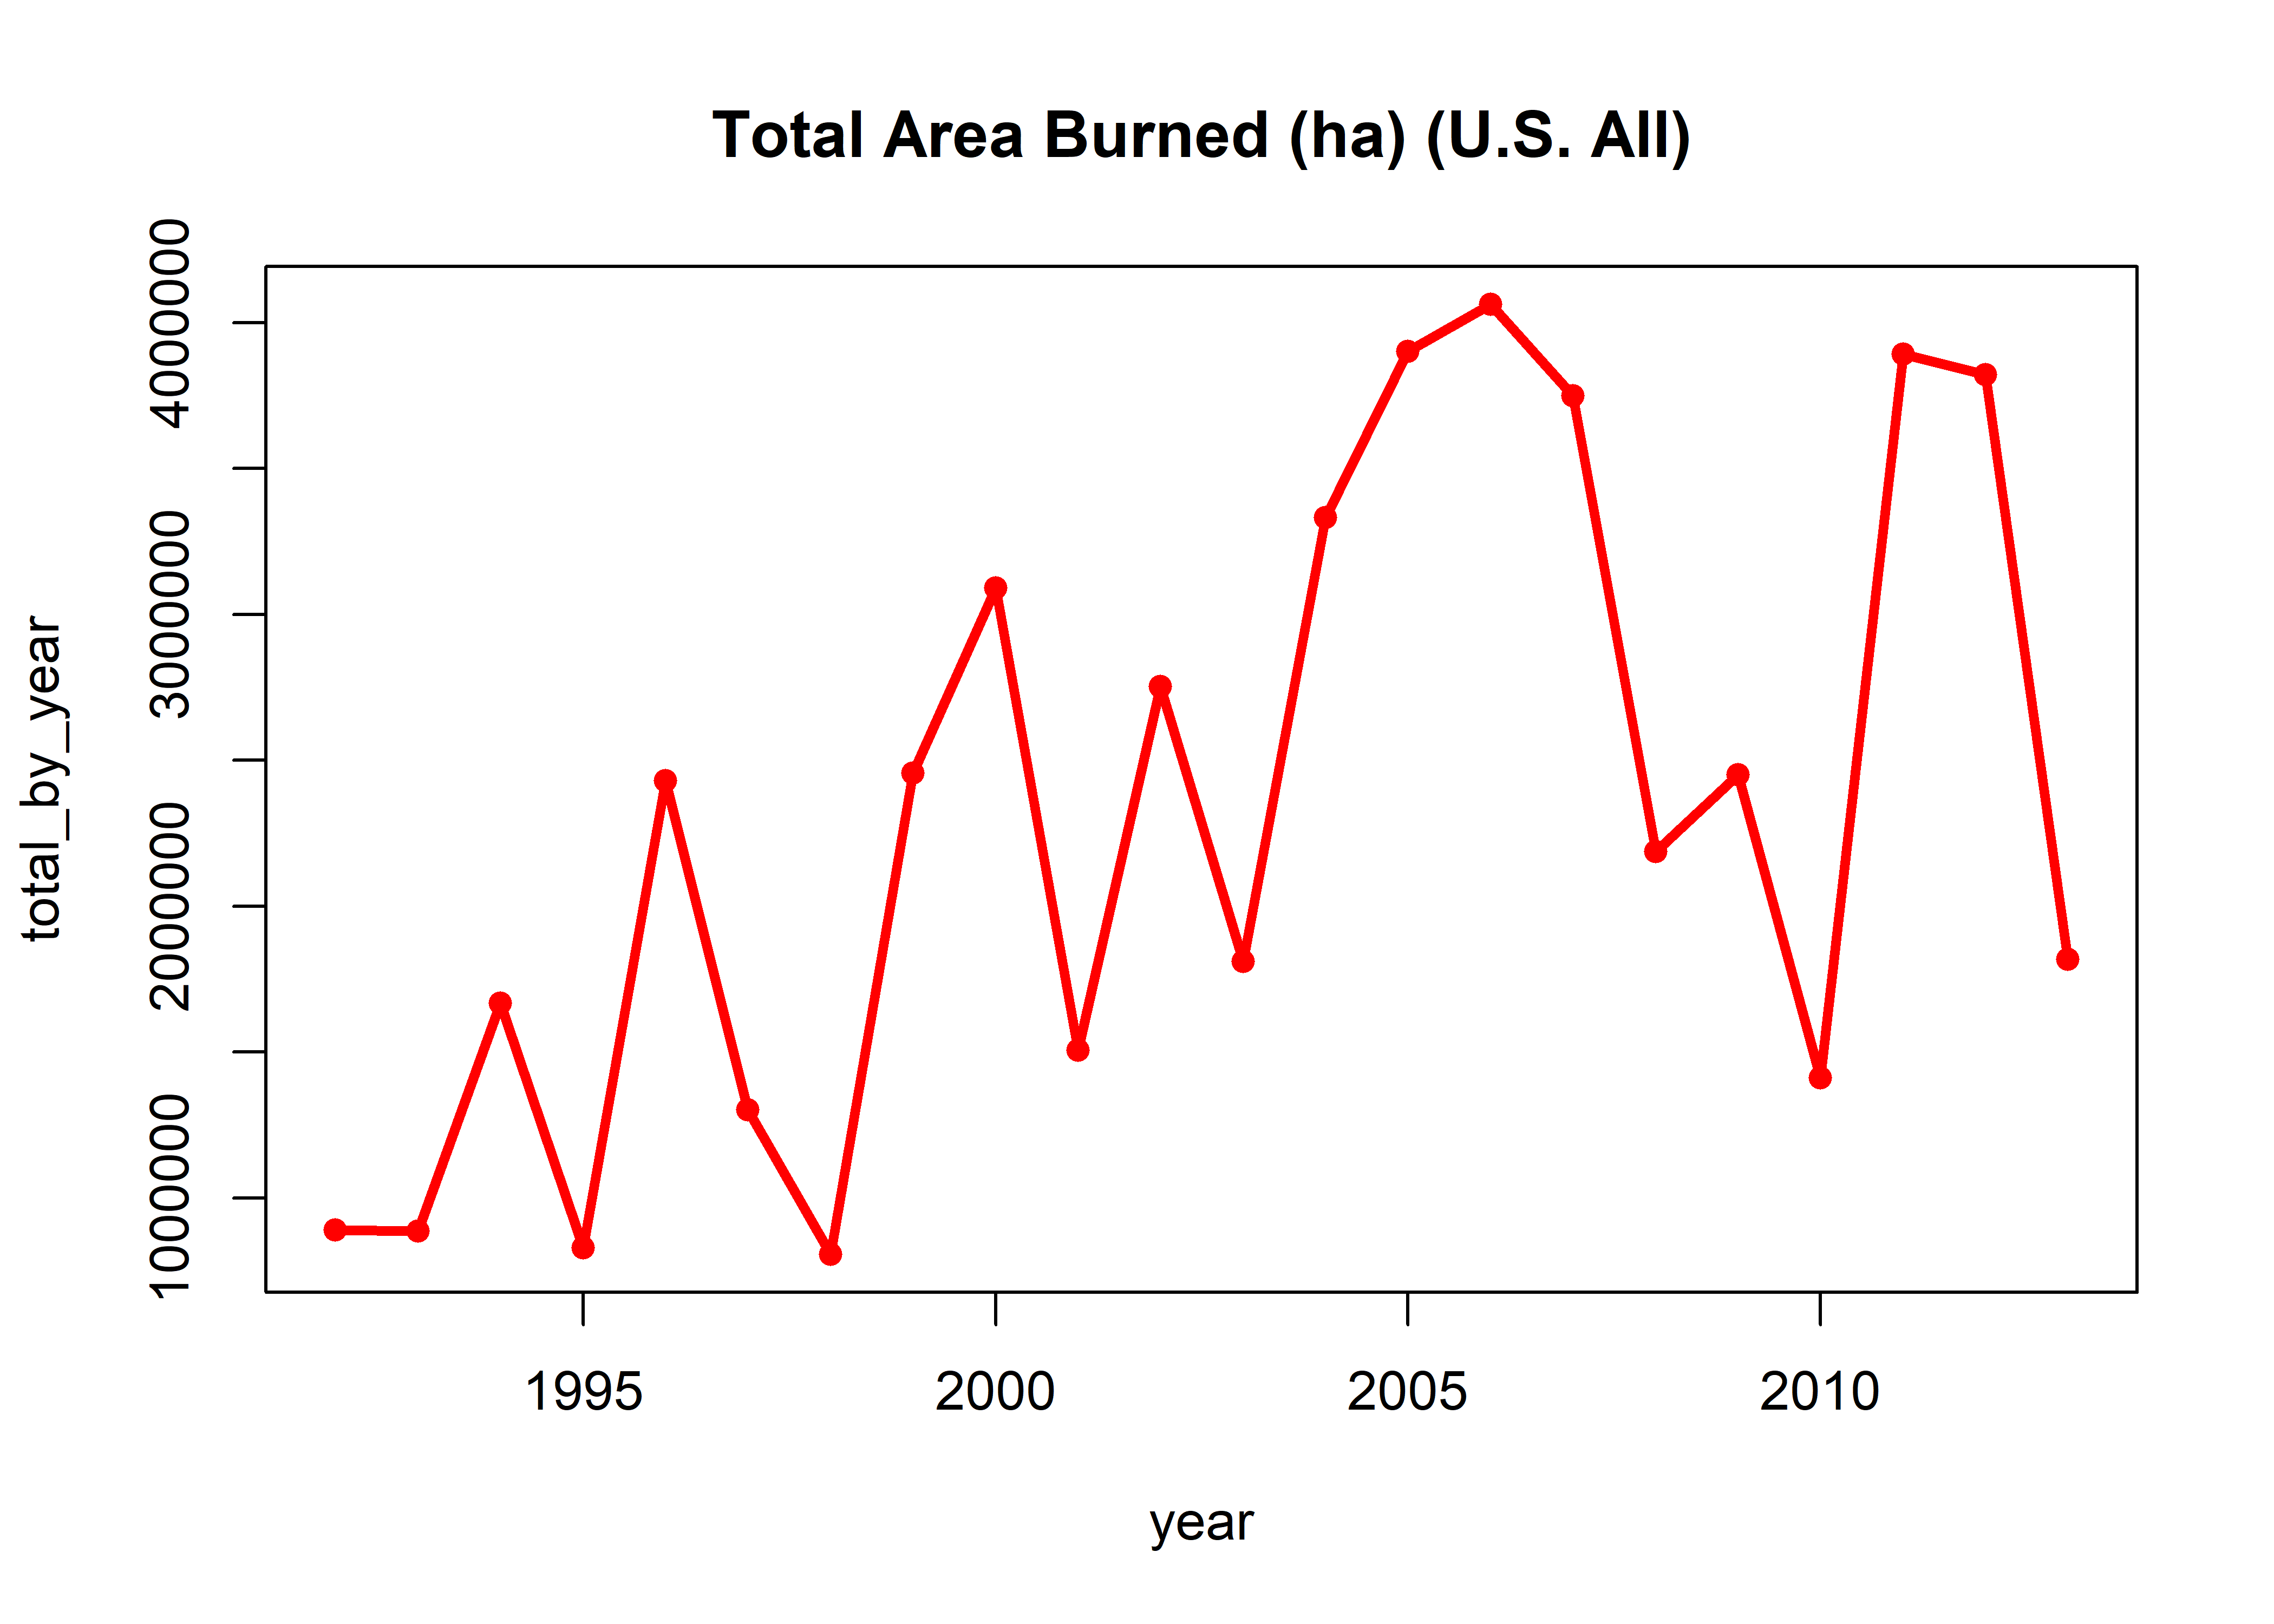
Mean area burned by year.
mean_by_year <- tapply(fpafod$AREA_HA, fpafod$FIRE_YEAR, mean)
mean_by_year
## 1992 1993 1994 1995 1996 1997 1998 1999 2000 2001 2002
## 13.09469 14.29323 21.92913 11.60197 32.14969 21.16718 11.78585 27.47142 32.04353 17.50134 36.63227
## 2003 2004 2005 2006 2007 2008 2009 2010 2011 2012 2013
## 26.86357 48.54992 44.64507 35.87688 39.59393 25.83633 31.70590 17.97961 43.28778 53.22947 28.33779year <- as.numeric(unlist(dimnames(mean_by_year)))
mean_by_year <- as.numeric(mean_by_year)
plot(mean_by_year ~ year, pch=16, type="o", lwd=3, col="red", main="Mean Area Burned (ha) (U.S. All)")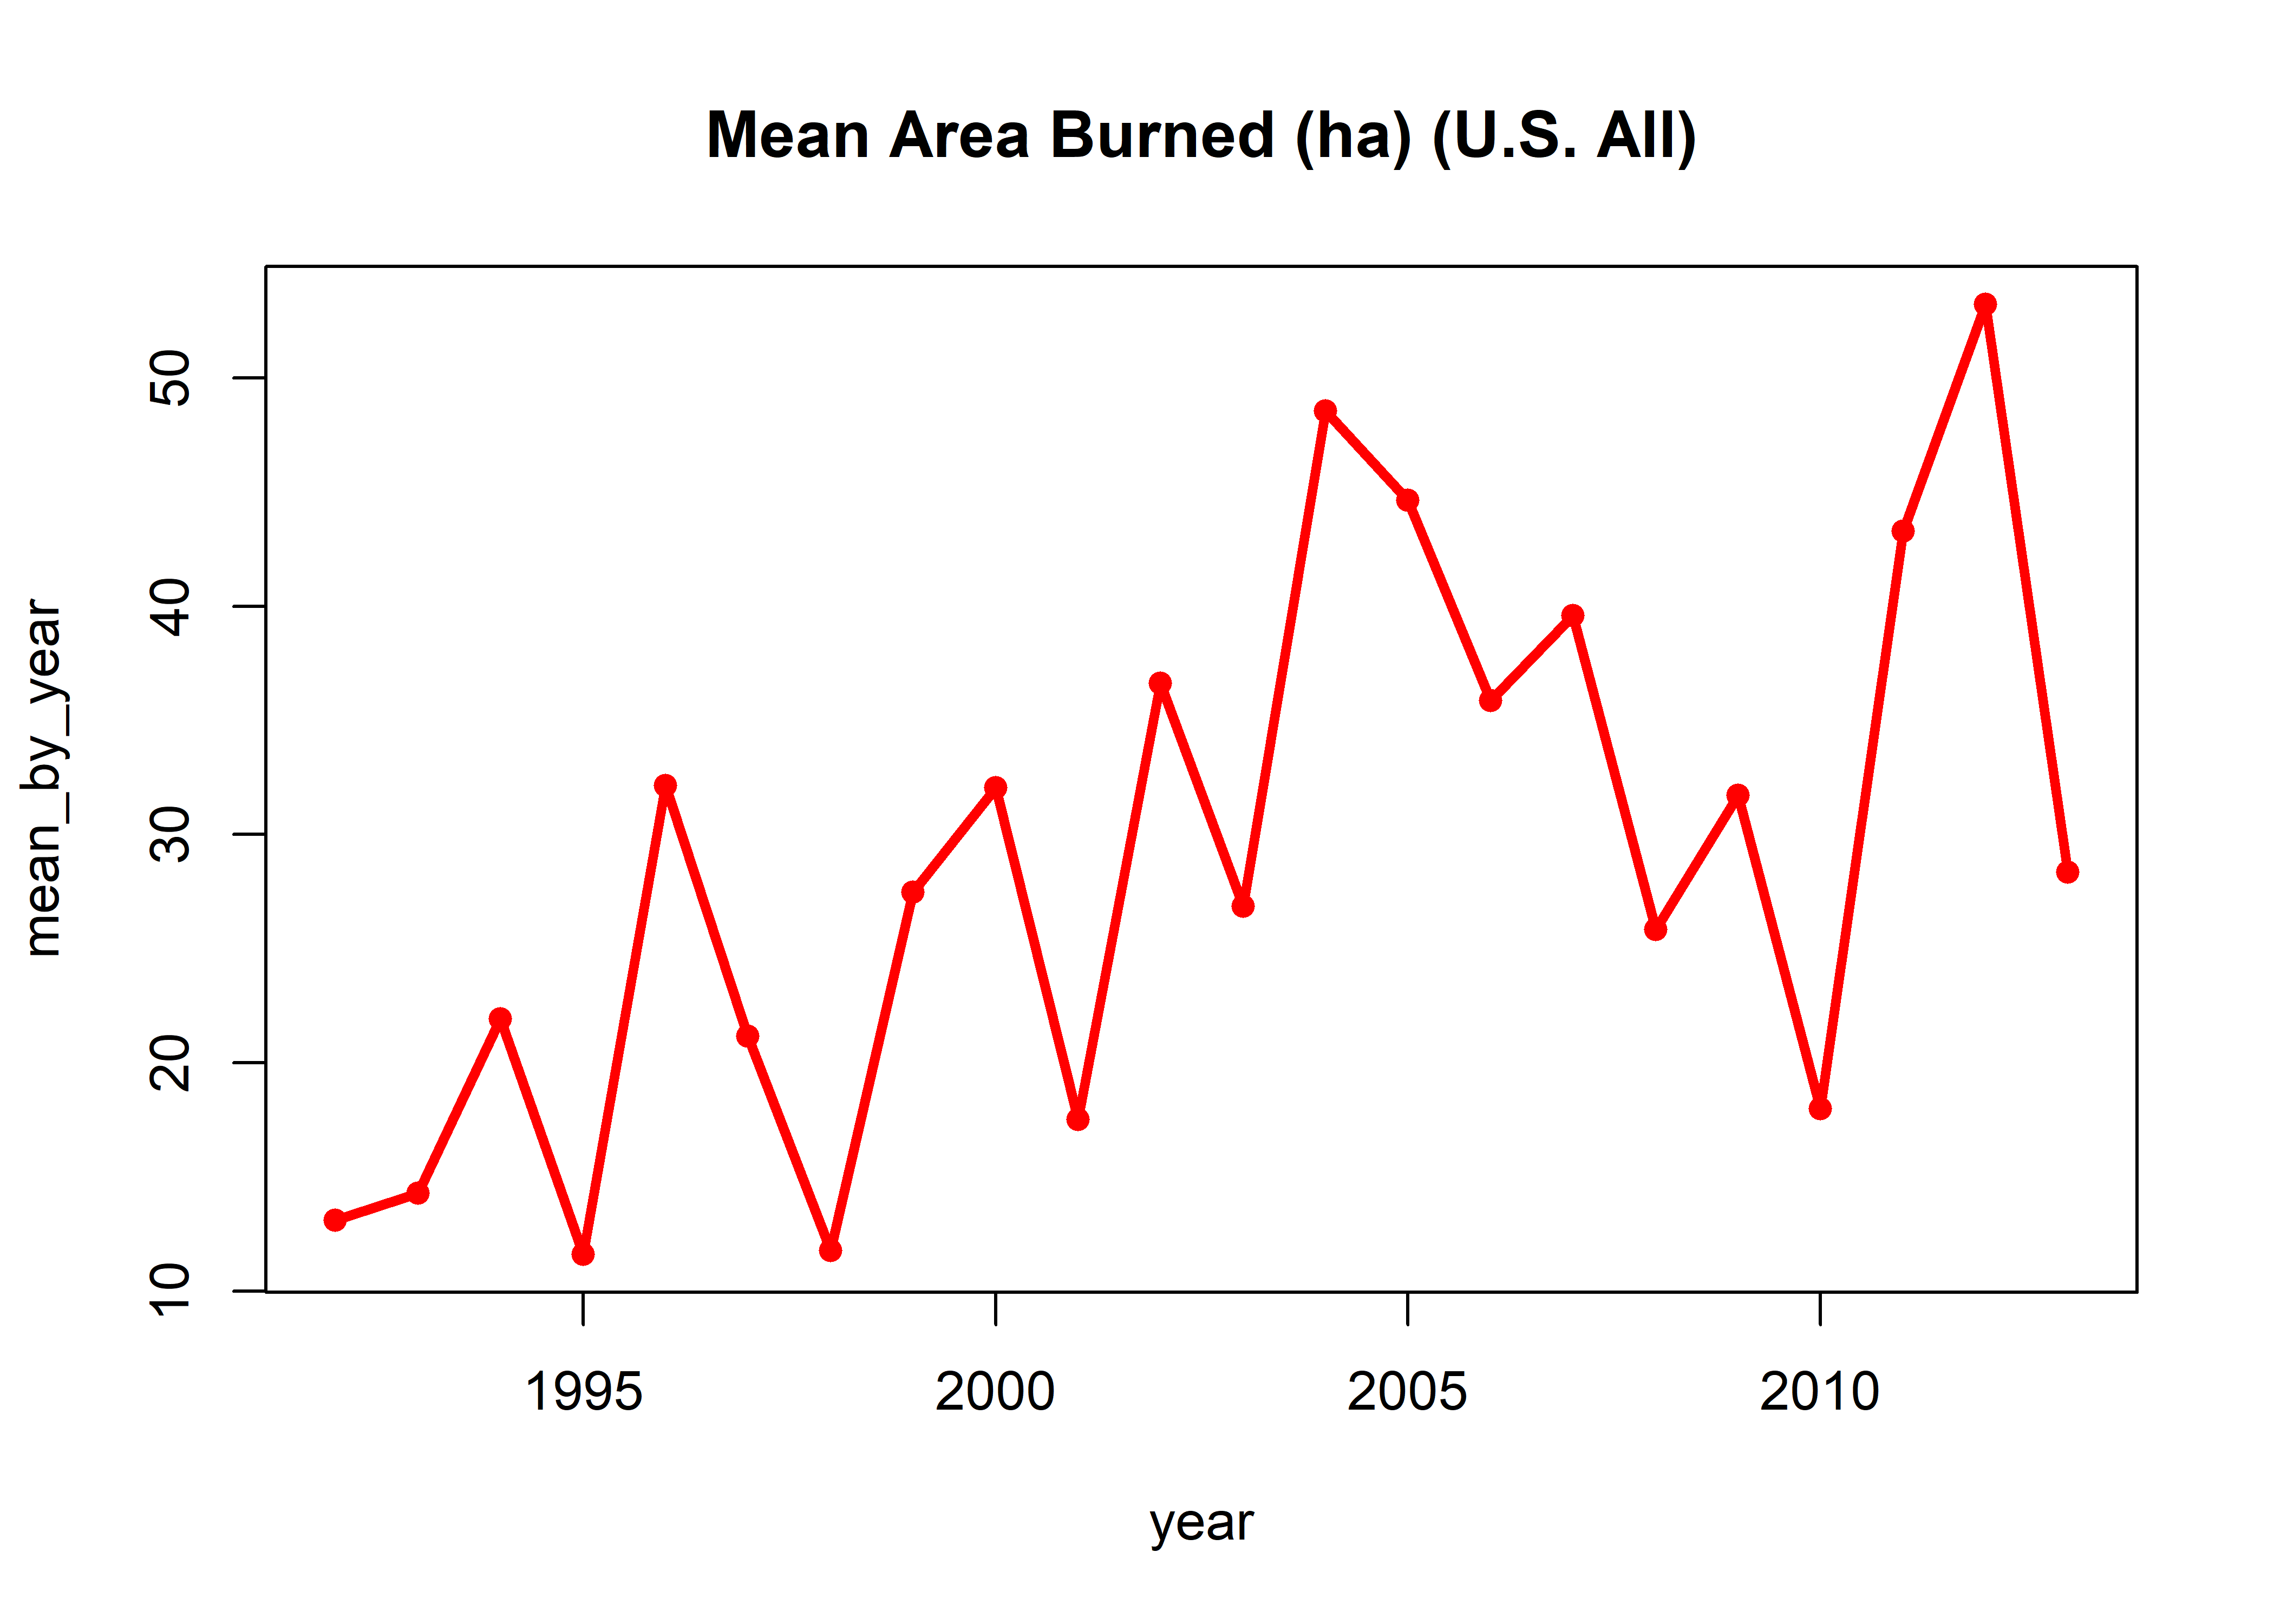
1.3.3 Start-day summaries
Histograms of the start day number
hist(fpafod$DISCOVERY_DOY, breaks=seq(-0.5,366.5,by=1), freq=-TRUE, ylim=c(0,12000), xlim=c(0,400))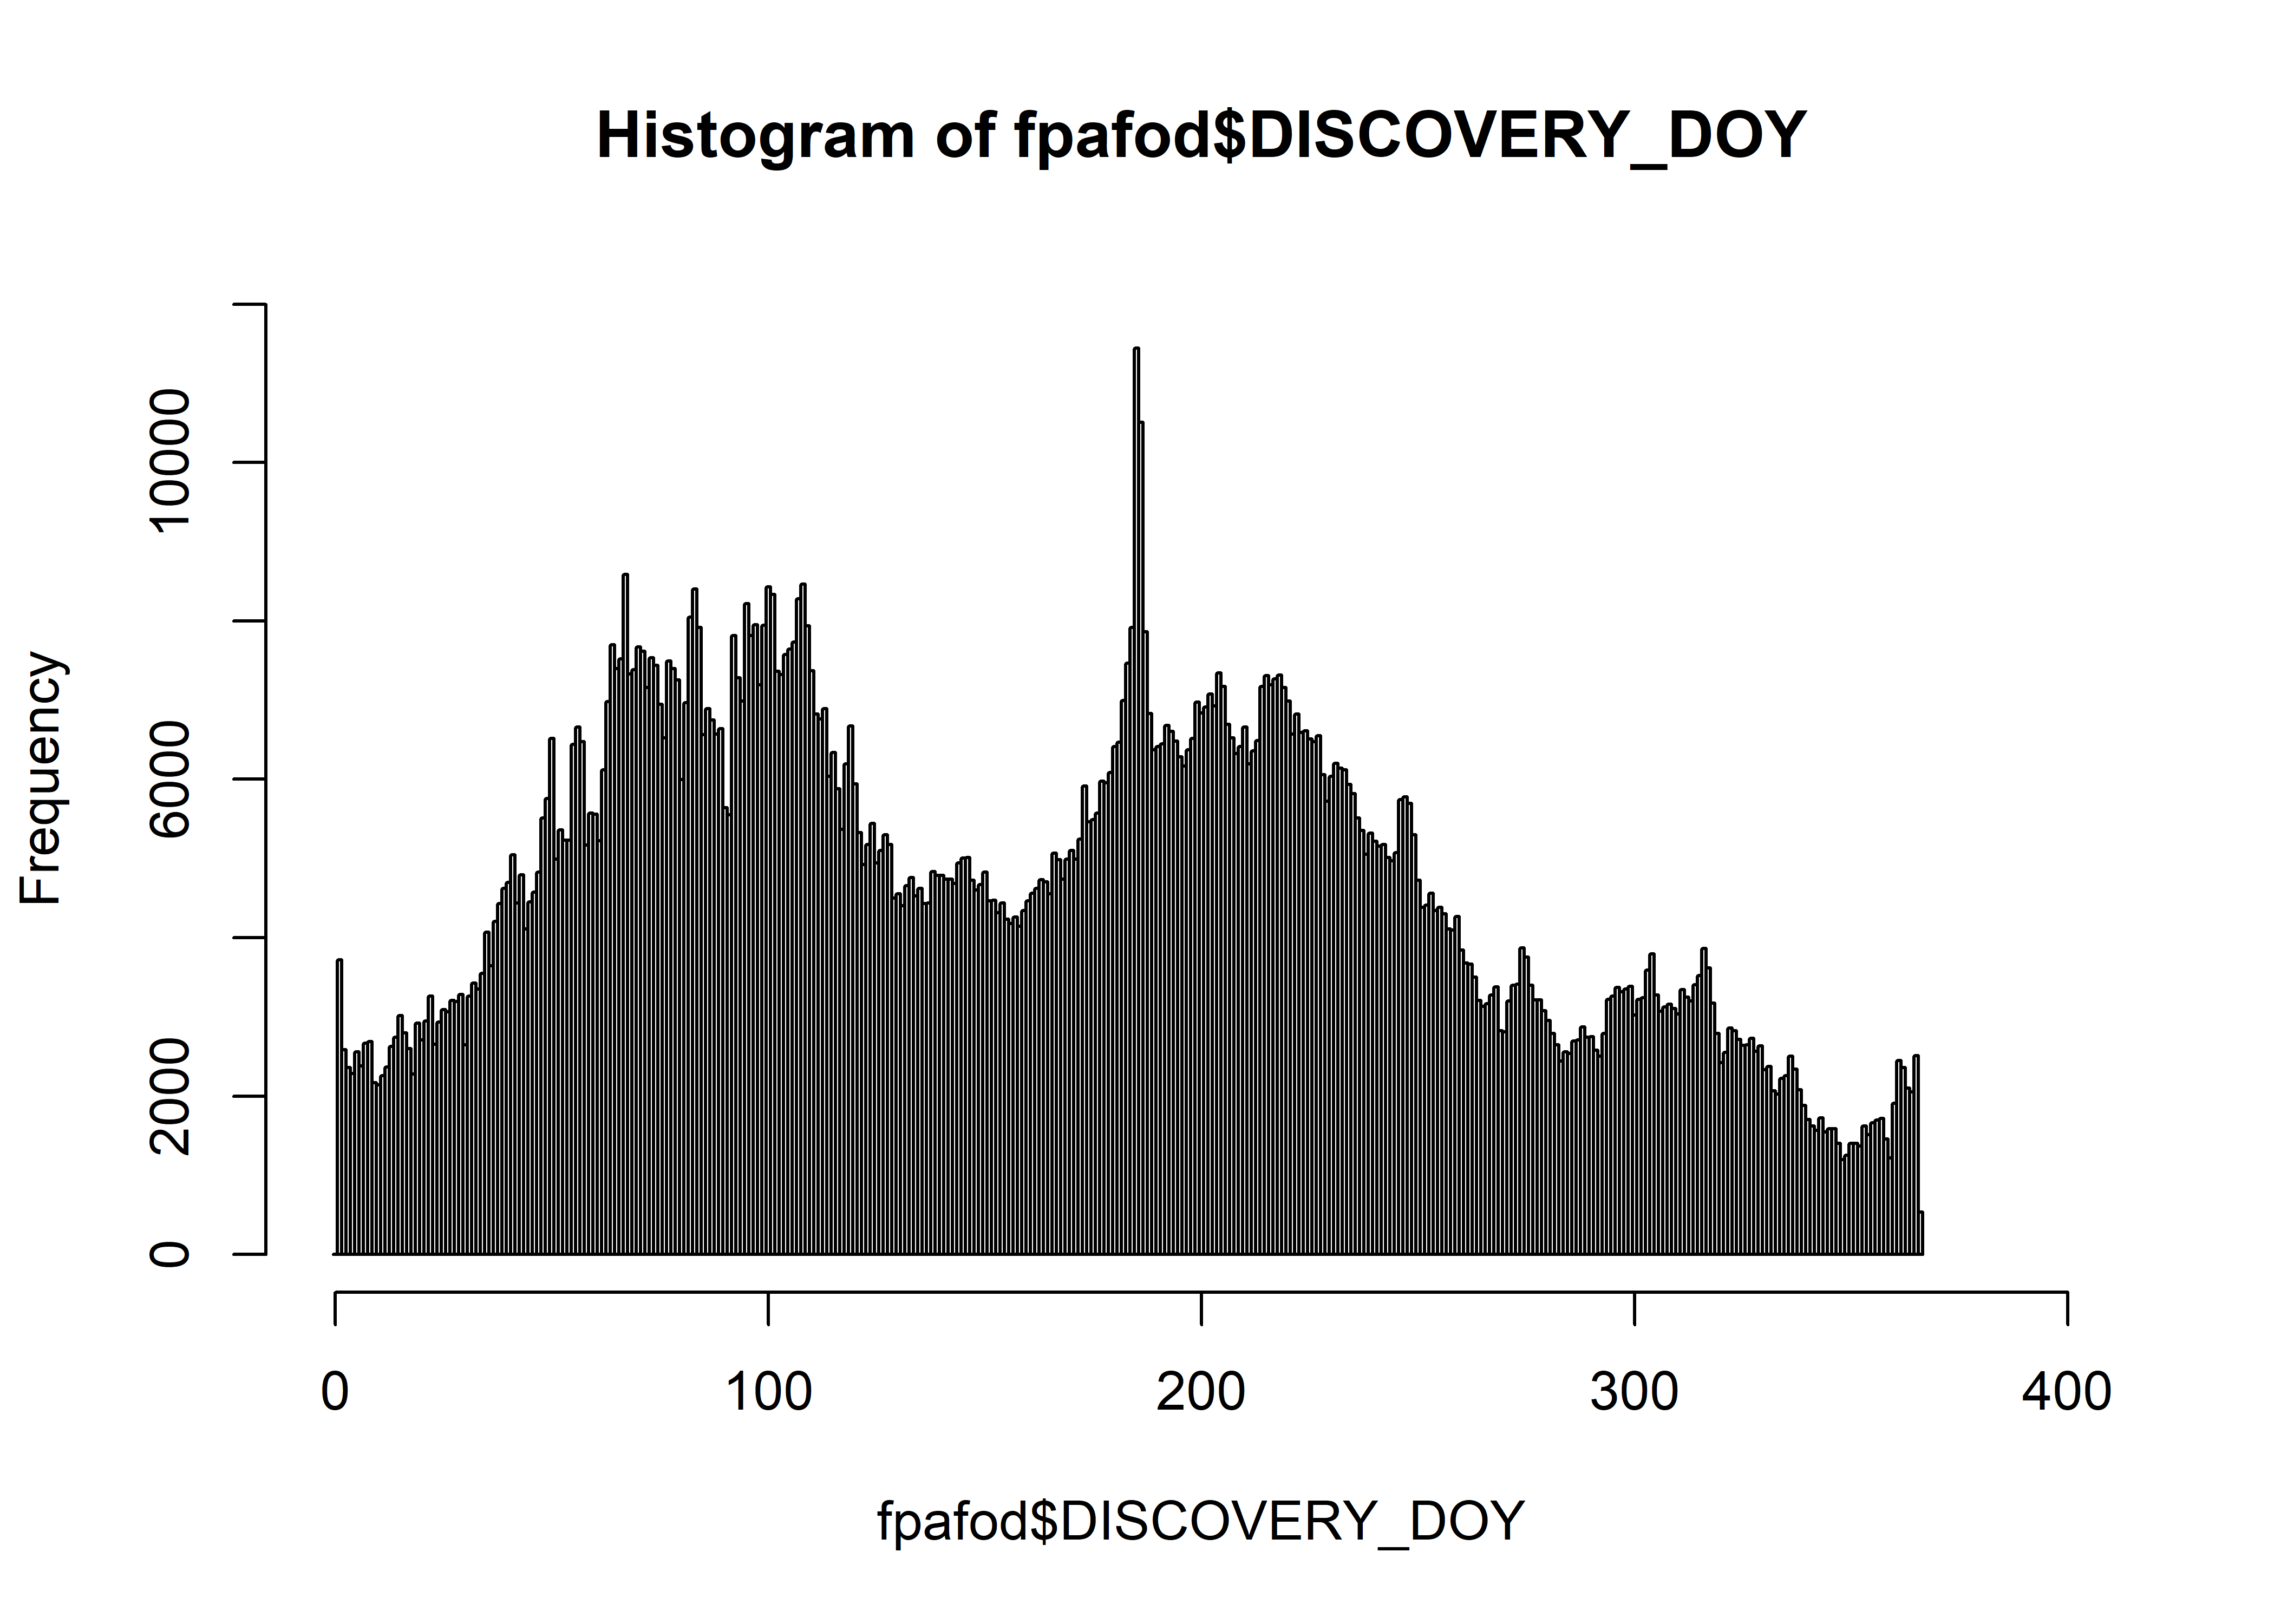
hist(fpafod$DISCOVERY_DOY[fpafod$STAT_CAUSE_CODE == 1], breaks=seq(-0.5,366.5,by=1), freq=-TRUE,
  ylim=c(0,12000), xlim=c(0,400), main="DISCOVERY_DOY (Lightning)")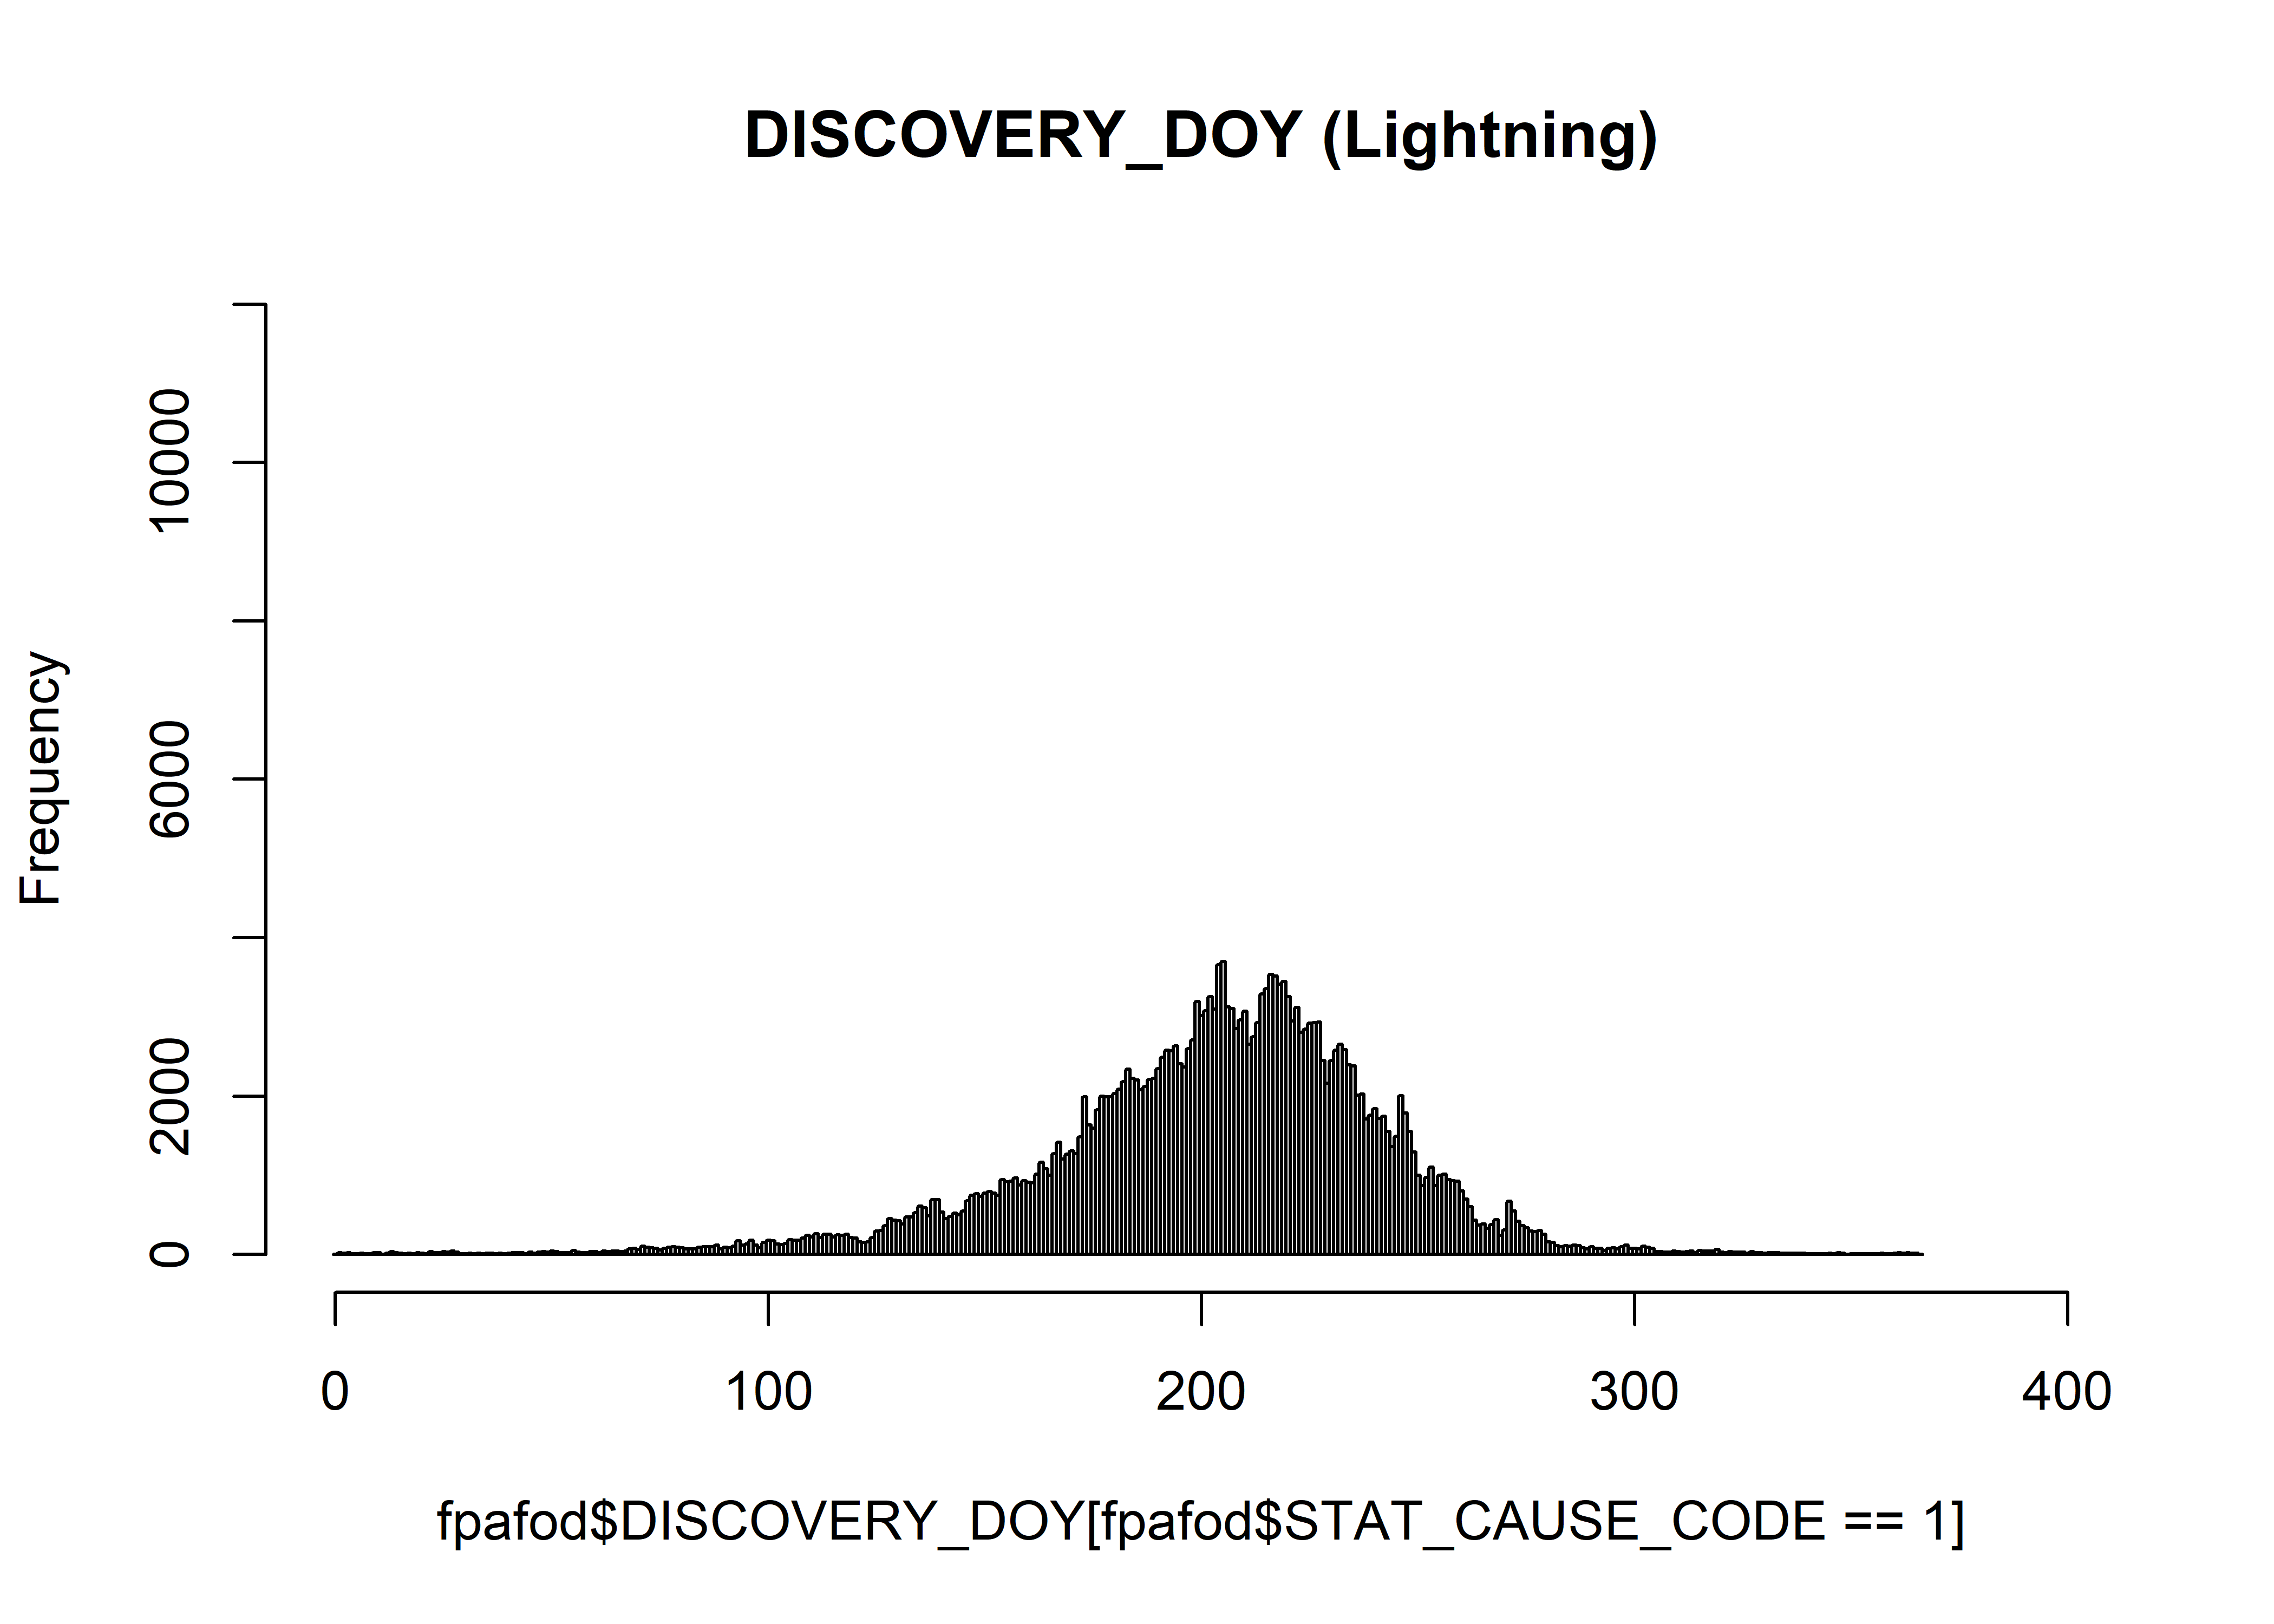
hist(fpafod$DISCOVERY_DOY[fpafod$STAT_CAUSE_CODE > 1], breaks=seq(-0.5,366.5,by=1), freq=-TRUE,
  ylim=c(0,12000), xlim=c(0,400), main="DISCOVERY_DOY (Human)")
Histograms of the start day over all months
hist(fpafod$startday, breaks=seq(-0.5,31.5,by=1), freq=-TRUE, ylim=c(0,70000))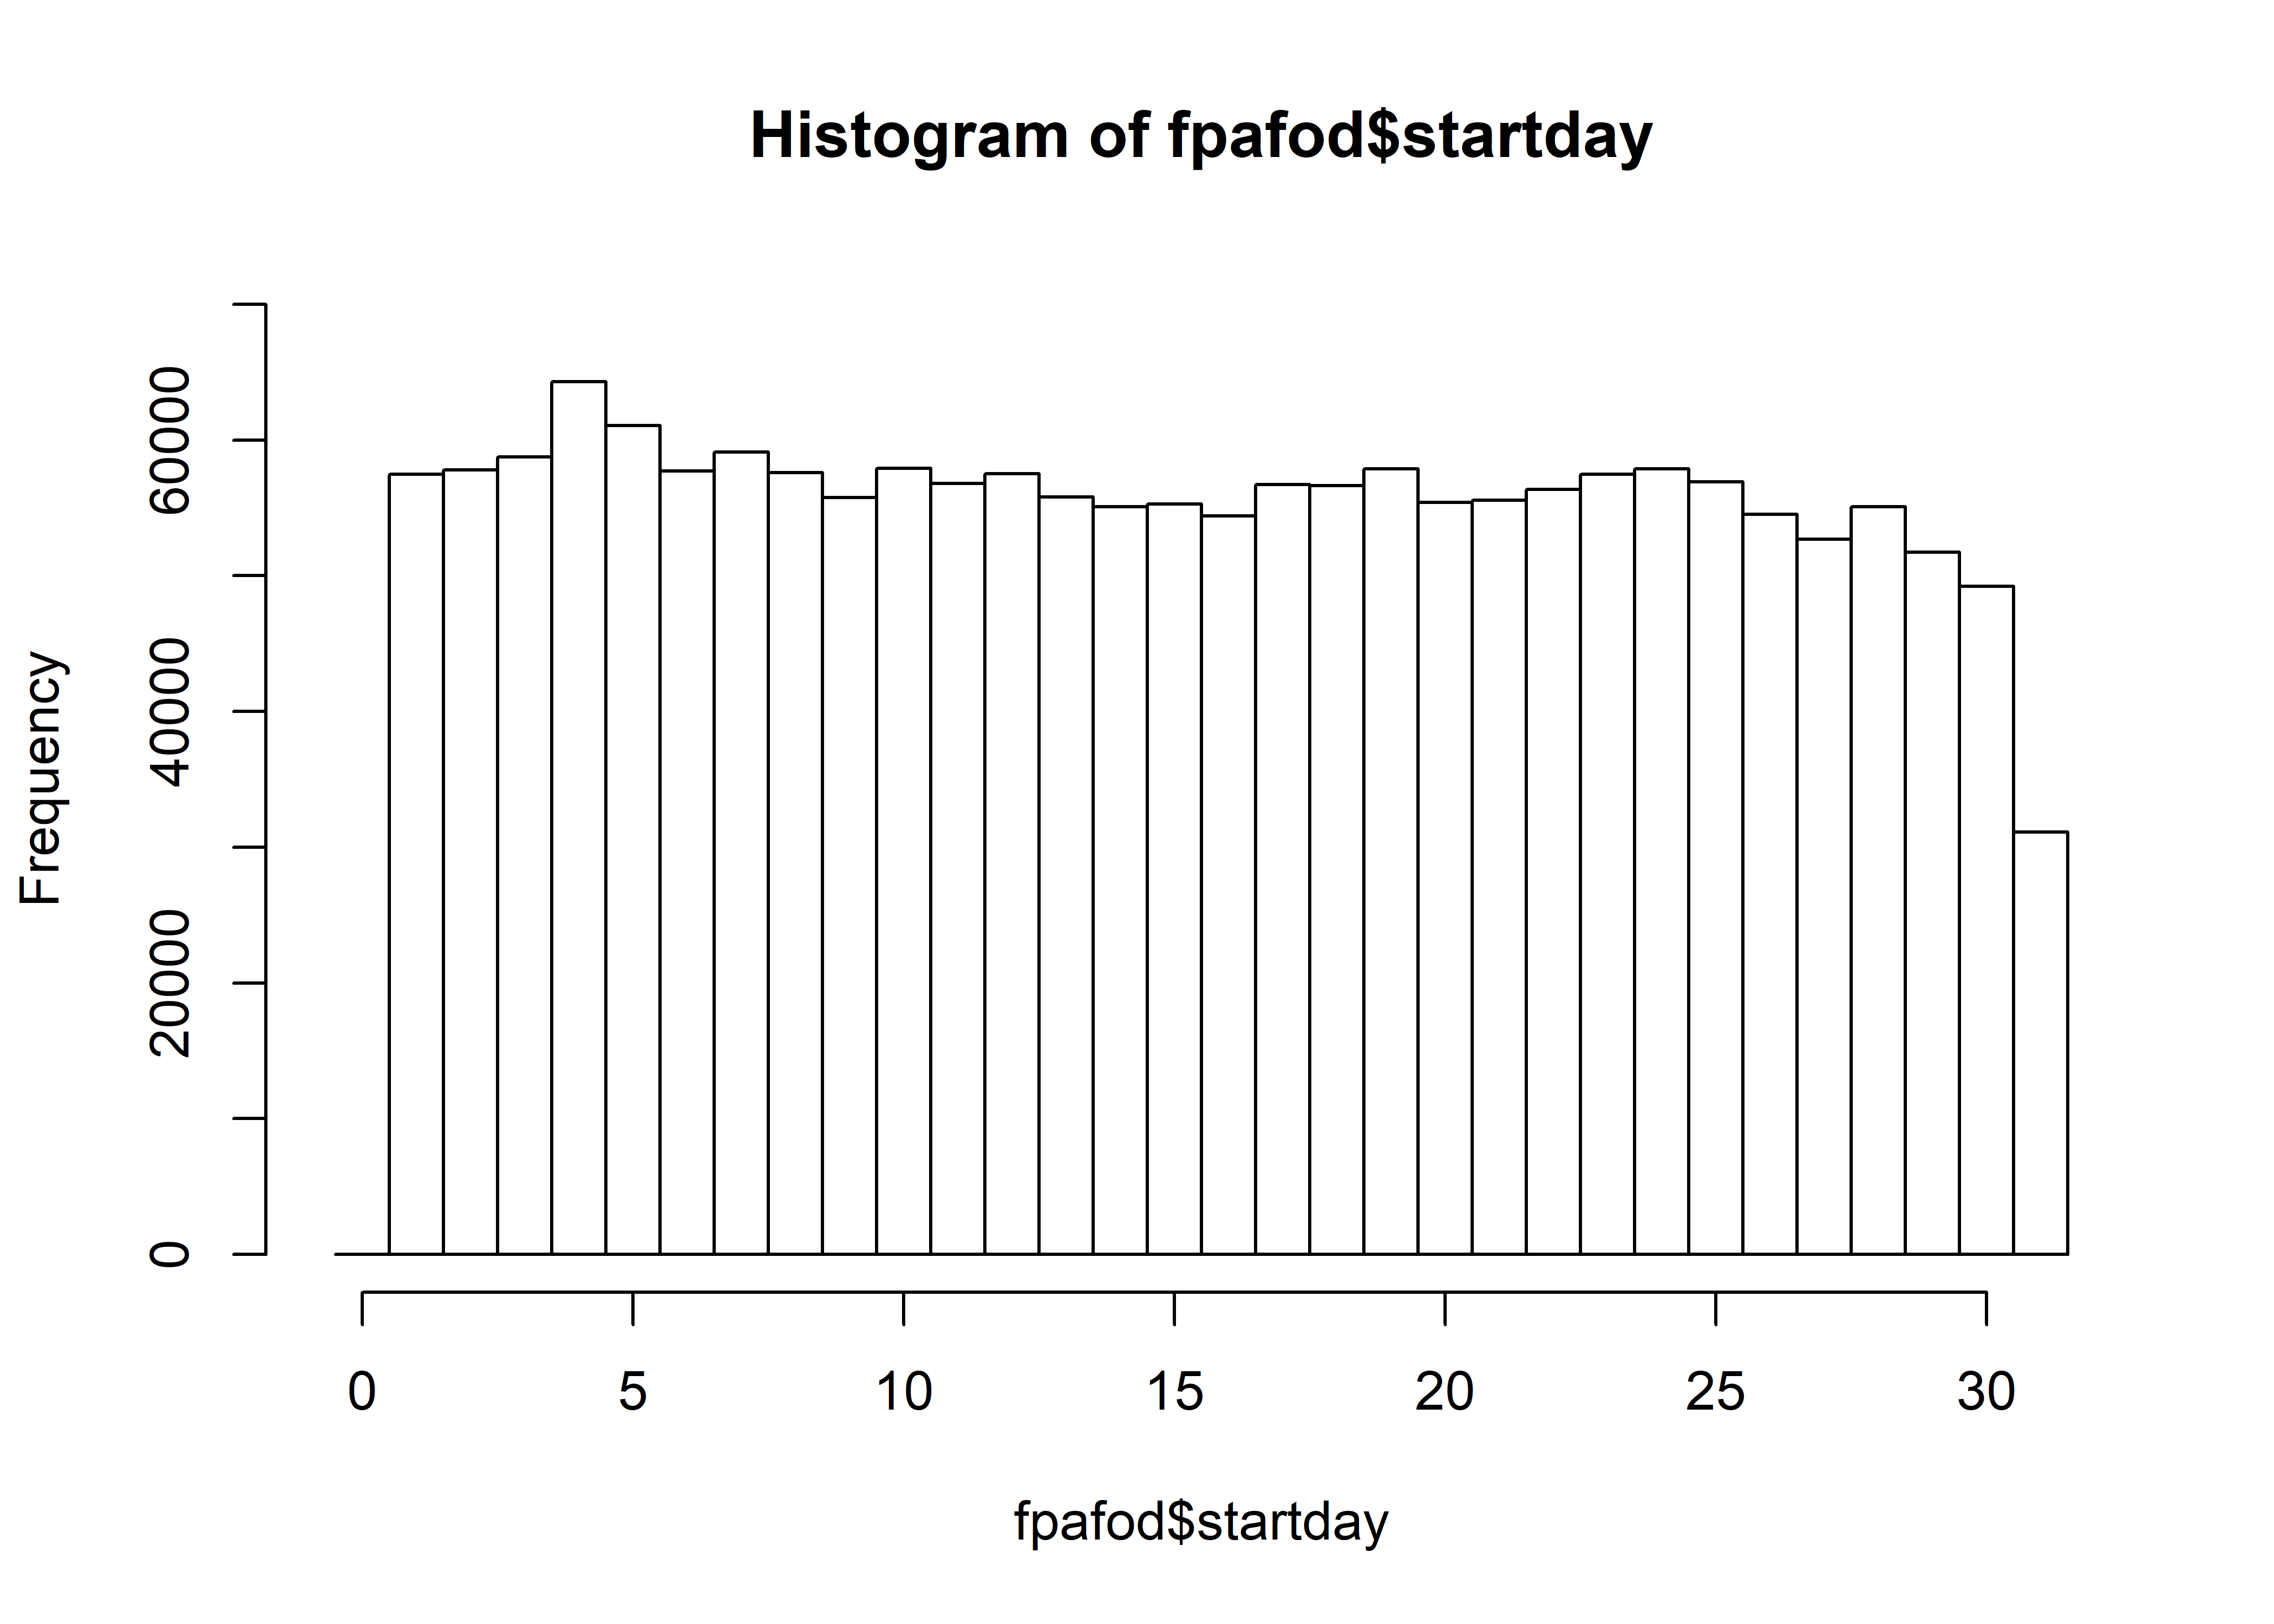
hist(fpafod$startday[fpafod$STAT_CAUSE_CODE == 1], breaks=seq(-0.5,31.5,by=1), freq=-TRUE,
  ylim=c(0,70000), main="startday (Lighting)")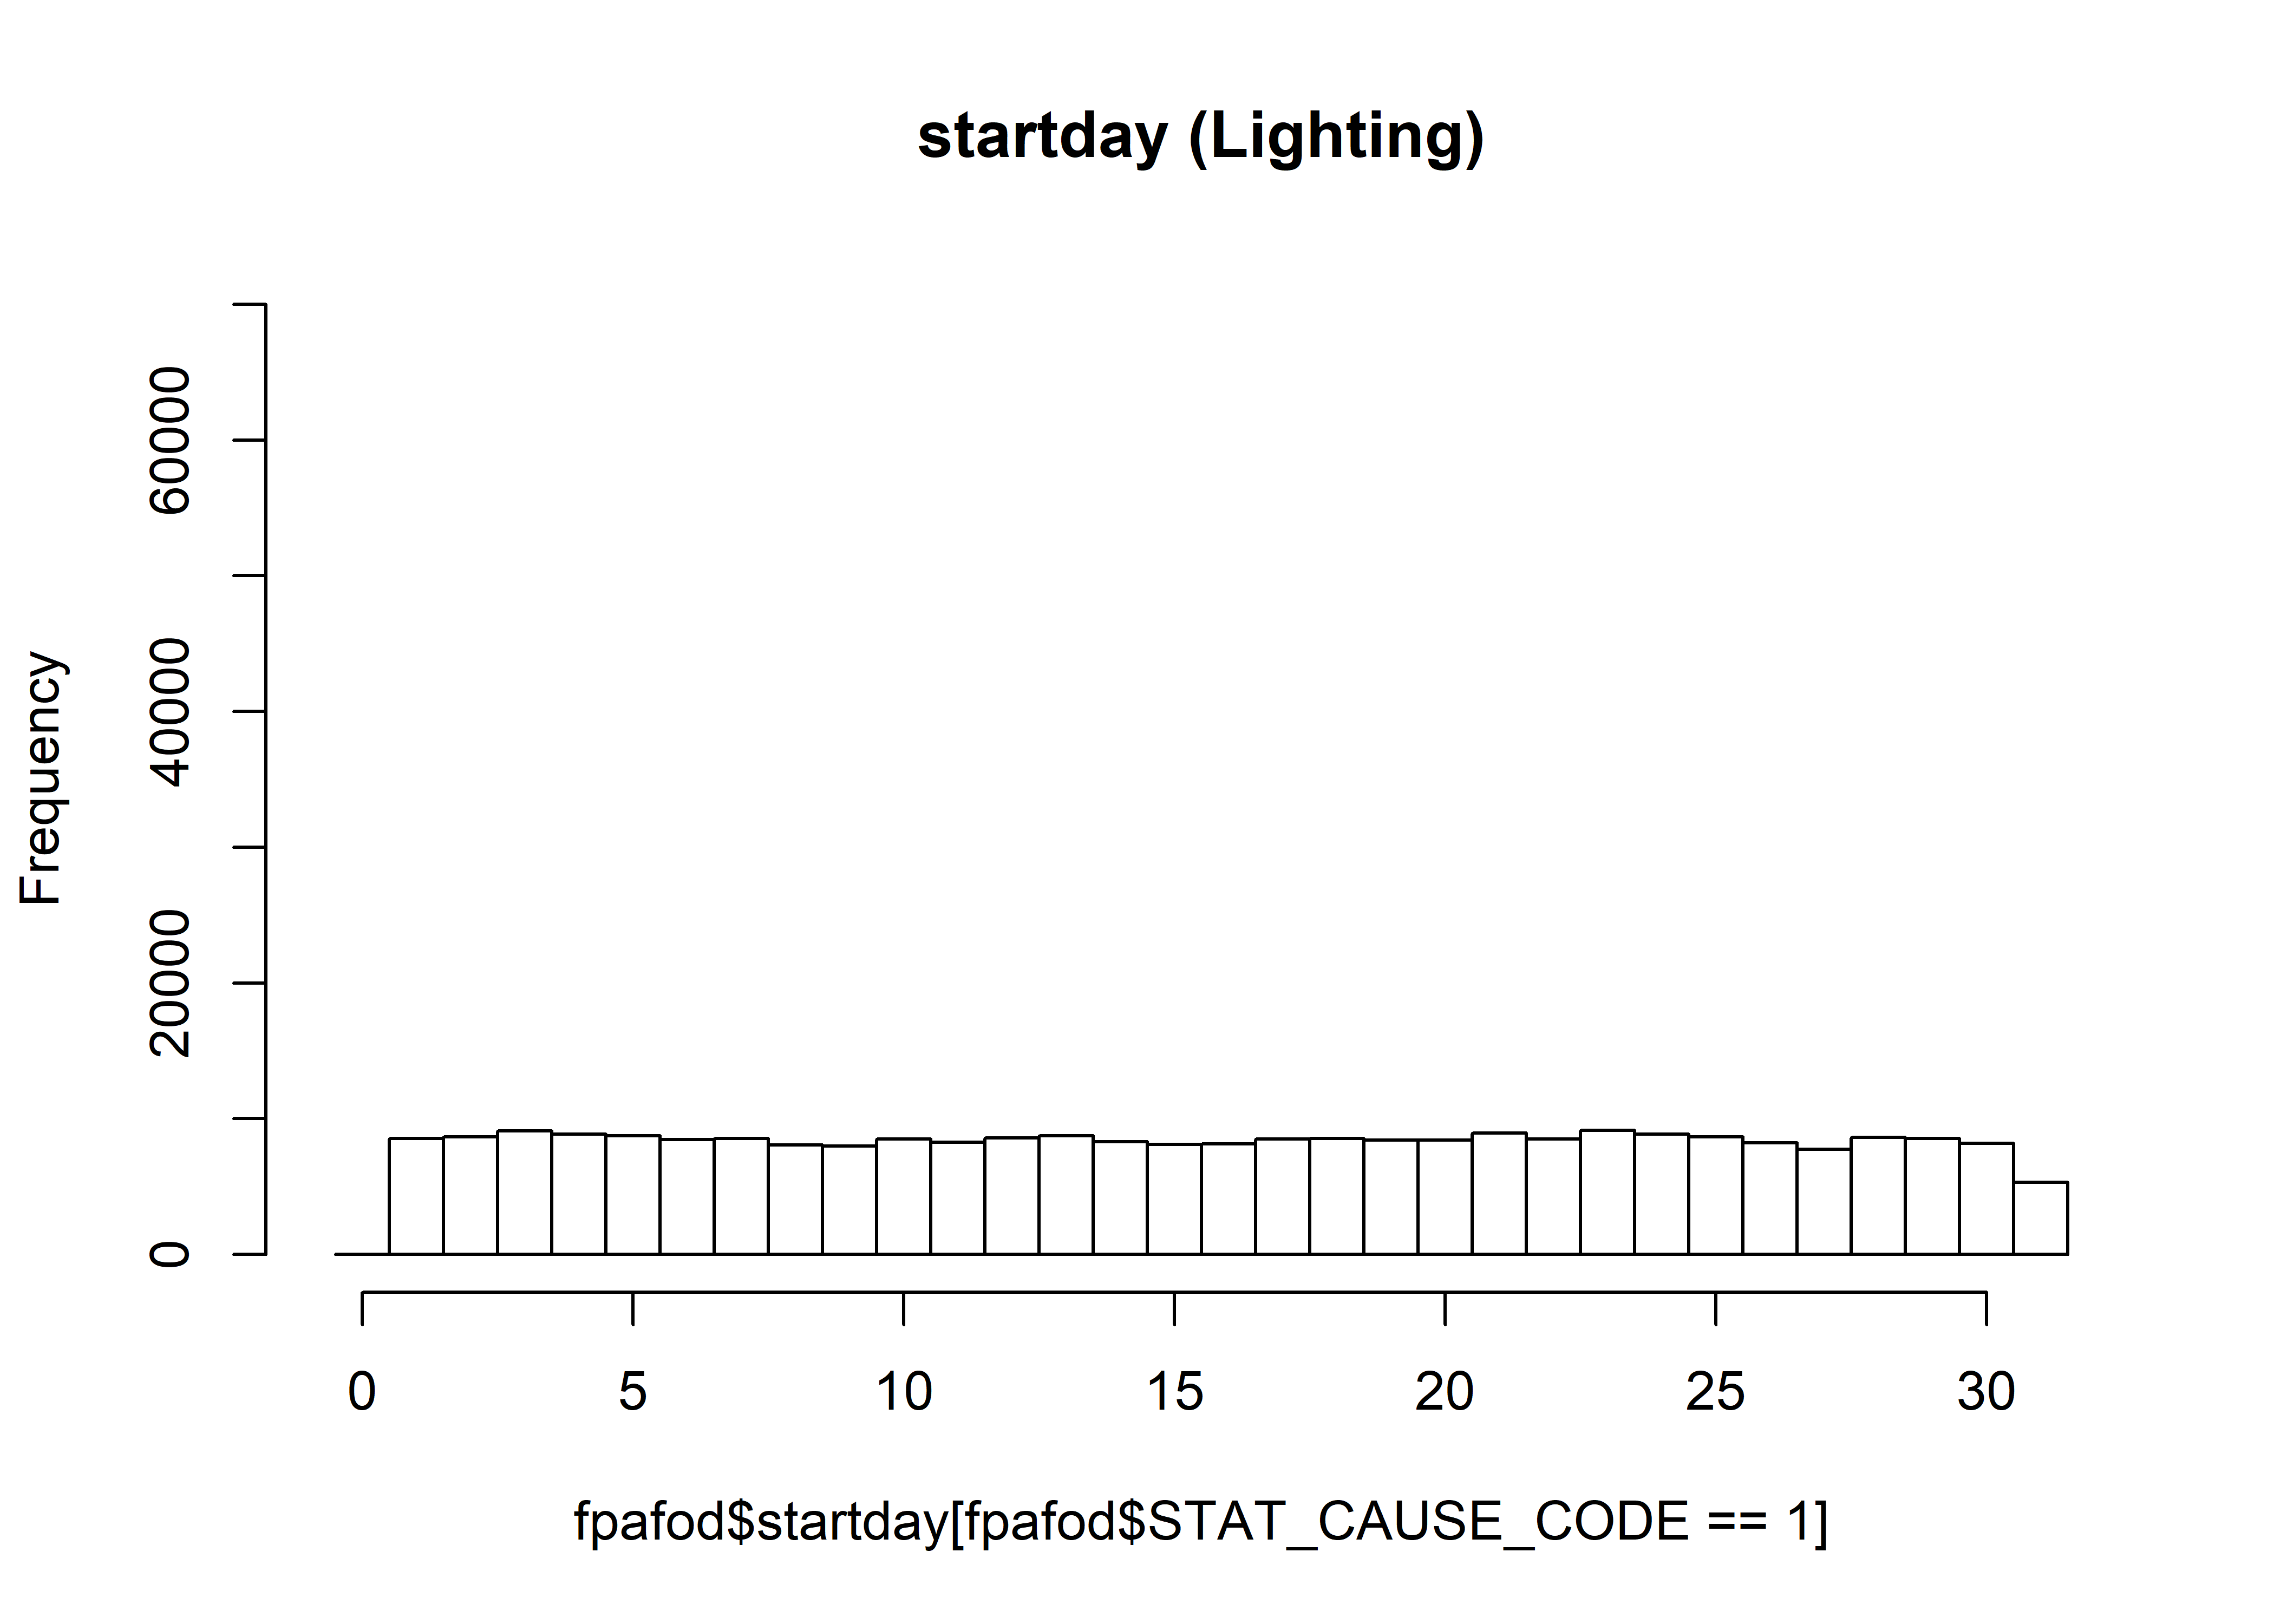
hist(fpafod$startday[fpafod$STAT_CAUSE_CODE > 1], breaks=seq(-0.5,31.5,by=1), freq=-TRUE,
  ylim=c(0,70000),  main="startday (Human)")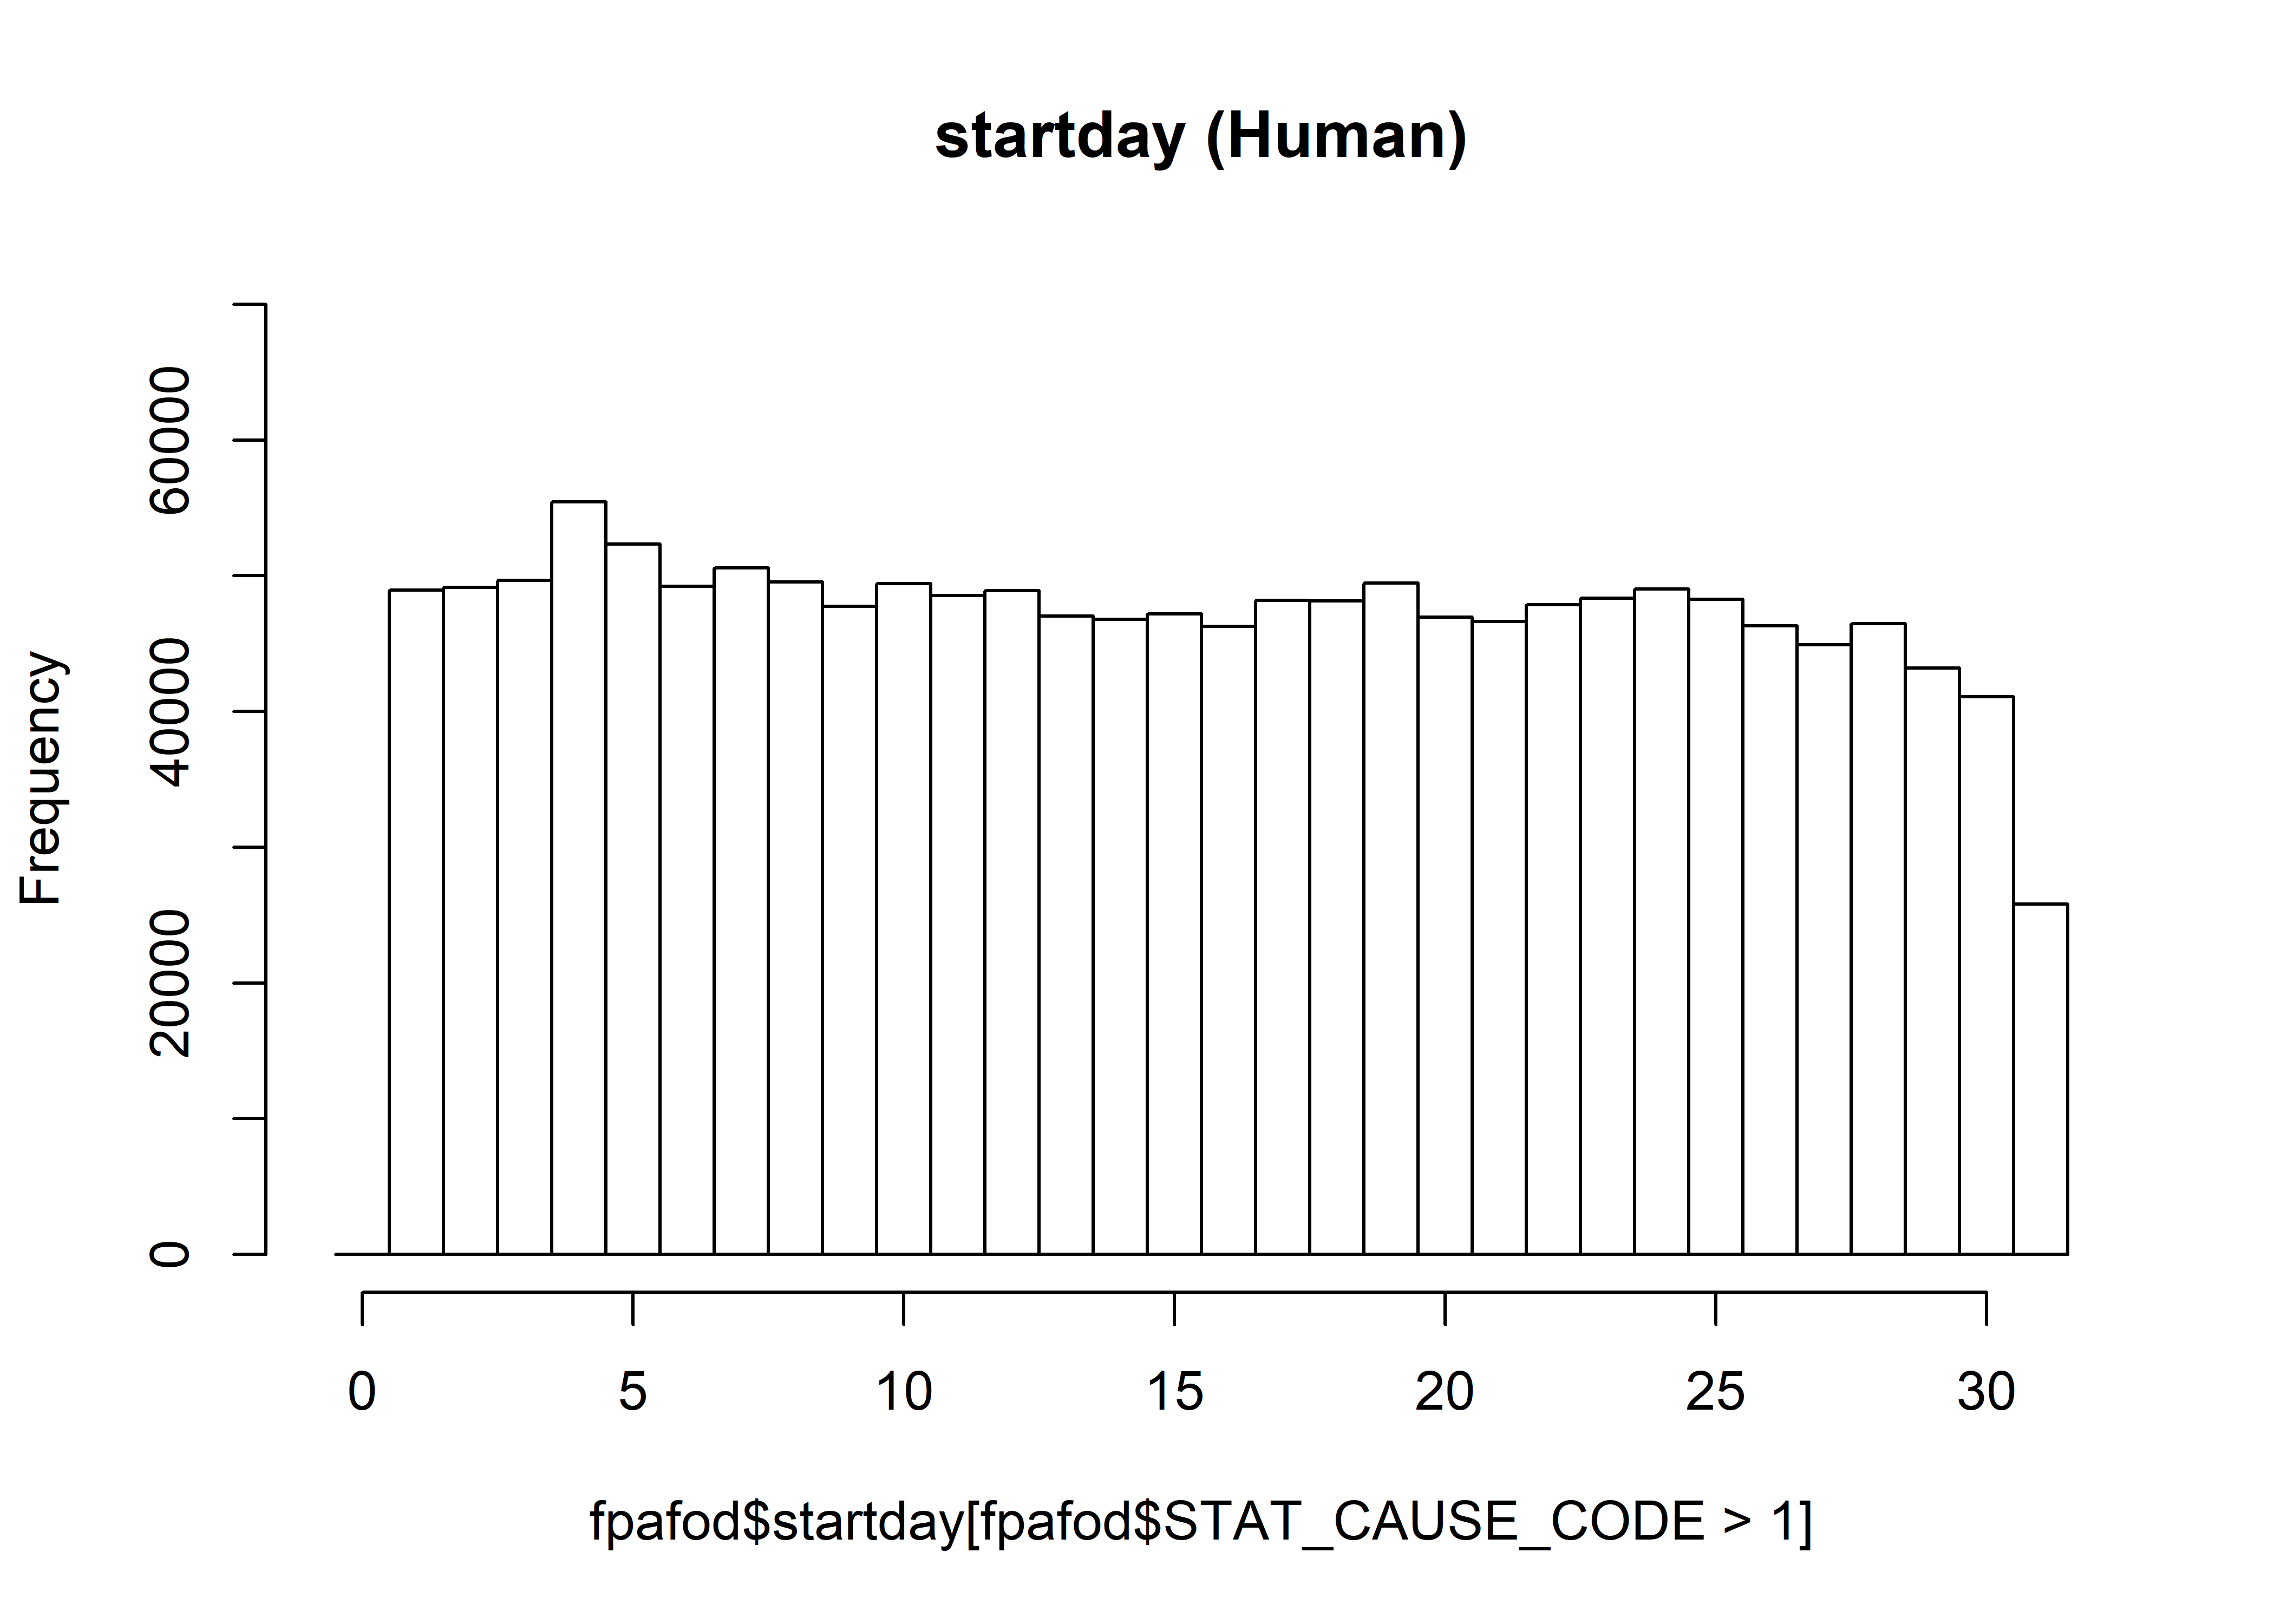
1.3.4 Mosaic plots
Mosaic plots, showing the distribution of fires by month and year.
fpafod.tablemon <- table(fpafod$FIRE_YEAR, fpafod$startmon)
mosaicplot(fpafod.tablemon, color=monthcolors, cex.axis=0.6, las=3, main="All Fires")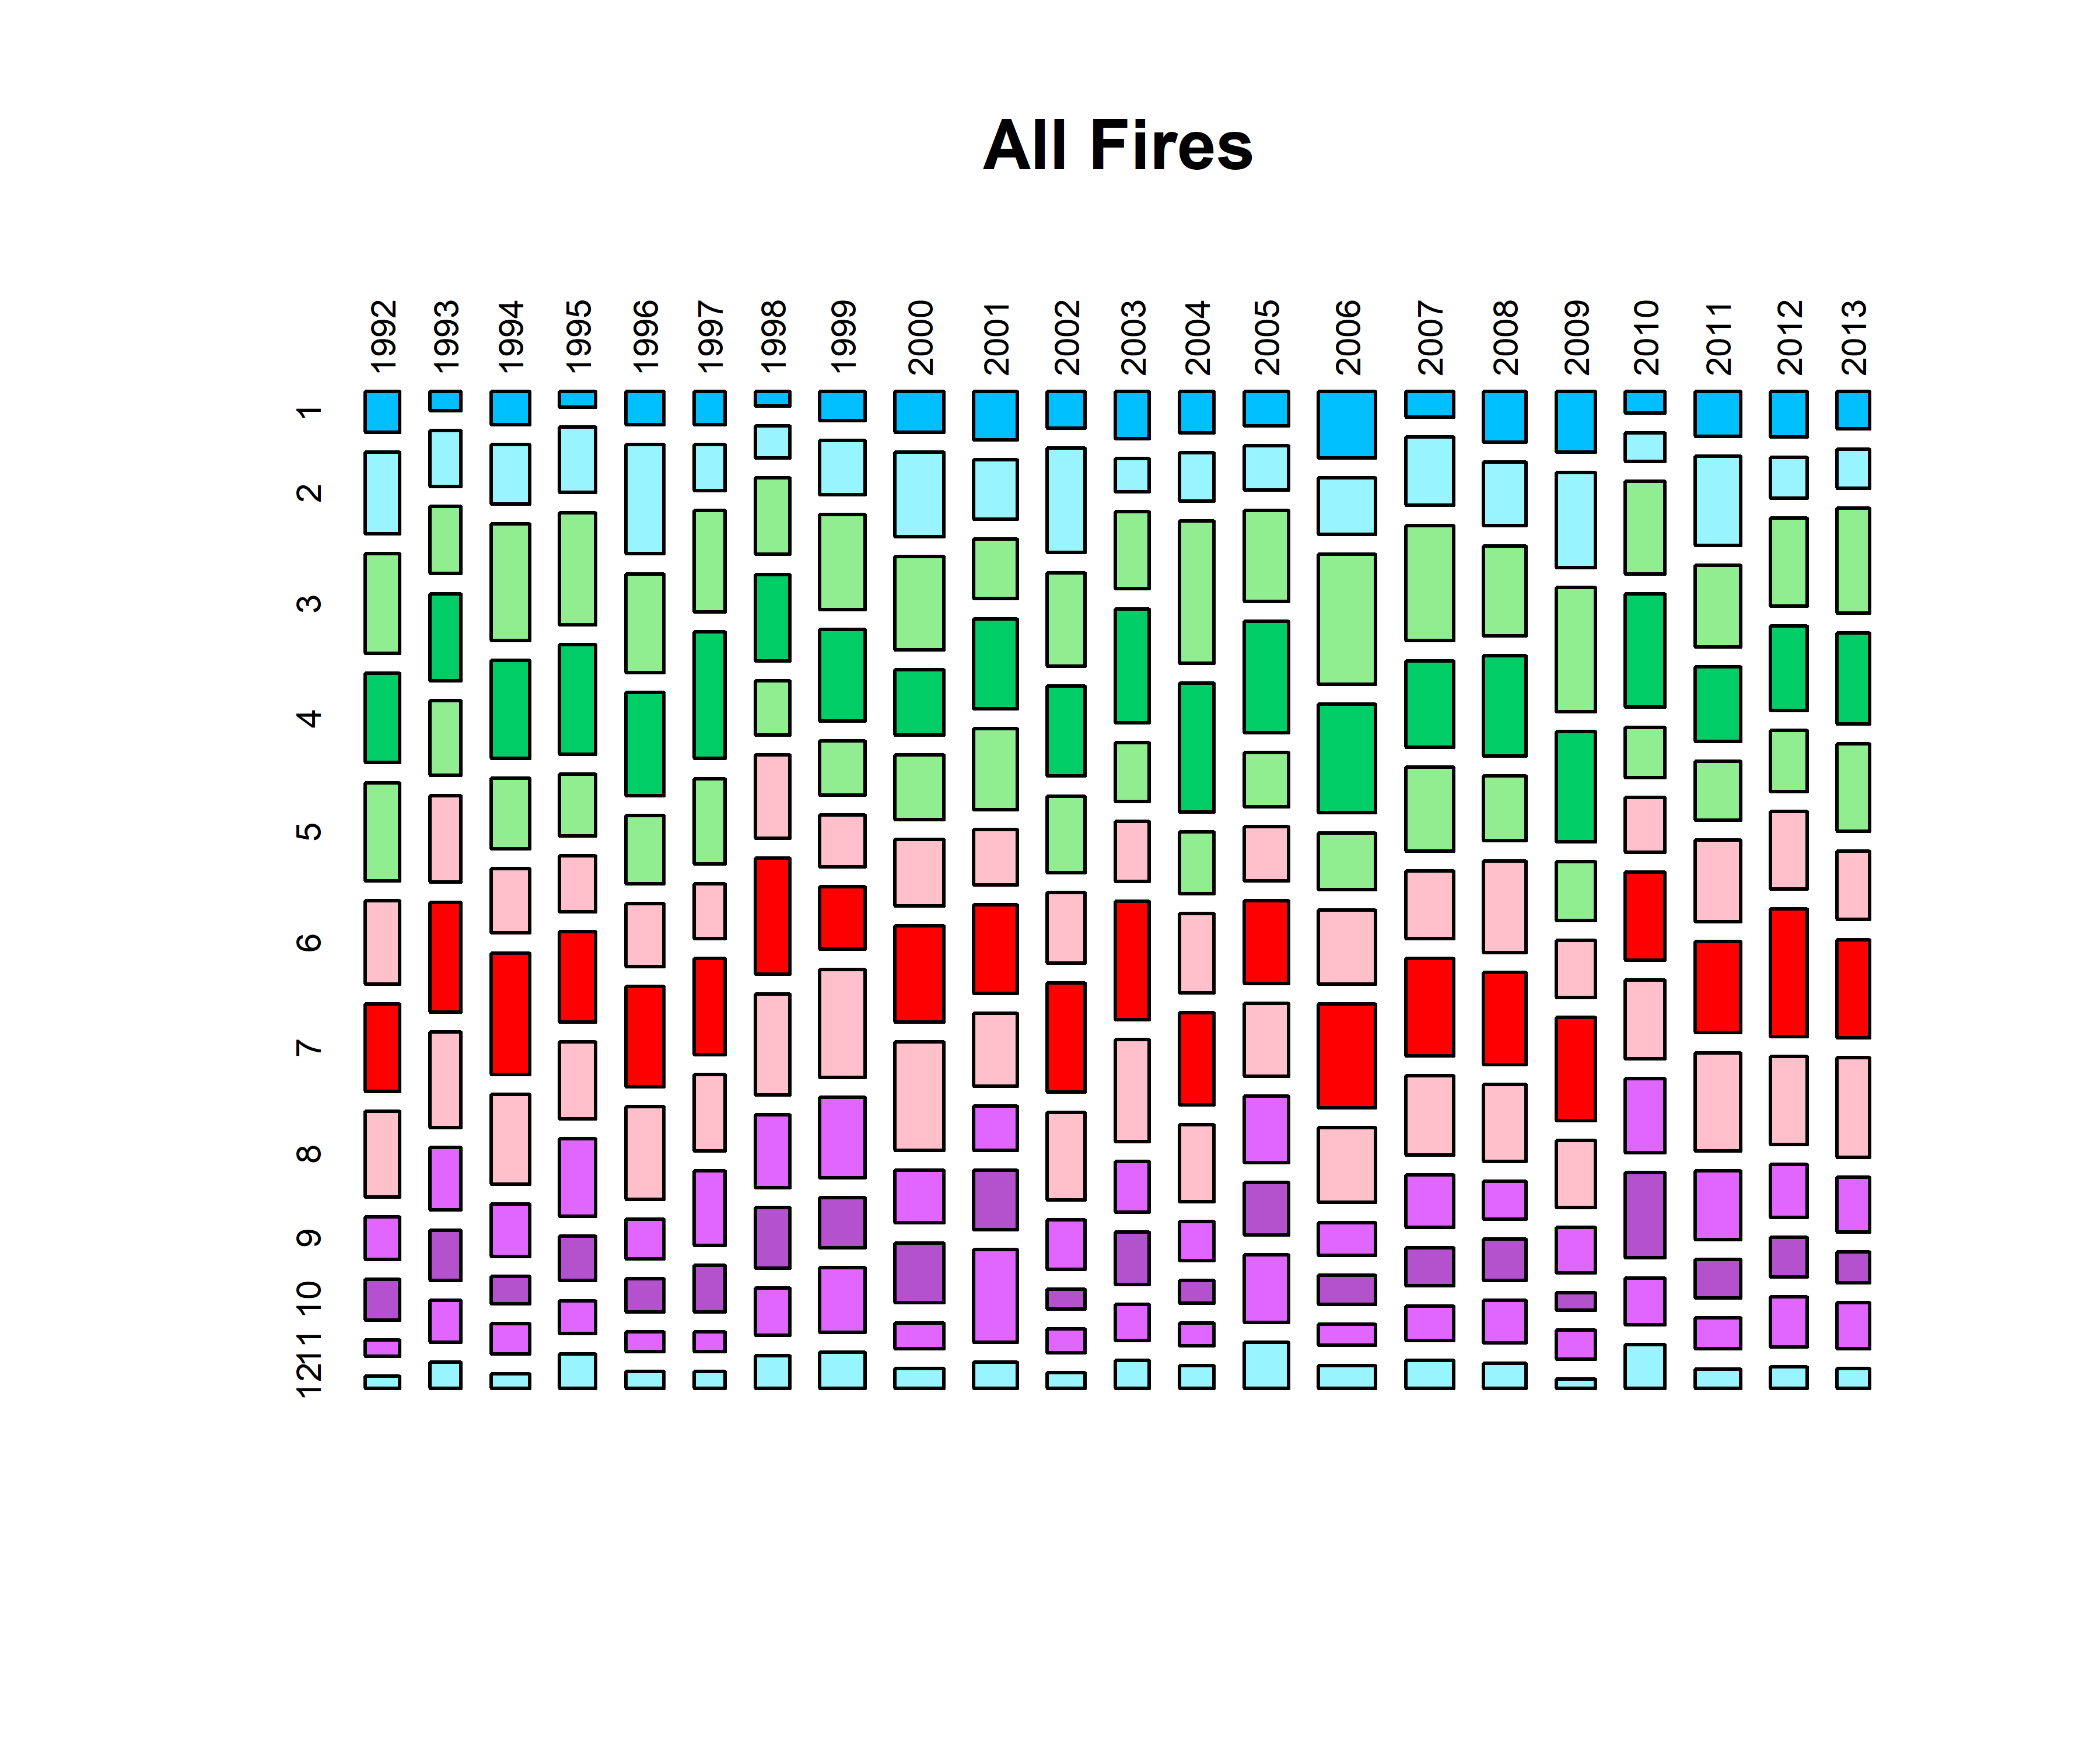
fpafod.tablemon.n <- table(fpafod$FIRE_YEAR[fpafod$STAT_CAUSE_CODE == 1],
  fpafod$startmon[fpafod$STAT_CAUSE_CODE == 1])
mosaicplot(fpafod.tablemon.n, color=monthcolors, cex.axis=0.6, las=3, main="Natural Fires")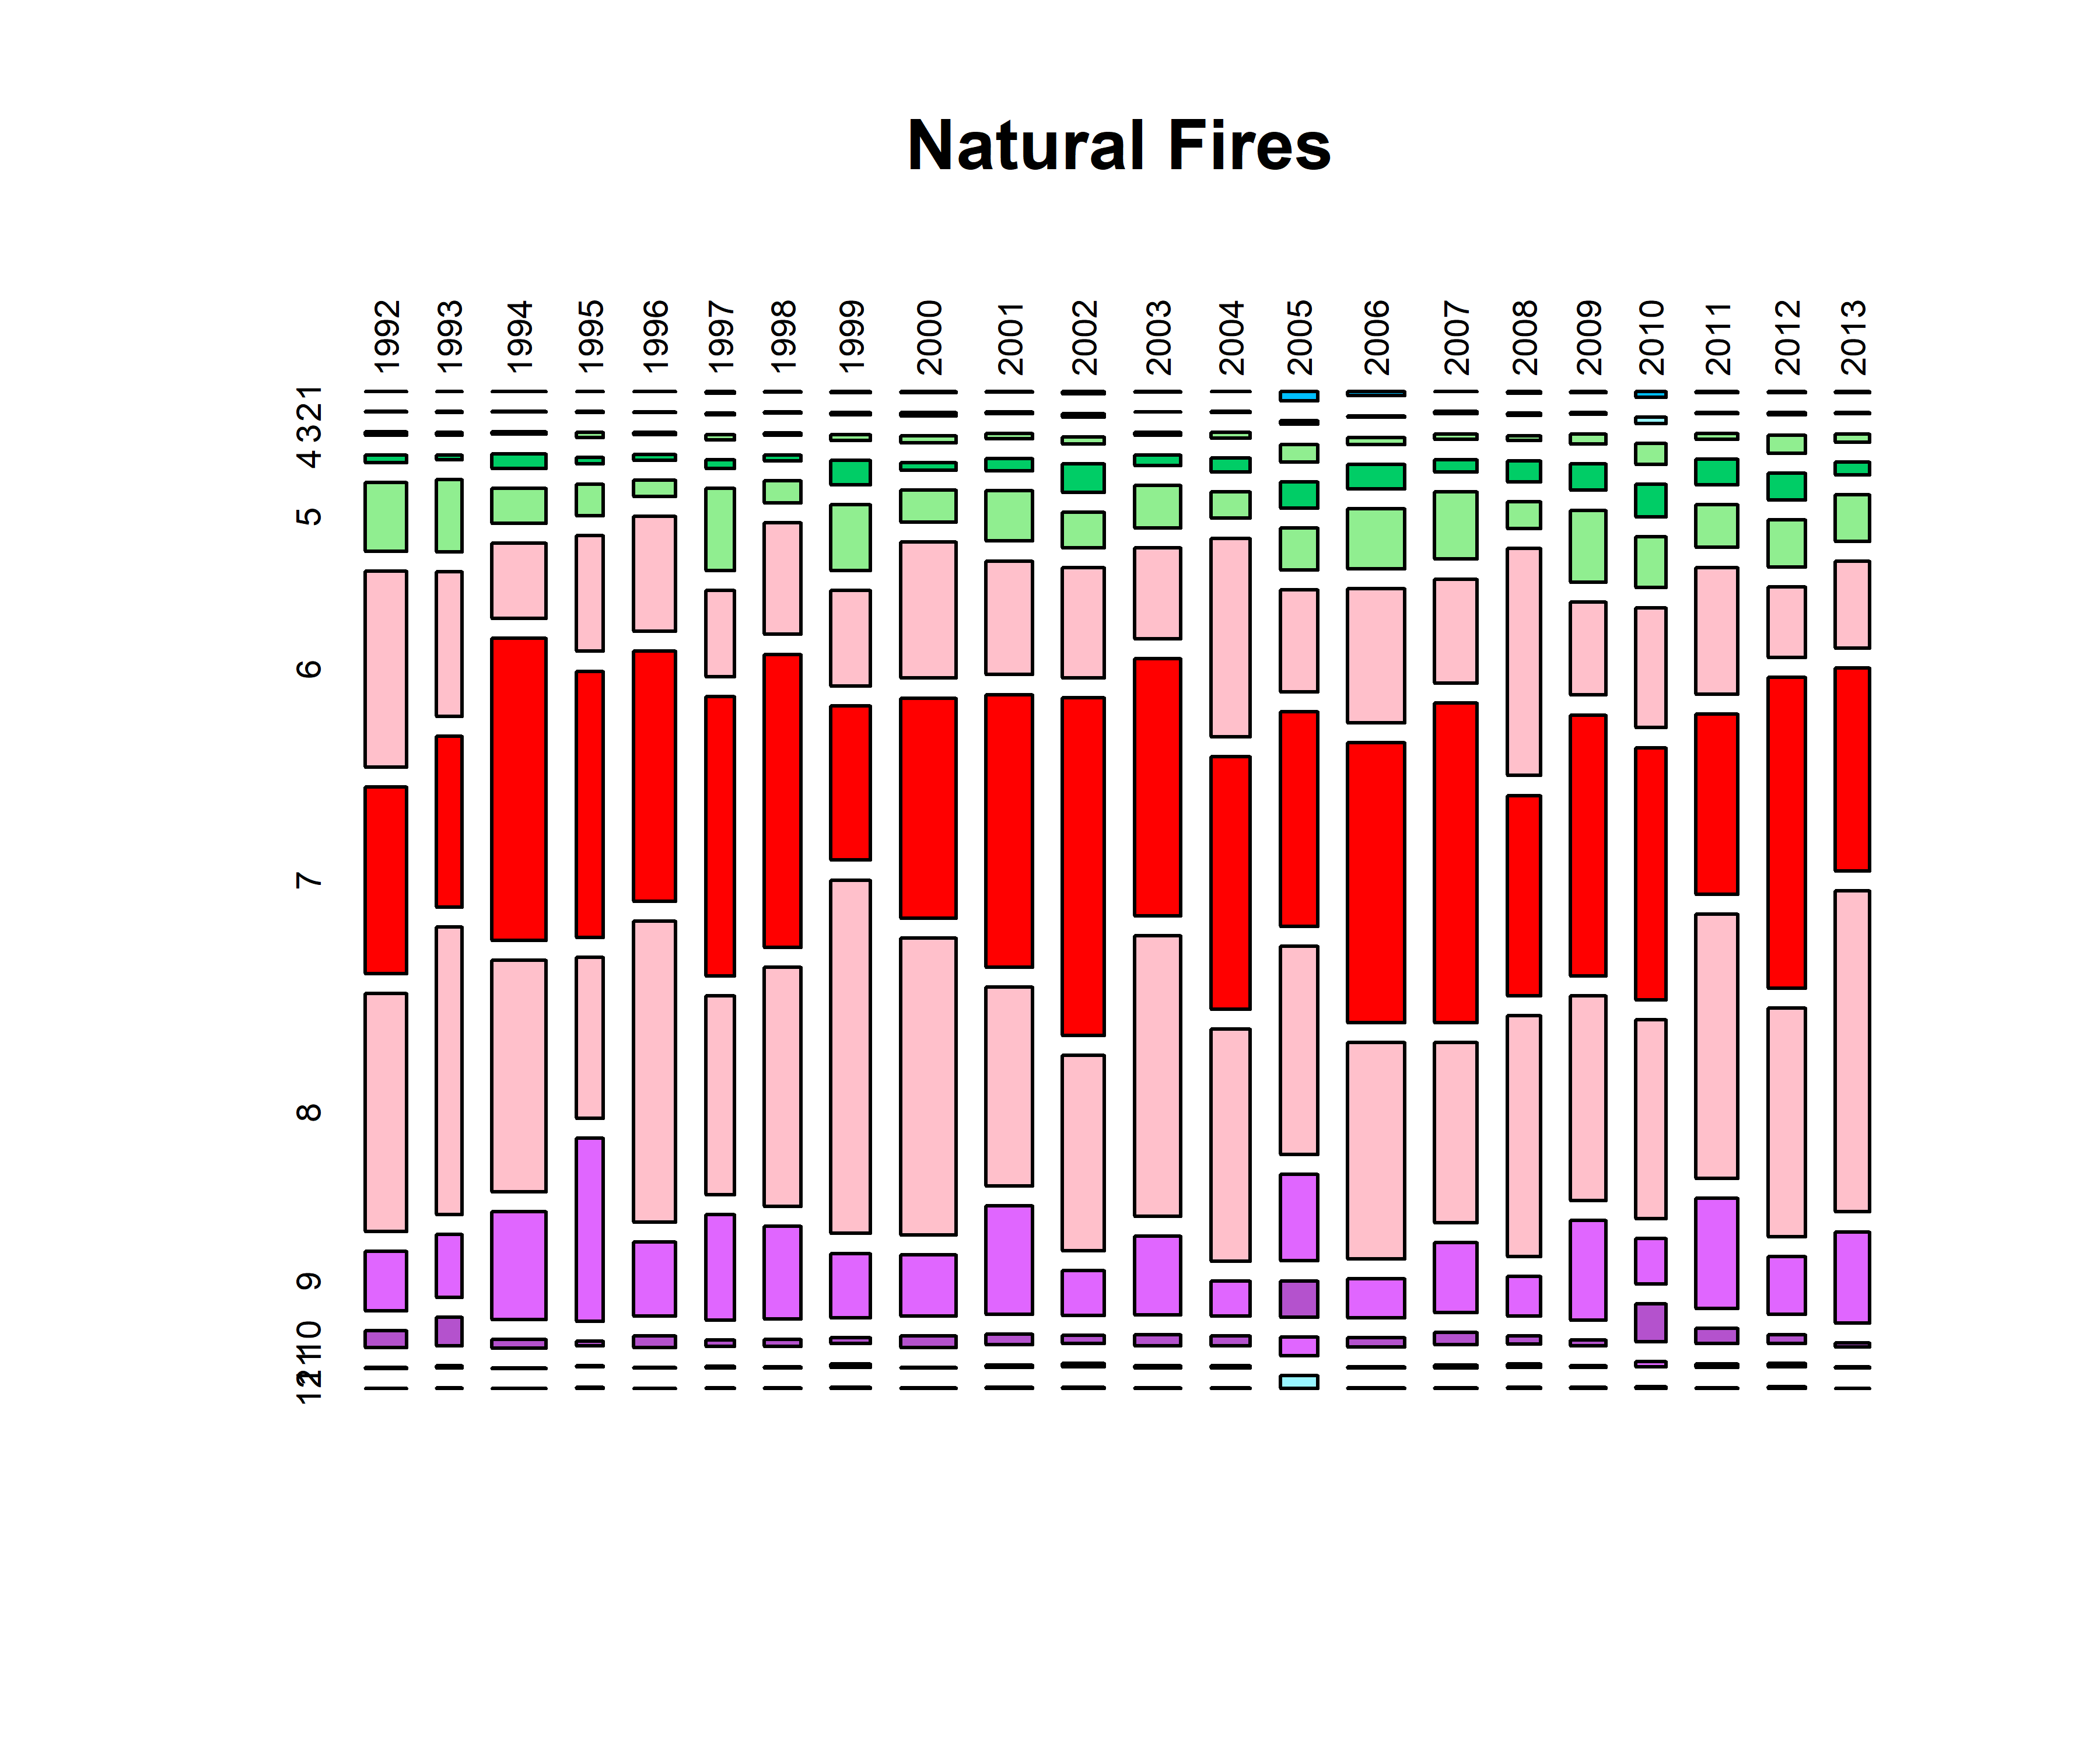
fpafod.tablemon.h <- table(fpafod$FIRE_YEAR[fpafod$STAT_CAUSE_CODE > 1],
  fpafod$startmon[fpafod$STAT_CAUSE_CODE > 1])
mosaicplot(fpafod.tablemon.h, color=monthcolors, cex.axis=0.6, las=3, main="Human Fires")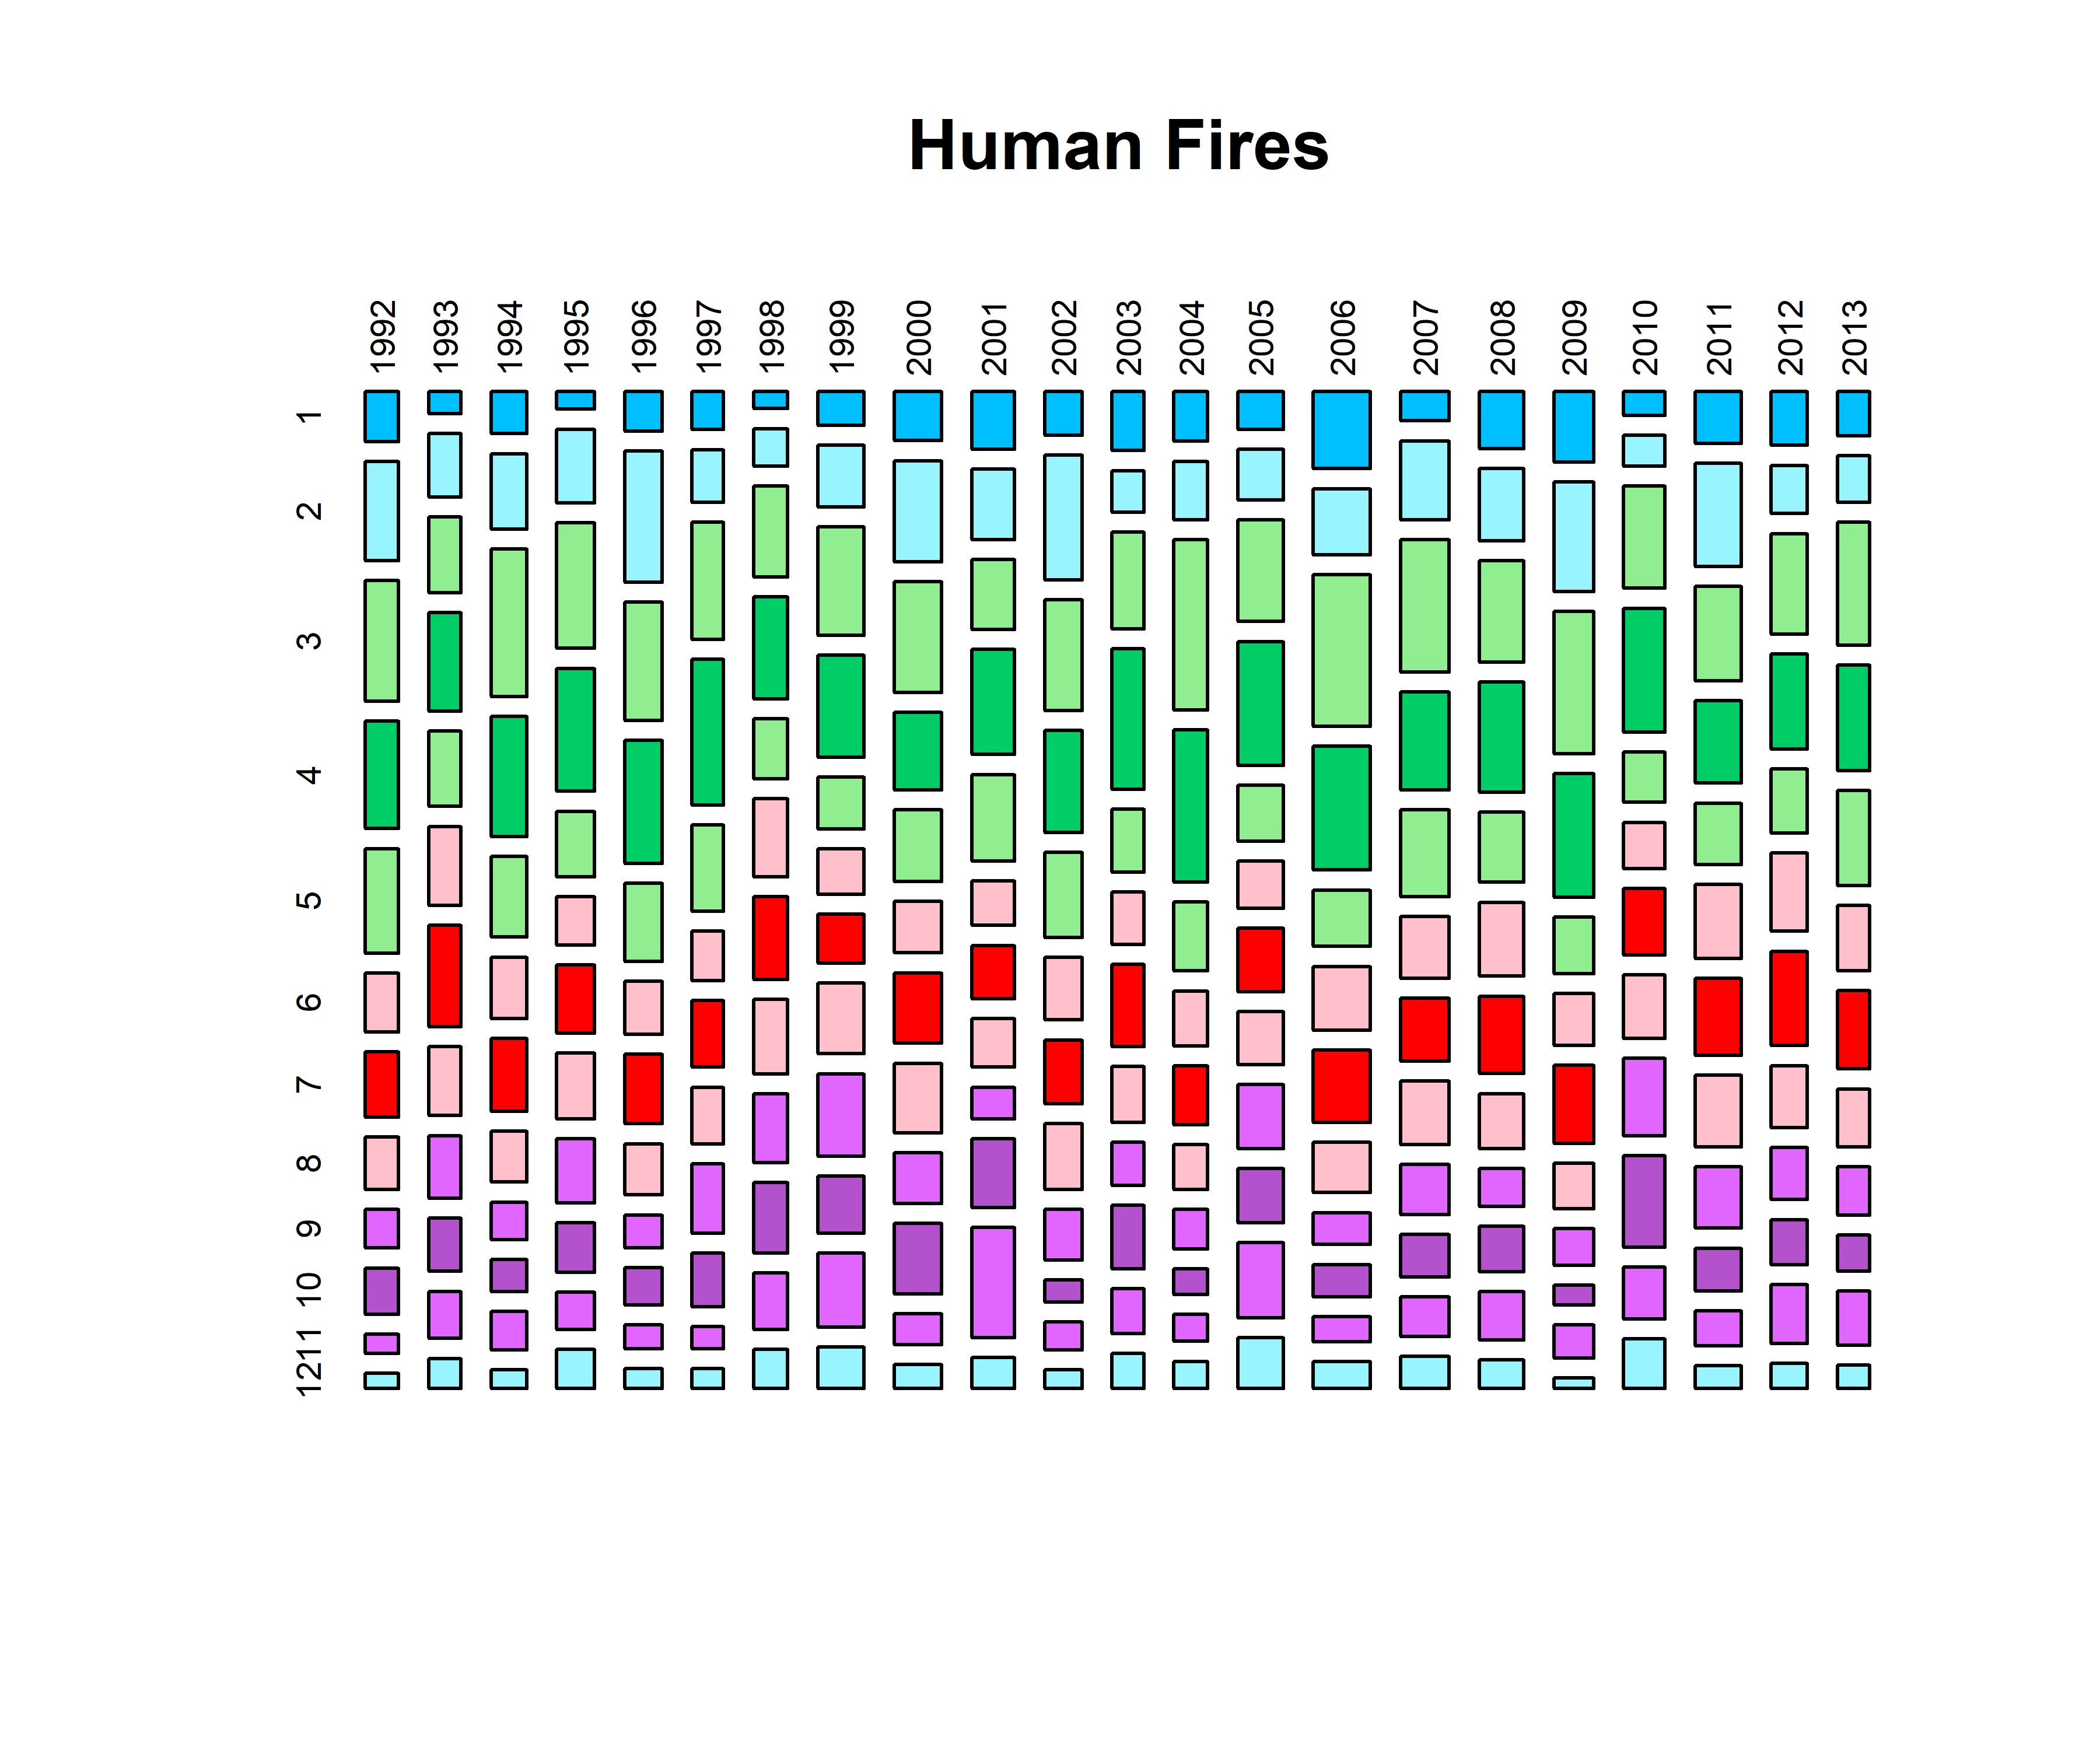
fpafod.tablecause <- table(fpafod$FIRE_YEAR, fpafod$NWCG_REPORTING_AGENCY)
mosaicplot(fpafod.tablecause, cex.axis=0.6, las=2, color=mosaiccolor, main="Fires by Organization")
# 1 Lightning; 2 Equipment Use; 3 Smoking; 4 Campfire; 5 Debris Burning; 6 Railroad; 7 Arson; 8 Children;
# 9 Miscellaneous; 10 Fireworks; 11 Power Line; 12 Structure; 13 Missing/Undefined
fpafod.tablecause <- table(fpafod$FIRE_YEAR, fpafod$STAT_CAUSE_CODE)
mosaicplot(fpafod.tablecause, cex.axis=0.6, las=2, color=mosaiccolor, main="Fires by Cause")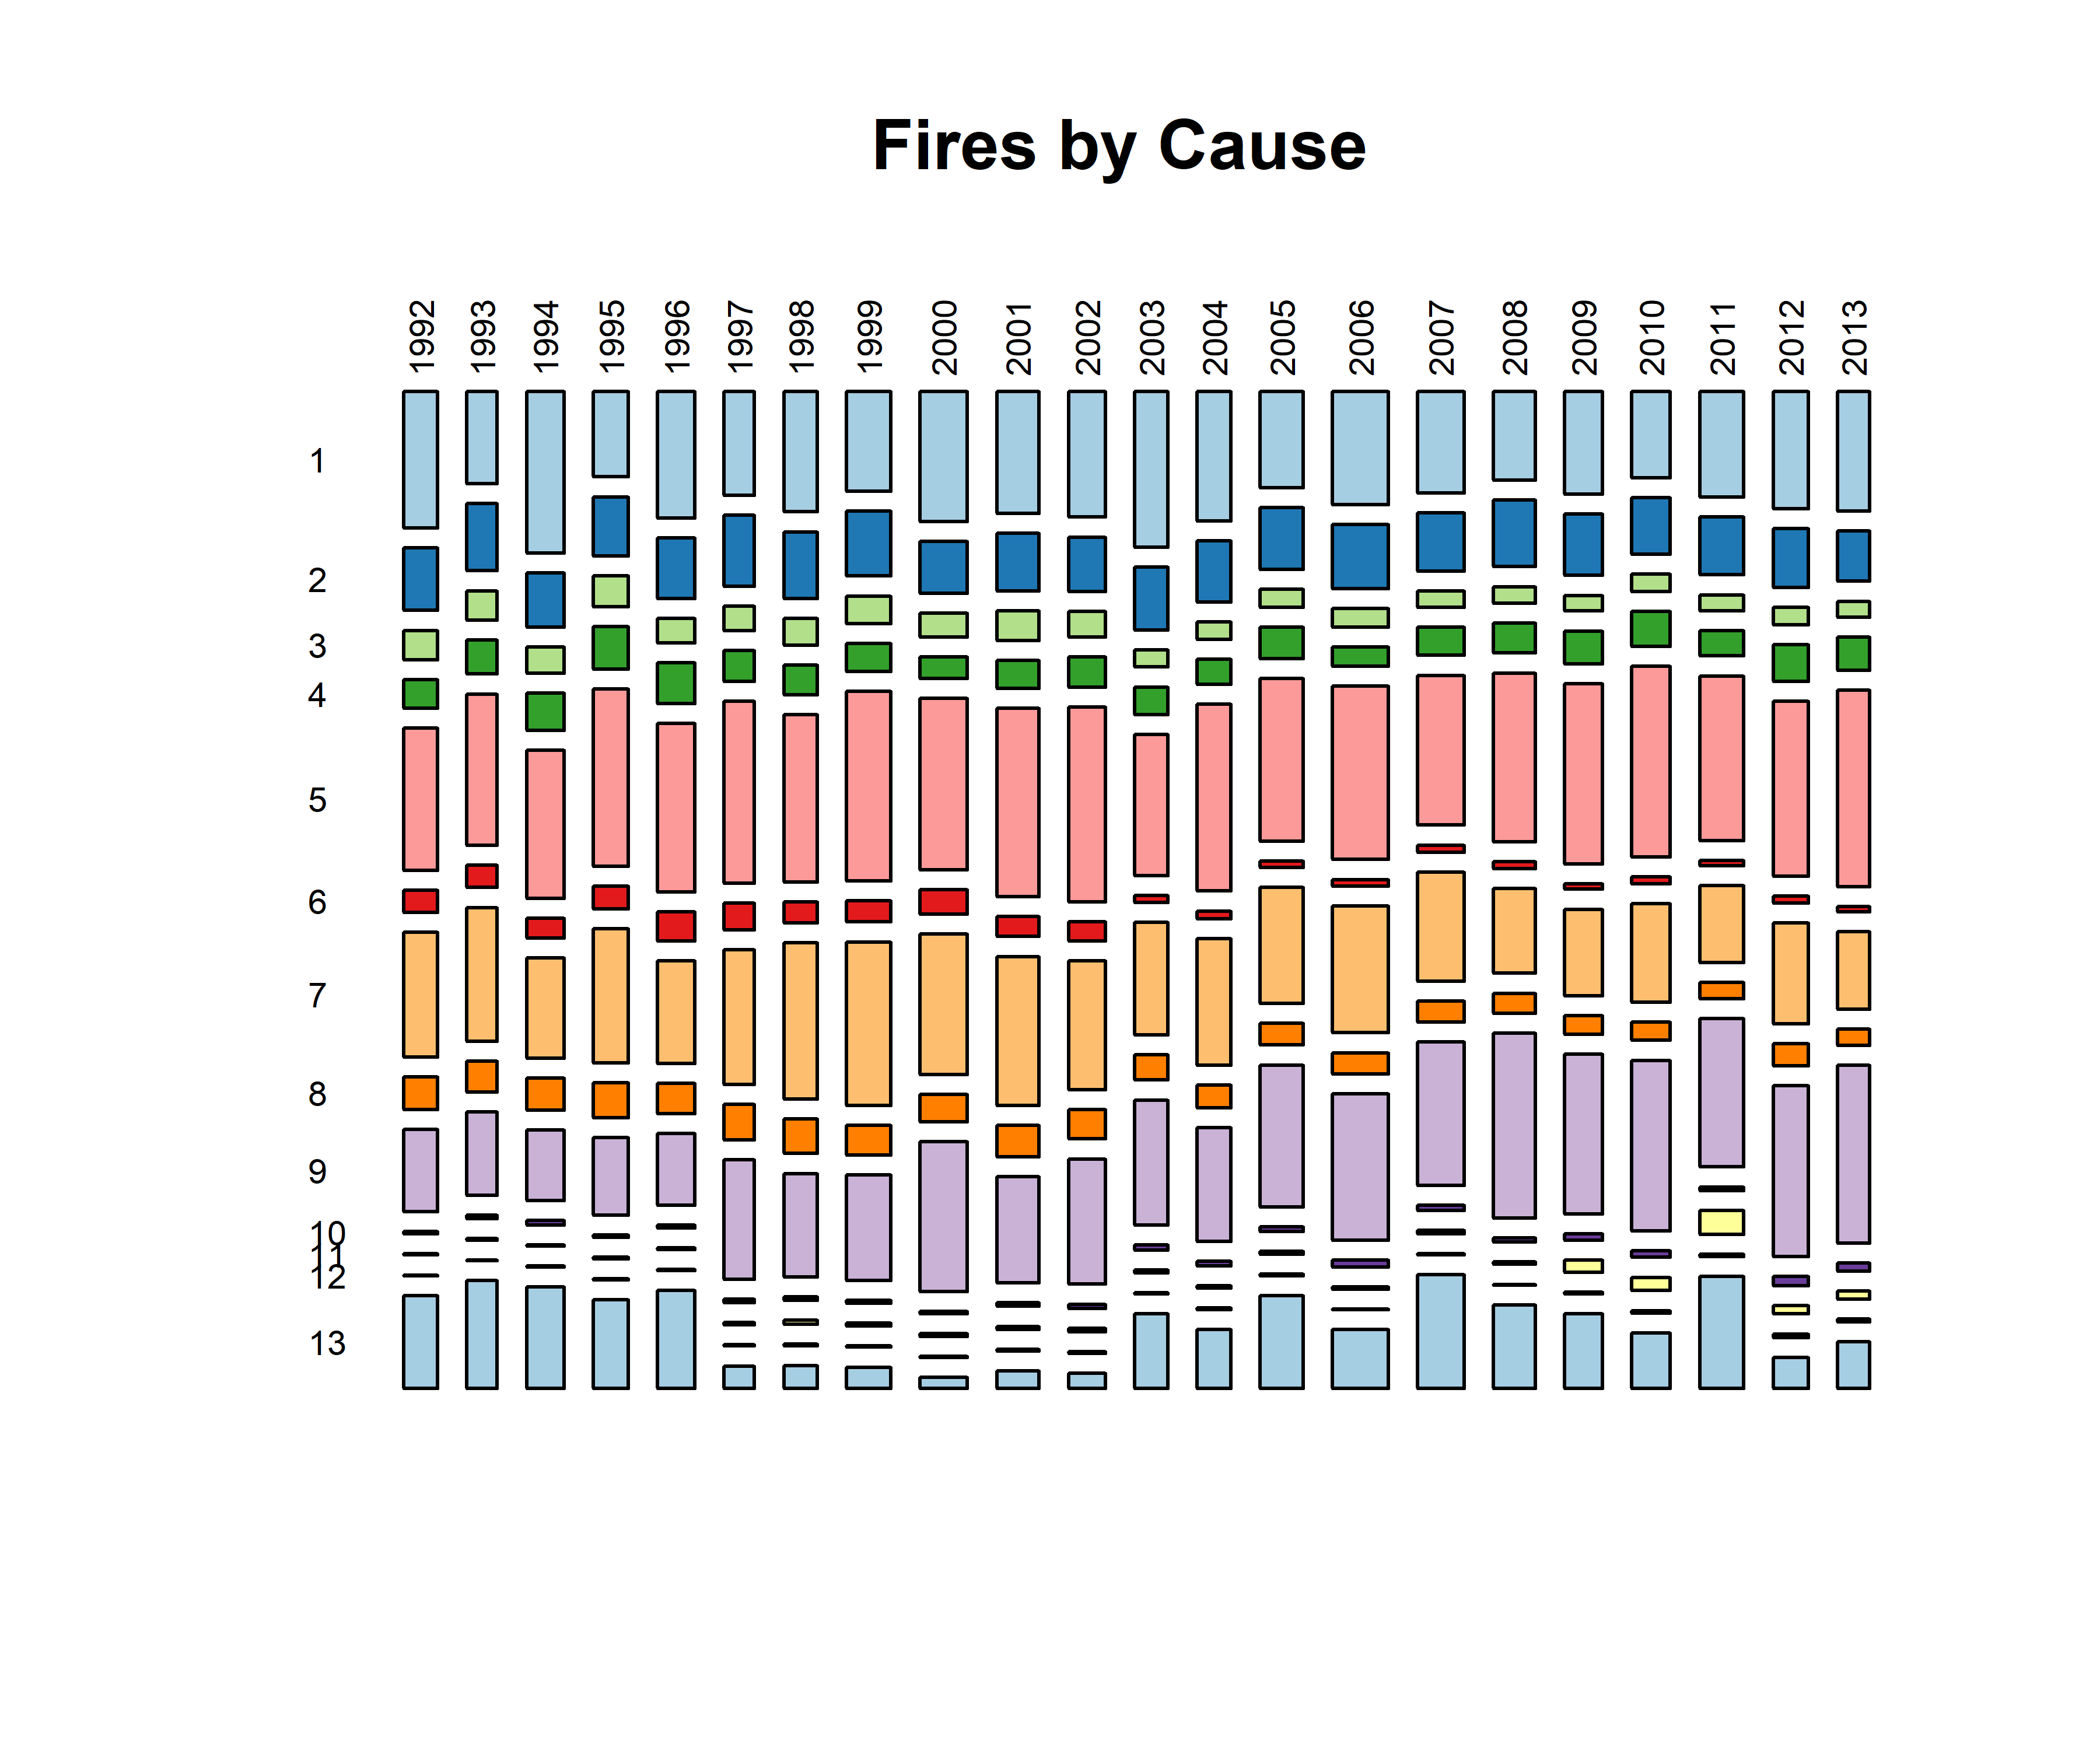
# 1 Lightning; 2 Equipment Use; 3 Smoking; 4 Campfire; 5 Debris Burning; 6 Railroad; 7 Arson; 8 Children;
# 9 Miscellaneous; 10 Fireworks; 11 Power Line; 12 Structure; 13 Missing/Undefined
fpafod.tableagencycause <- table(fpafod$NWCG_REPORTING_AGENCY, fpafod$STAT_CAUSE_CODE)
mosaicplot(fpafod.tableagencycause, cex.axis=0.6, las=2, color=mosaiccolor, main="Fires by Agency and Cause")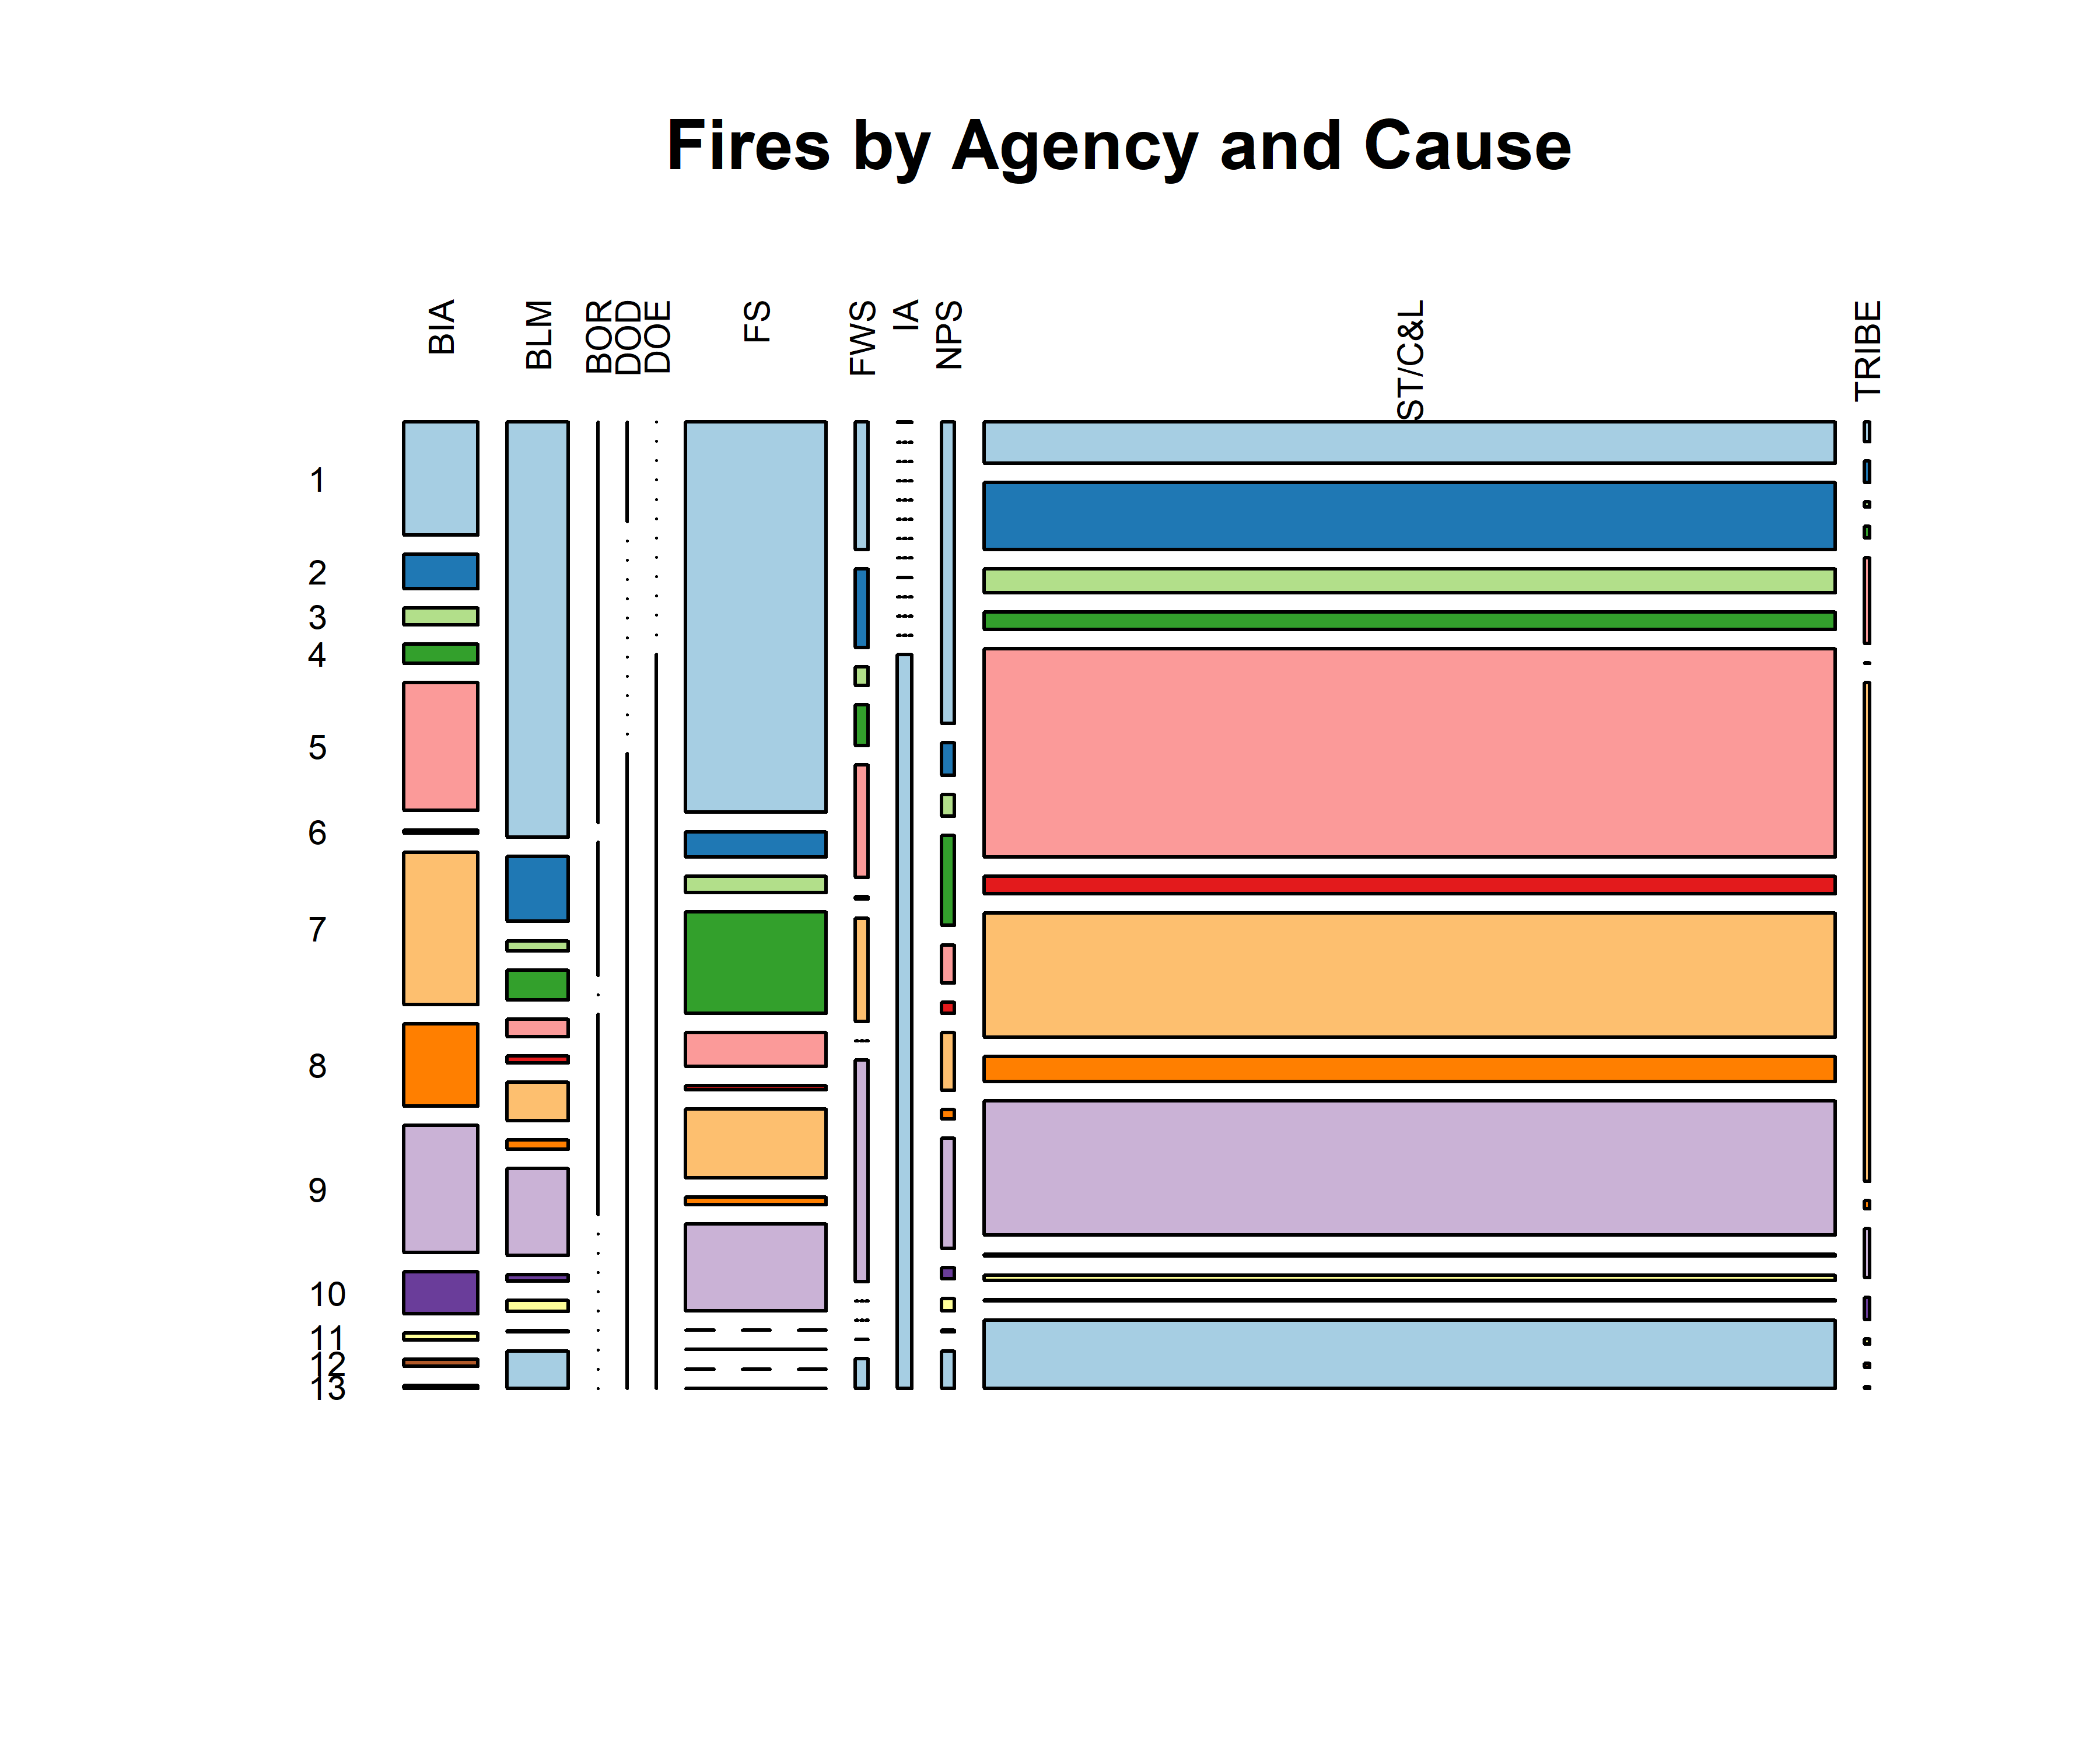
# 1 Lightning; 2 Equipment Use; 3 Smoking; 4 Campfire; 5 Debris Burning; 6 Railroad; 7 Arson; 8 Children;
# 9 Miscellaneous; 10 Fireworks; 11 Power Line; 12 Structure; 13 Missing/Undefined
fpafod.tablecause <- table(fpafod$FIRE_YEAR[fpafod$NWCG_REPORTING_AGENCY =="ST/C&L"],
  fpafod$STAT_CAUSE_CODE[fpafod$NWCG_REPORTING_AGENCY =="ST/C&L"])
mosaicplot(fpafod.tablecause, cex.axis=0.6, las=2, color=mosaiccolor, main="ST/C&L Fires by Cause")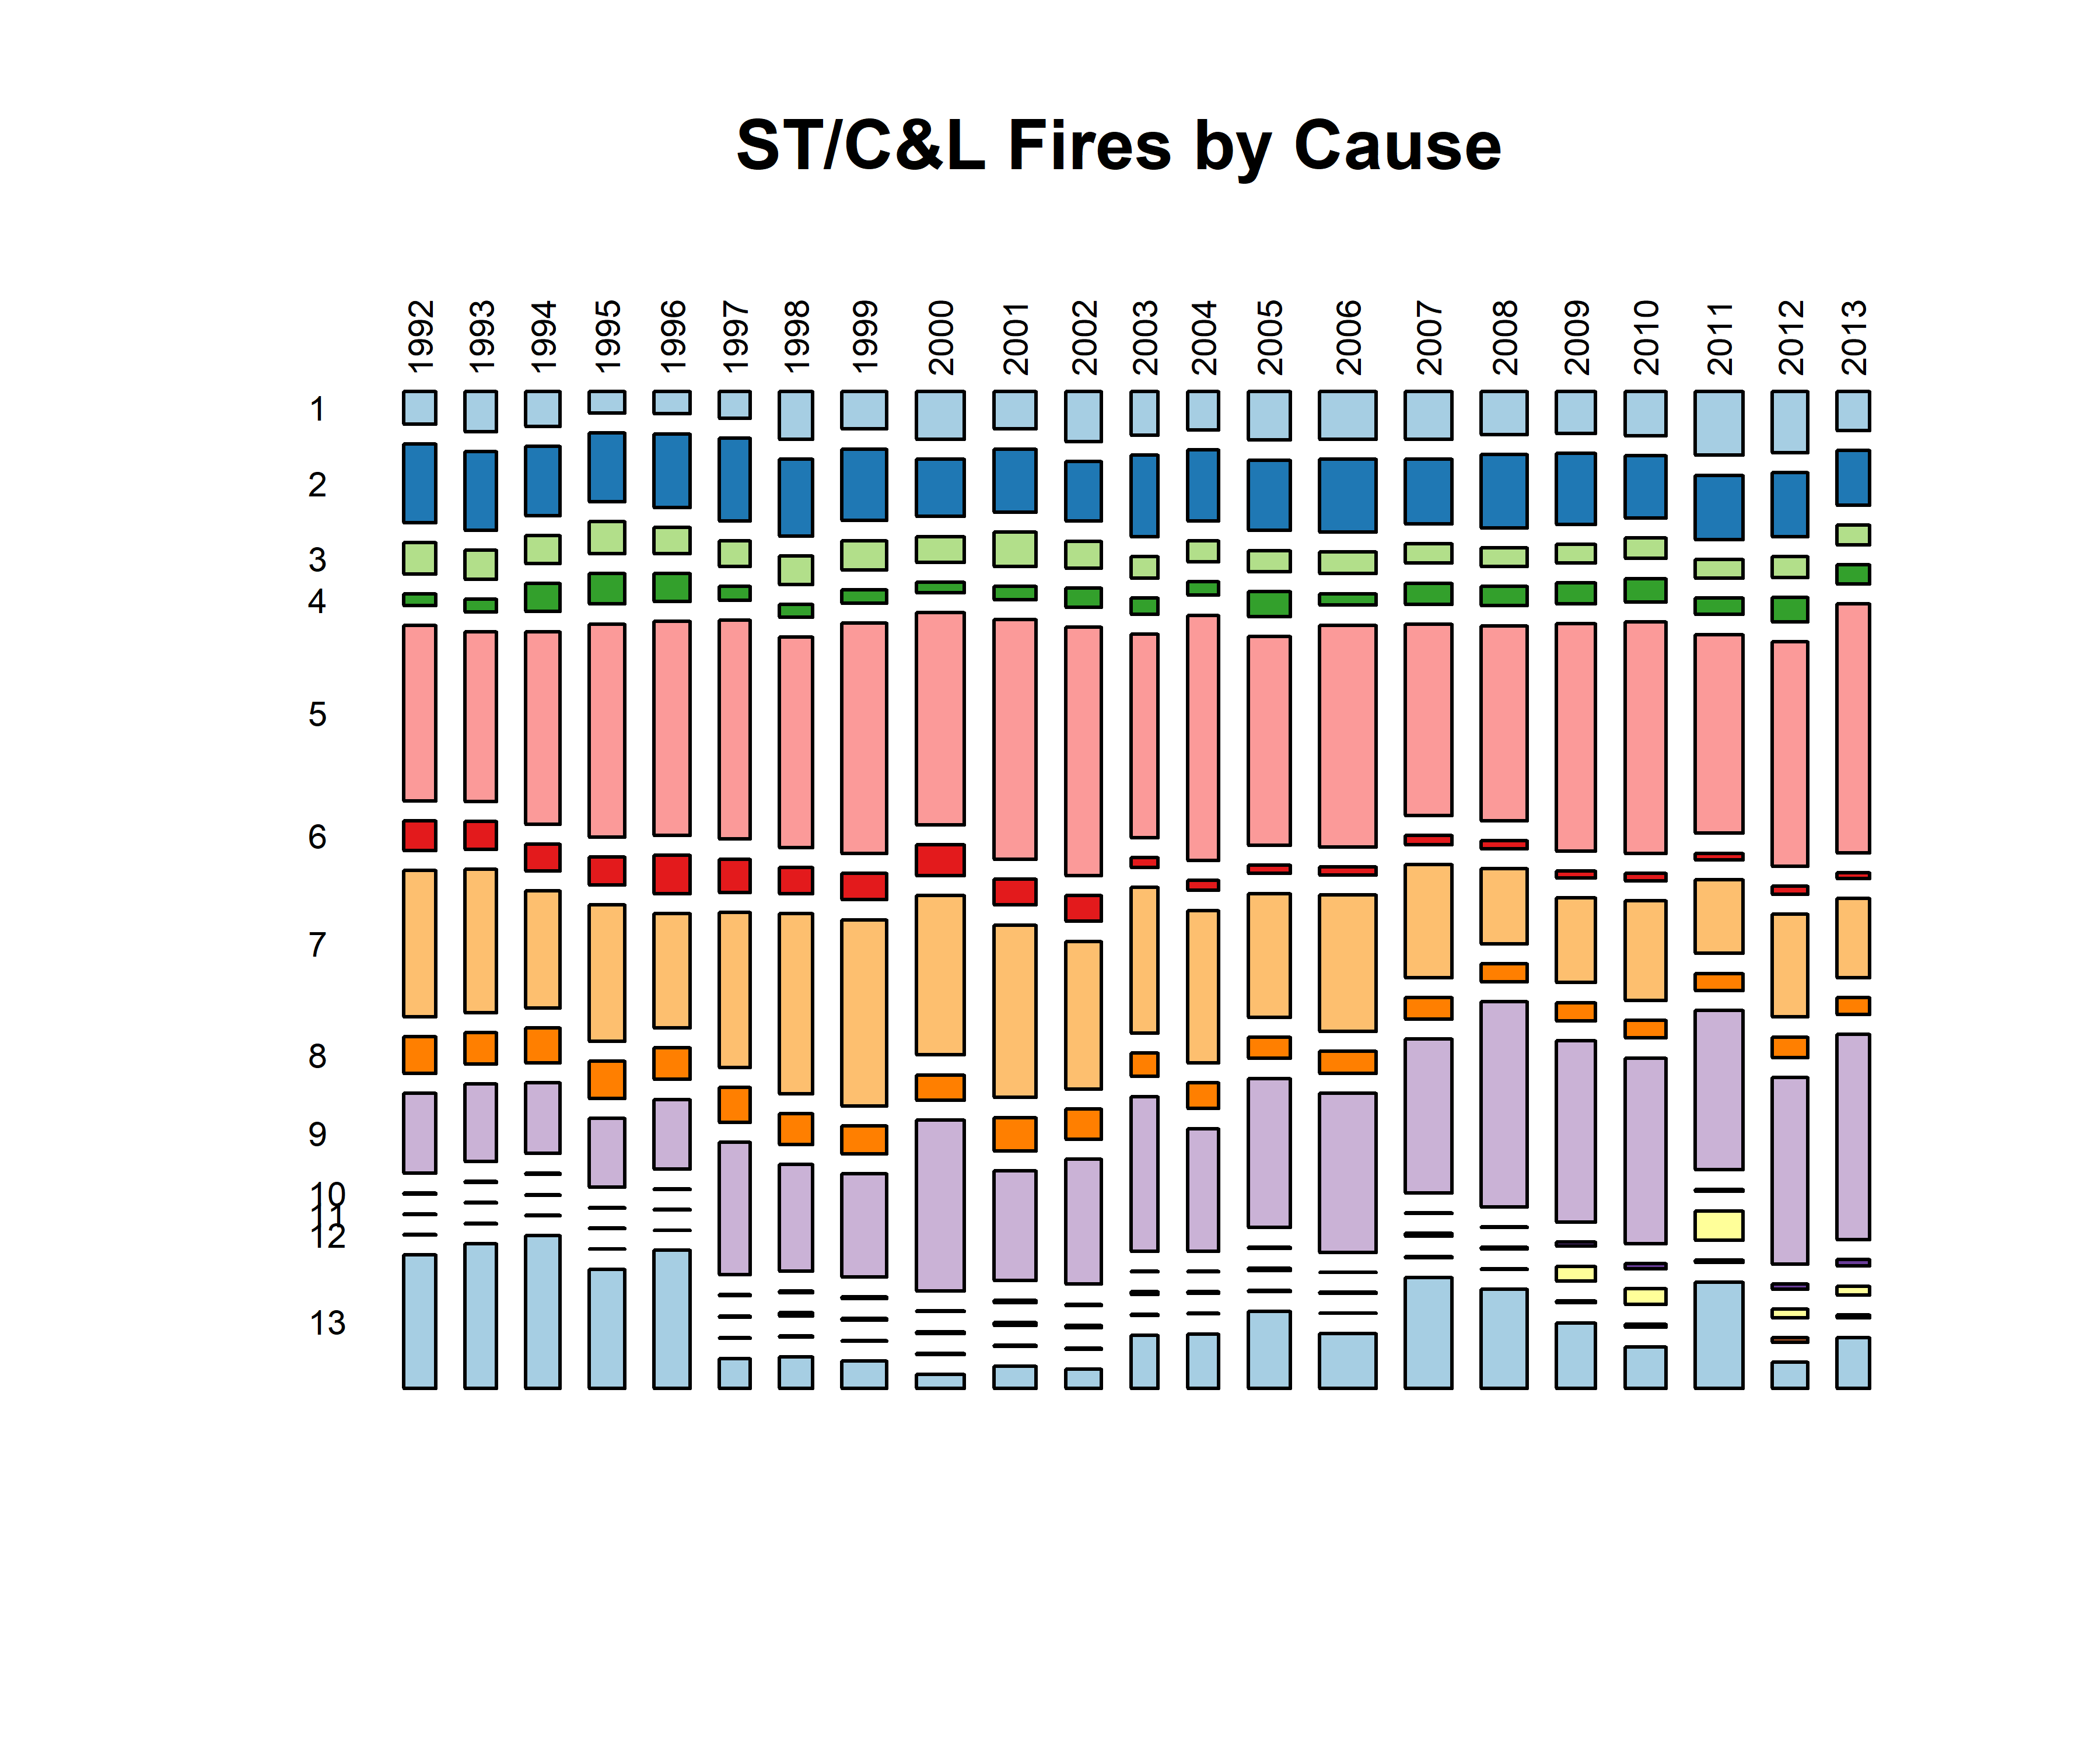
1.3.5 Cause summary
Histograms by cause
# 1 Lightning; 2 Equipment Use; 3 Smoking; 4 Campfire; 5 Debris Burning; 6 Railroad; 7 Arson; 8 Children;
# 9 Miscellaneous; 10 Fireworks; 11 Power Line; 12 Structure; 13 Missing/Undefined
oldpar <- par(mfrow=c(2,2))
hist(fpafod$DISCOVERY_DOY[fpafod$STAT_CAUSE_CODE == 1], breaks=seq(-0.5,366.5,by=1), freq=-TRUE,
  ylim=c(0,4000), xlim=c(0,400), xlab="", main="DISCOVERY_DOY (1 Lightning)")
hist(fpafod$DISCOVERY_DOY[fpafod$STAT_CAUSE_CODE == 2], breaks=seq(-0.5,366.5,by=1), freq=-TRUE,
  ylim=c(0,4000), xlim=c(0,400), xlab="", main="DISCOVERY_DOY (2 Equipment Use)")
hist(fpafod$DISCOVERY_DOY[fpafod$STAT_CAUSE_CODE == 3], breaks=seq(-0.5,366.5,by=1), freq=-TRUE,
  ylim=c(0,4000), xlim=c(0,400), xlab="", main="DISCOVERY_DOY (3 Smoking)")
hist(fpafod$DISCOVERY_DOY[fpafod$STAT_CAUSE_CODE == 4], breaks=seq(-0.5,366.5,by=1), freq=-TRUE,
  ylim=c(0,4000), xlim=c(0,400), xlab="", main="DISCOVERY_DOY (4 Campfire)")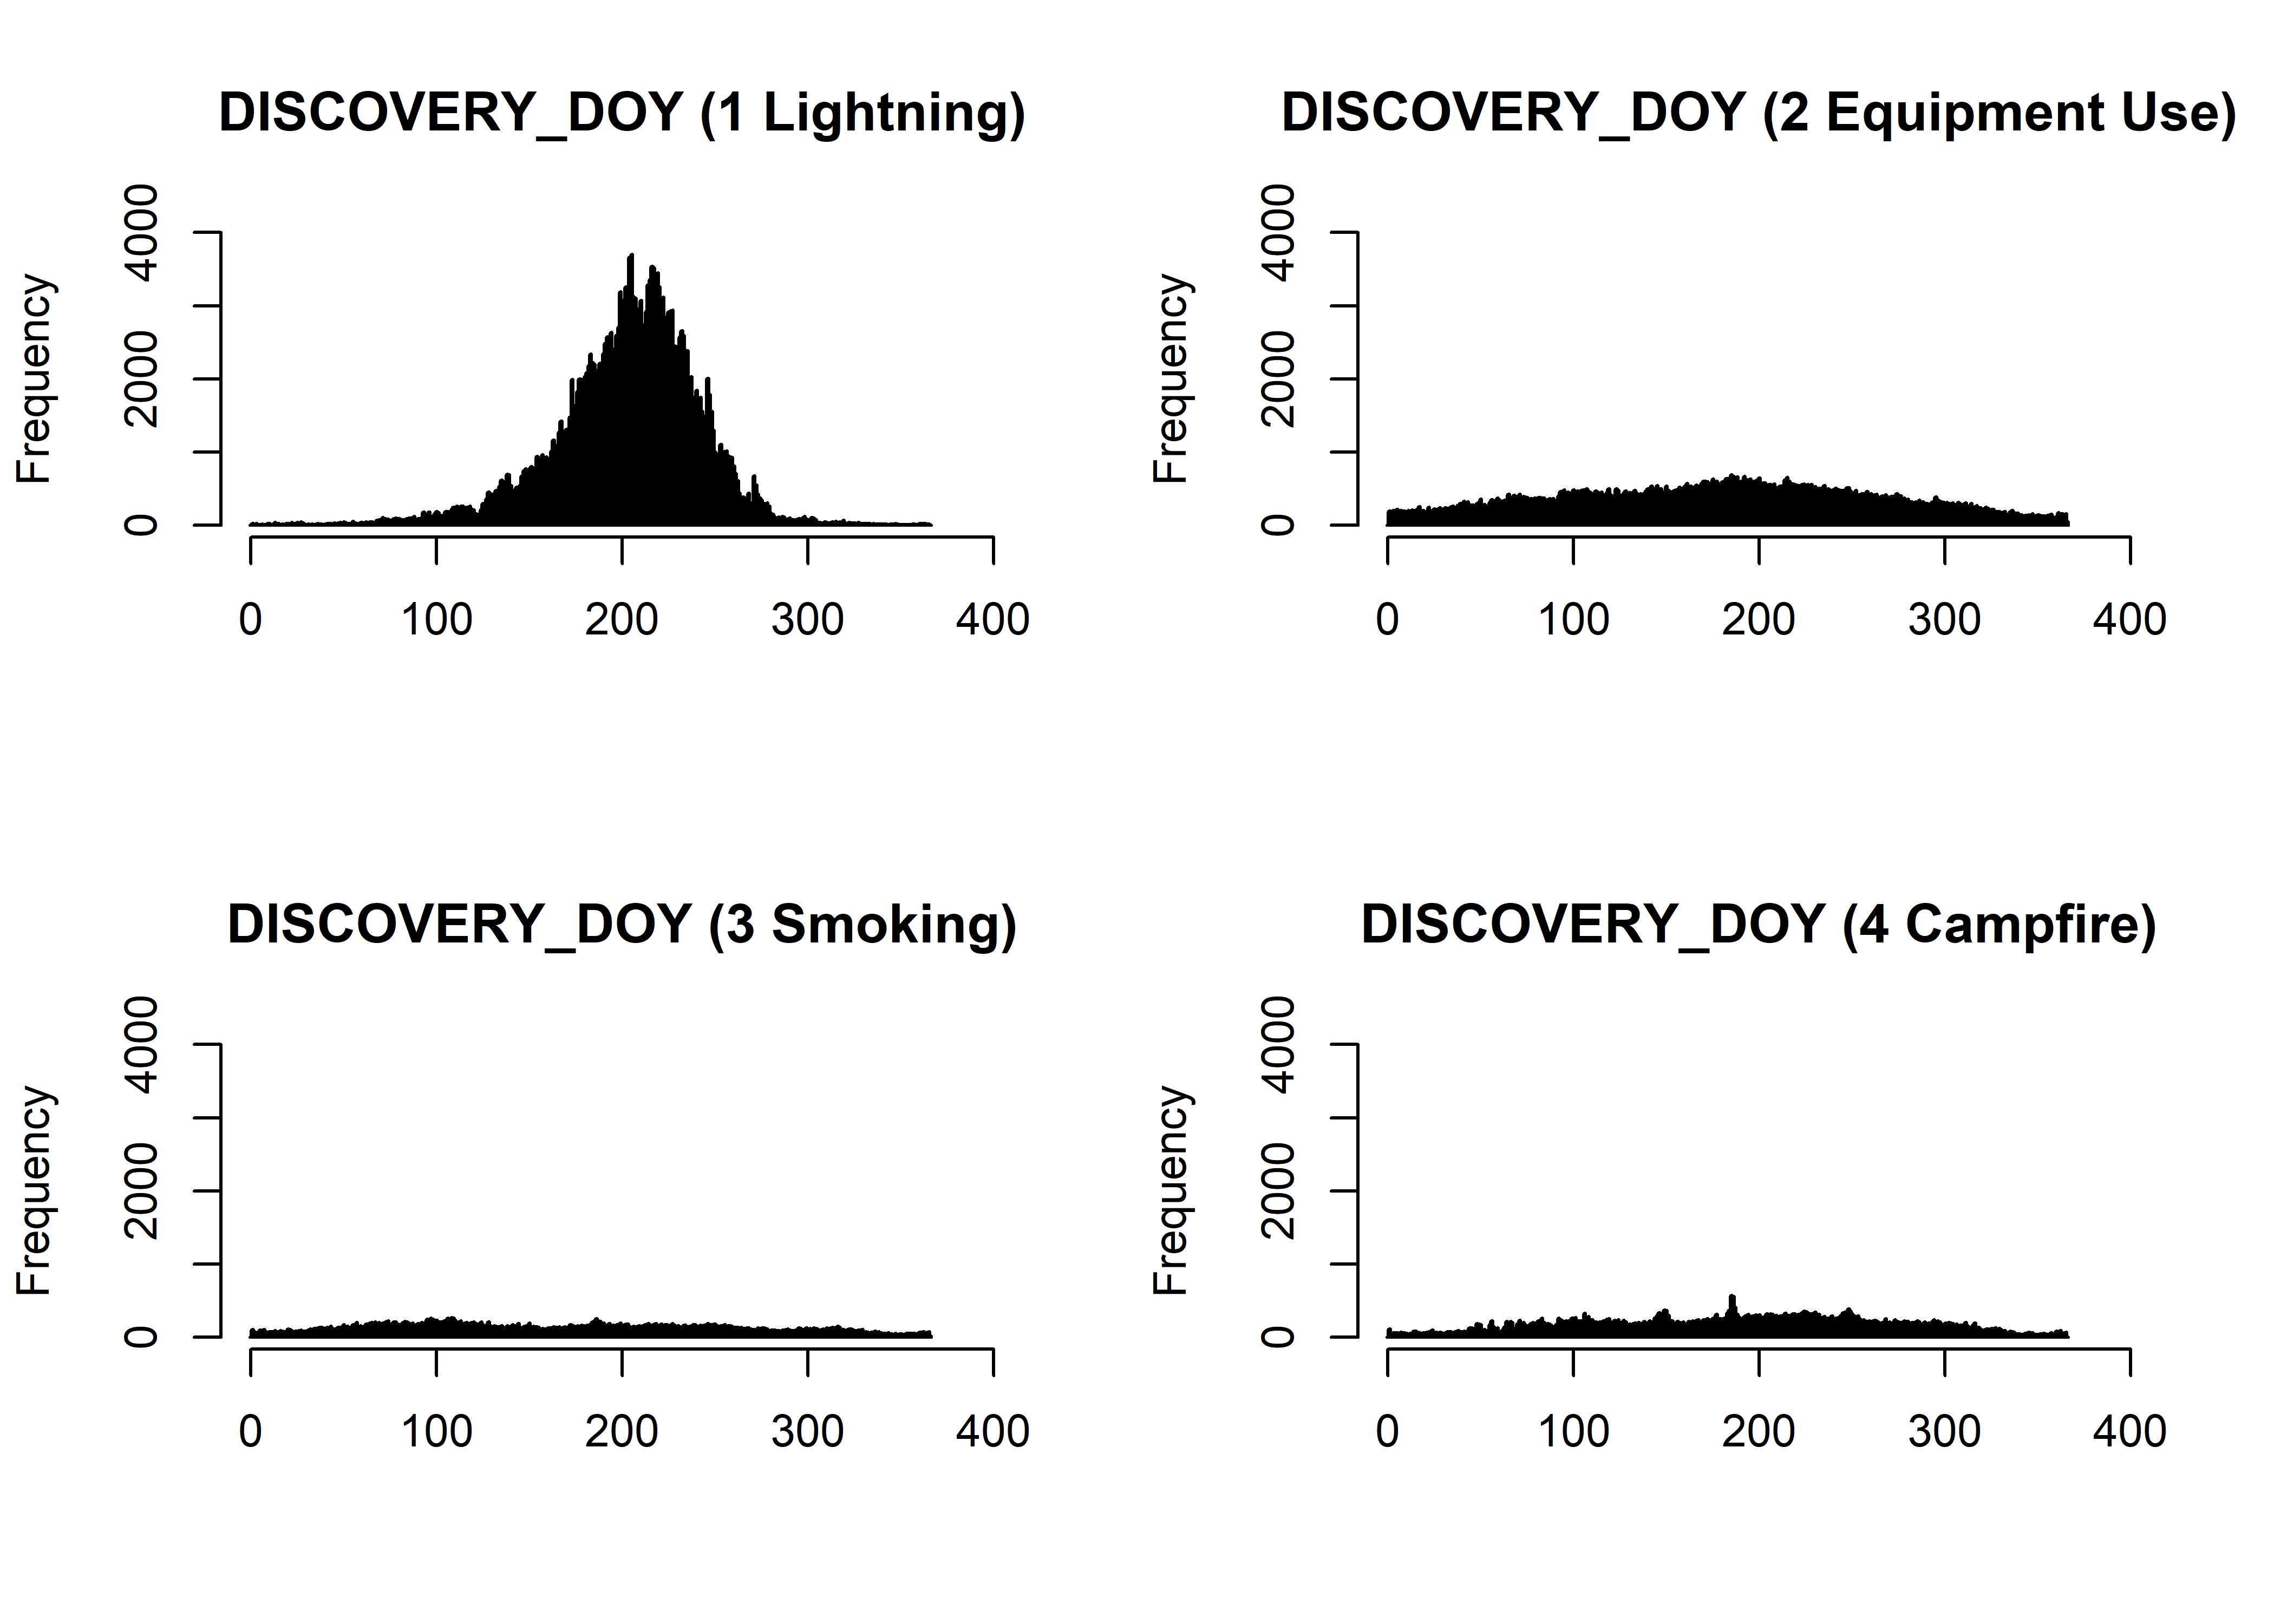
hist(fpafod$DISCOVERY_DOY[fpafod$STAT_CAUSE_CODE == 5], breaks=seq(-0.5,366.5,by=1), freq=-TRUE,
  ylim=c(0,4000), xlim=c(0,400), xlab="", main="DISCOVERY_DOY (5 Debris Burning)")
hist(fpafod$DISCOVERY_DOY[fpafod$STAT_CAUSE_CODE == 6], breaks=seq(-0.5,366.5,by=1), freq=-TRUE,
  ylim=c(0,4000), xlim=c(0,400), xlab="", main="DISCOVERY_DOY (6 Railroad)")
hist(fpafod$DISCOVERY_DOY[fpafod$STAT_CAUSE_CODE == 7], breaks=seq(-0.5,366.5,by=1), freq=-TRUE,
  ylim=c(0,4000), xlim=c(0,400), xlab="", main="DISCOVERY_DOY (7 Arson)")
hist(fpafod$DISCOVERY_DOY[fpafod$STAT_CAUSE_CODE == 8], breaks=seq(-0.5,366.5,by=1), freq=-TRUE,
ylim=c(0,4000), xlim=c(0,400), xlab="", main="DISCOVERY_DOY (8 Children)") 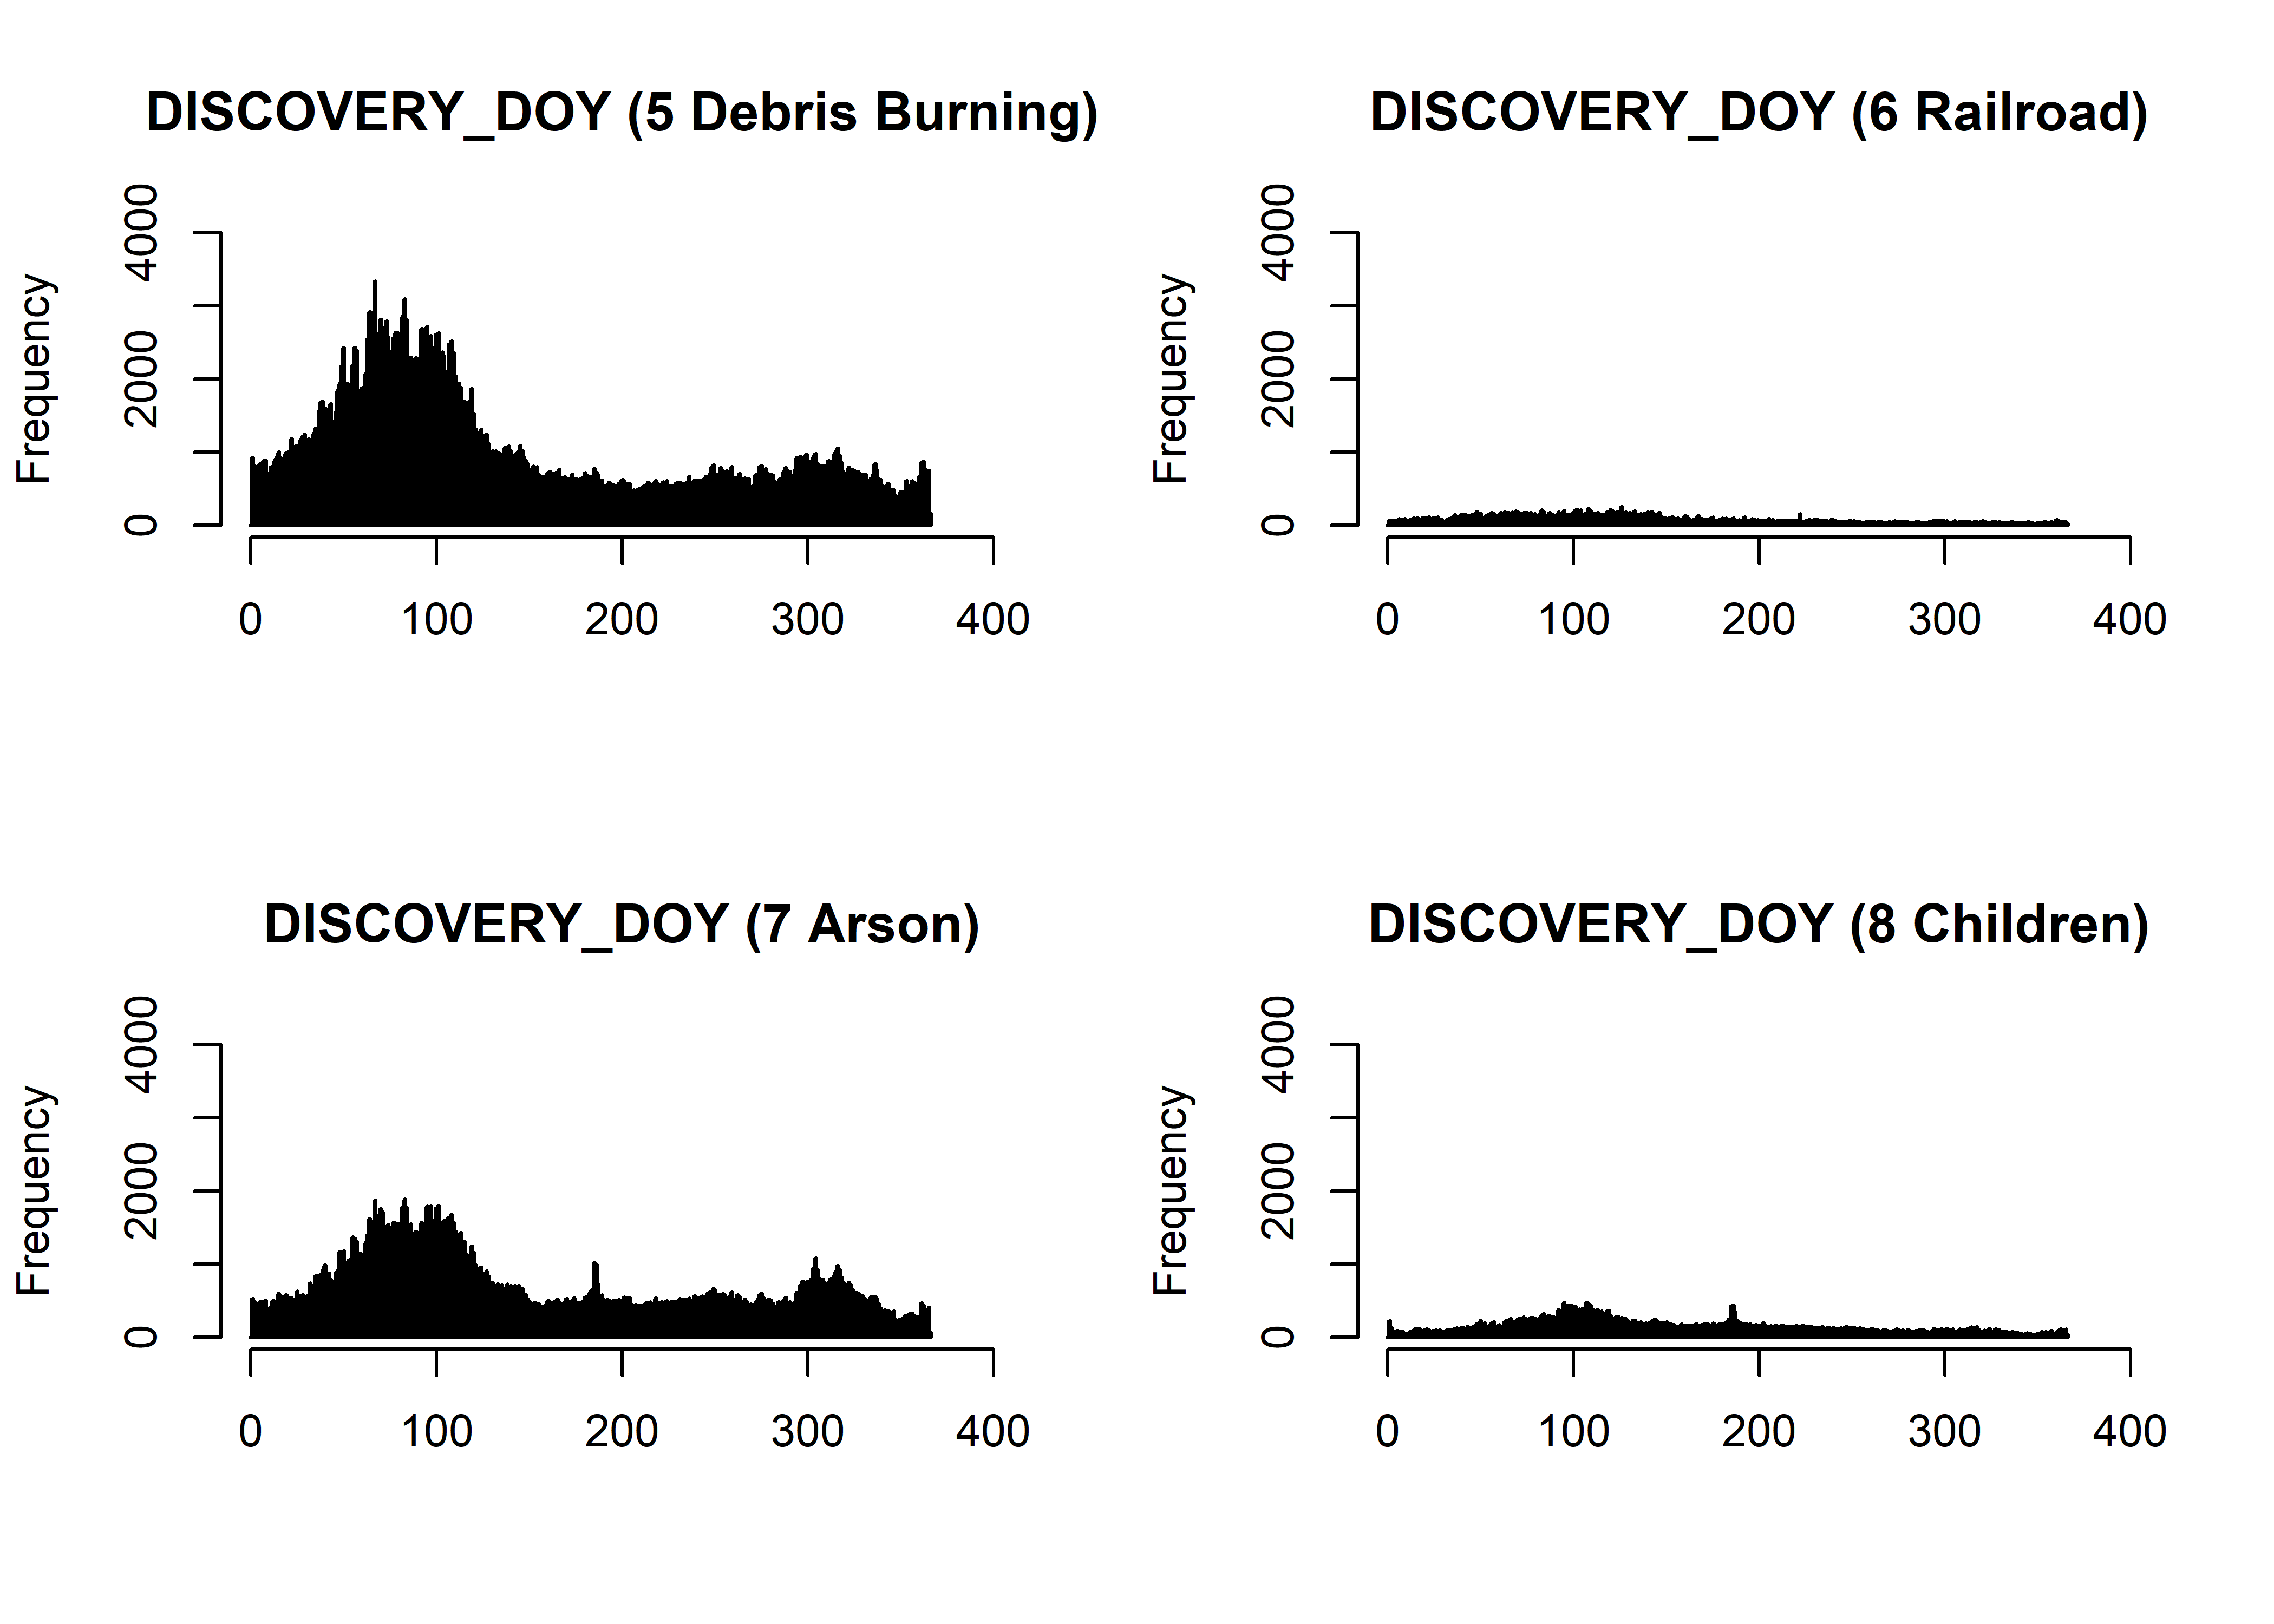
hist(fpafod$DISCOVERY_DOY[fpafod$STAT_CAUSE_CODE == 9], breaks=seq(-0.5,366.5,by=1), freq=-TRUE,
  ylim=c(0,4000), xlim=c(0,400), xlab="", main="DISCOVERY_DOY (9 Miscellaneous)")
hist(fpafod$DISCOVERY_DOY[fpafod$STAT_CAUSE_CODE == 10], breaks=seq(-0.5,366.5,by=1), freq=-TRUE,
  ylim=c(0,4000), xlim=c(0,400), xlab="", main="DISCOVERY_DOY (10 Fireworks)")
hist(fpafod$DISCOVERY_DOY[fpafod$STAT_CAUSE_CODE == 11], breaks=seq(-0.5,366.5,by=1), freq=-TRUE,
  ylim=c(0,4000), xlim=c(0,400), xlab="", main="DISCOVERY_DOY (11 Power Line)")
hist(fpafod$DISCOVERY_DOY[fpafod$STAT_CAUSE_CODE == 12], breaks=seq(-0.5,366.5,by=1), freq=-TRUE,
  ylim=c(0,4000), xlim=c(0,400), xlab="", main="DISCOVERY_DOY (12 Structure)")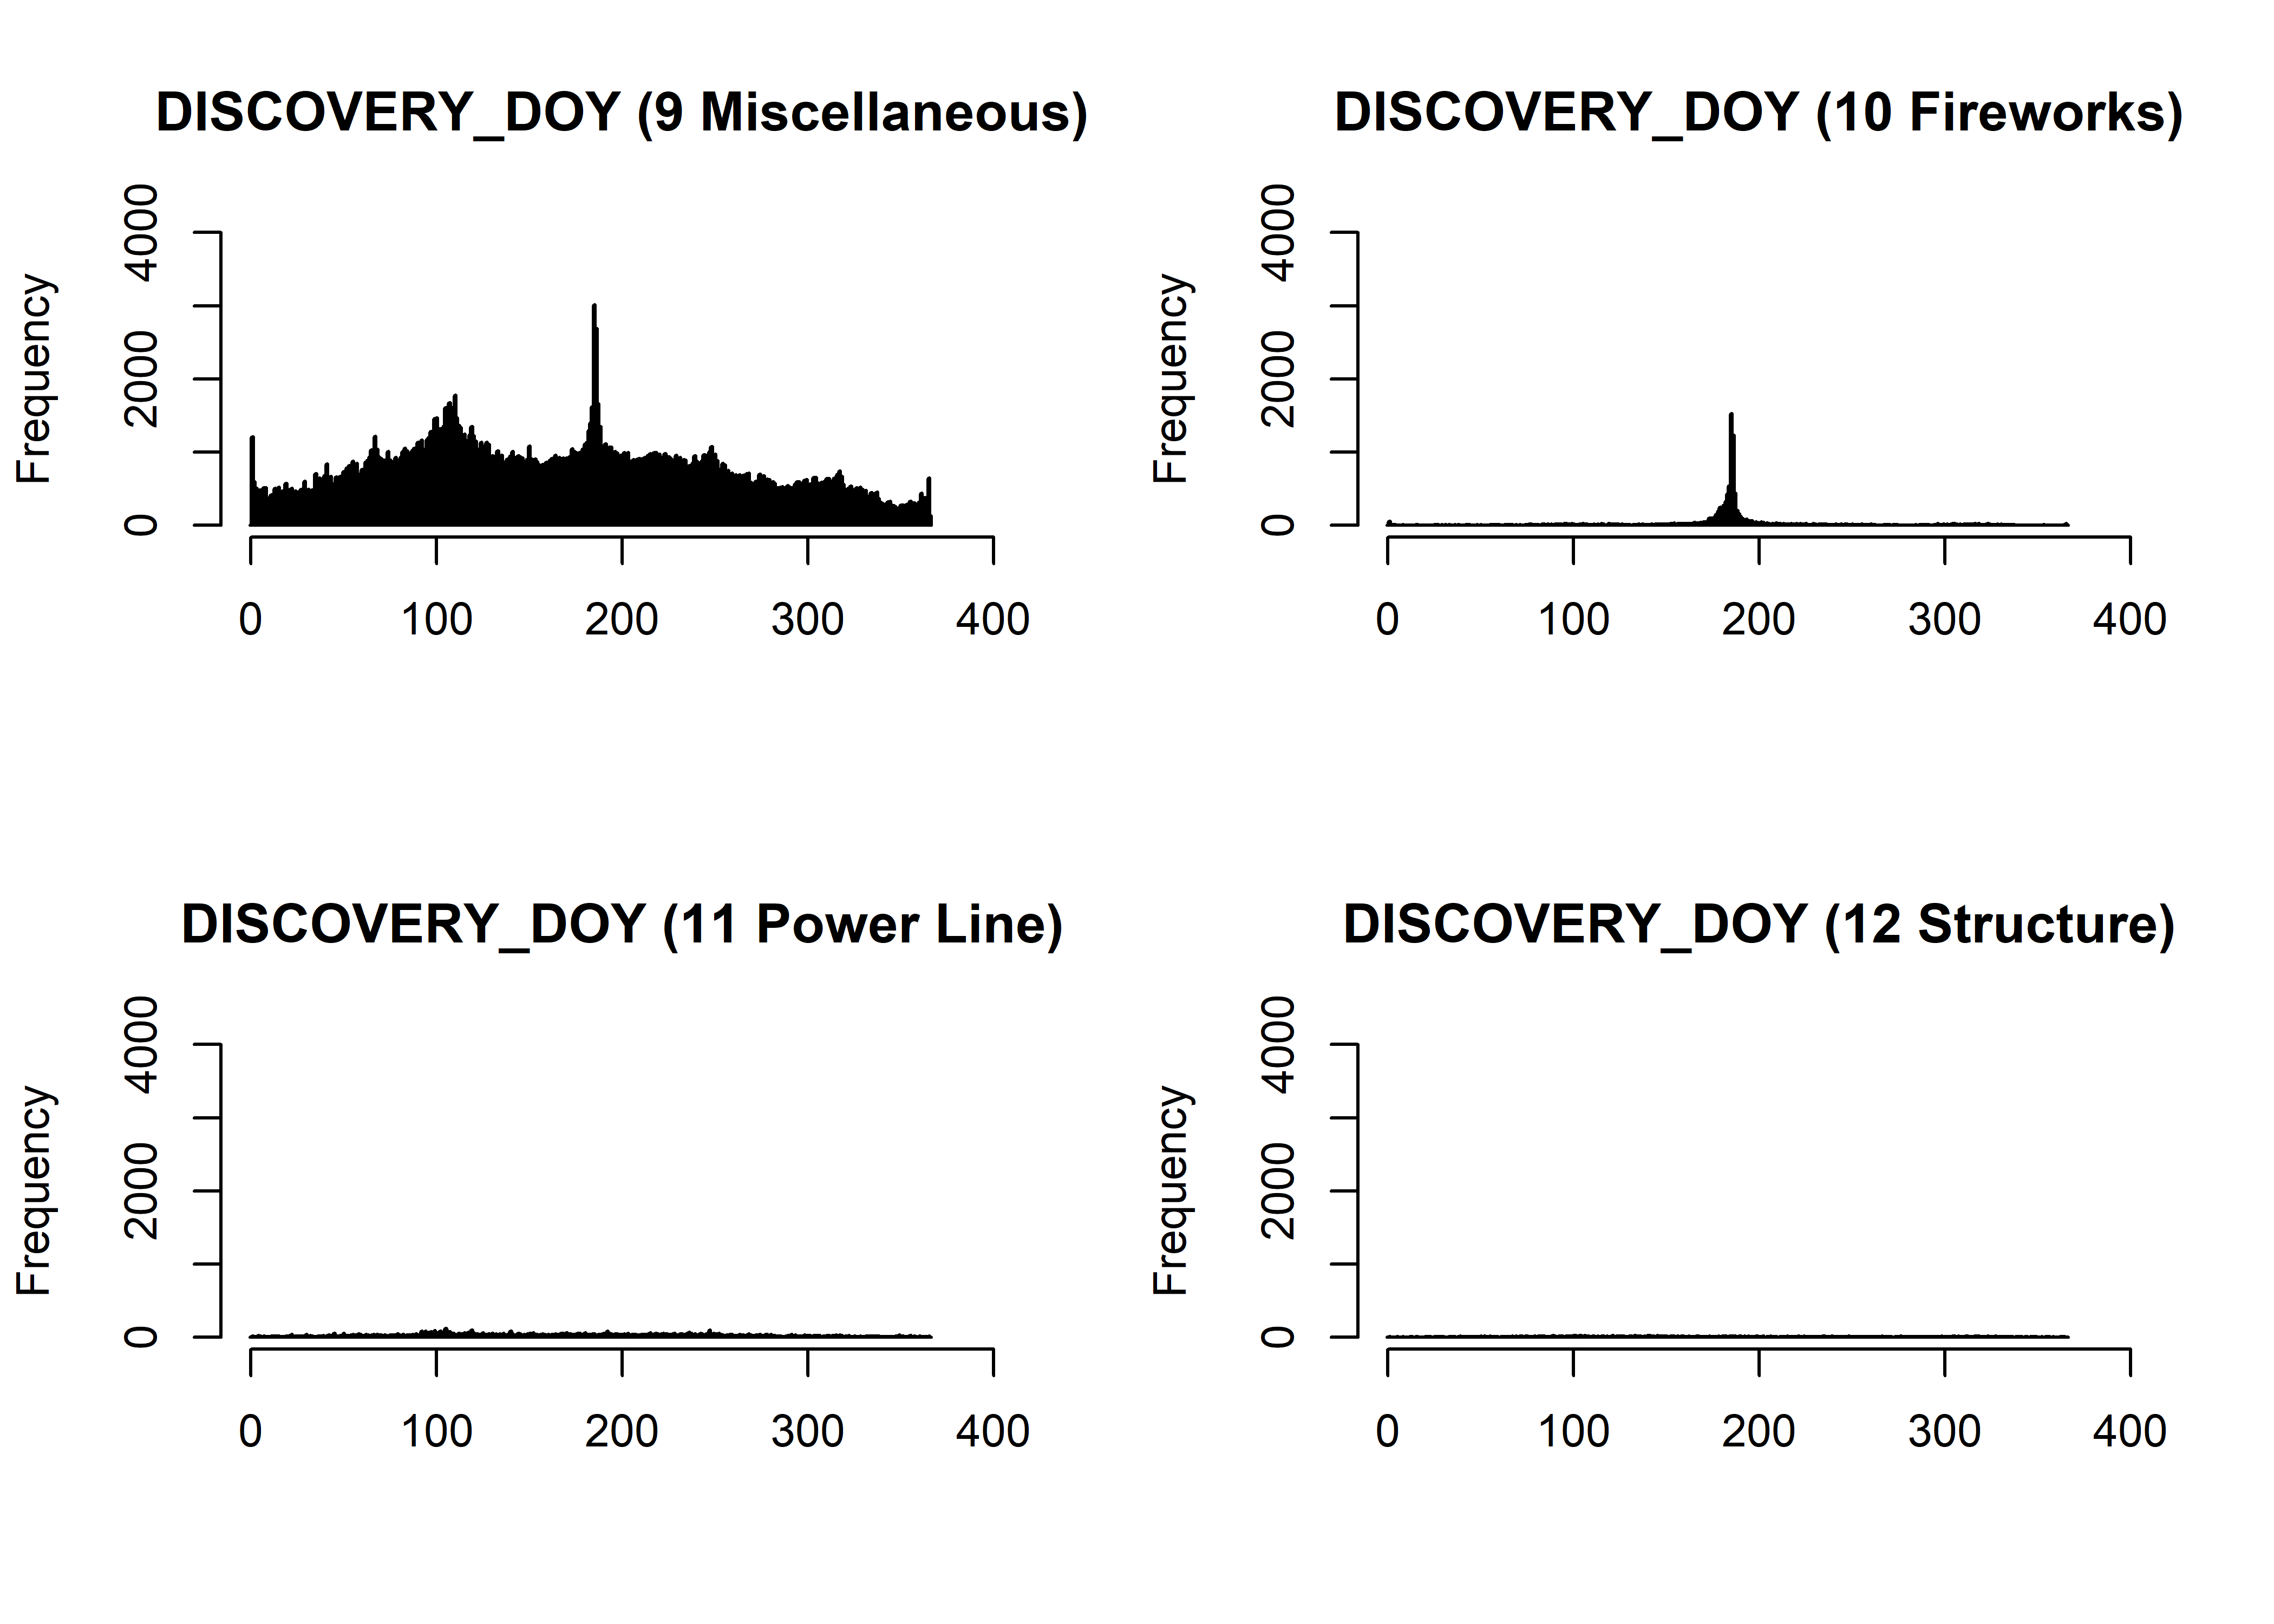
hist(fpafod$DISCOVERY_DOY[fpafod$STAT_CAUSE_CODE == 13], breaks=seq(-0.5,366.5,by=1), freq=-TRUE,
  ylim=c(0,4000), xlim=c(0,400), xlab="", main="DISCOVERY_DOY (13 Missing/Undefined)")
par(oldpar)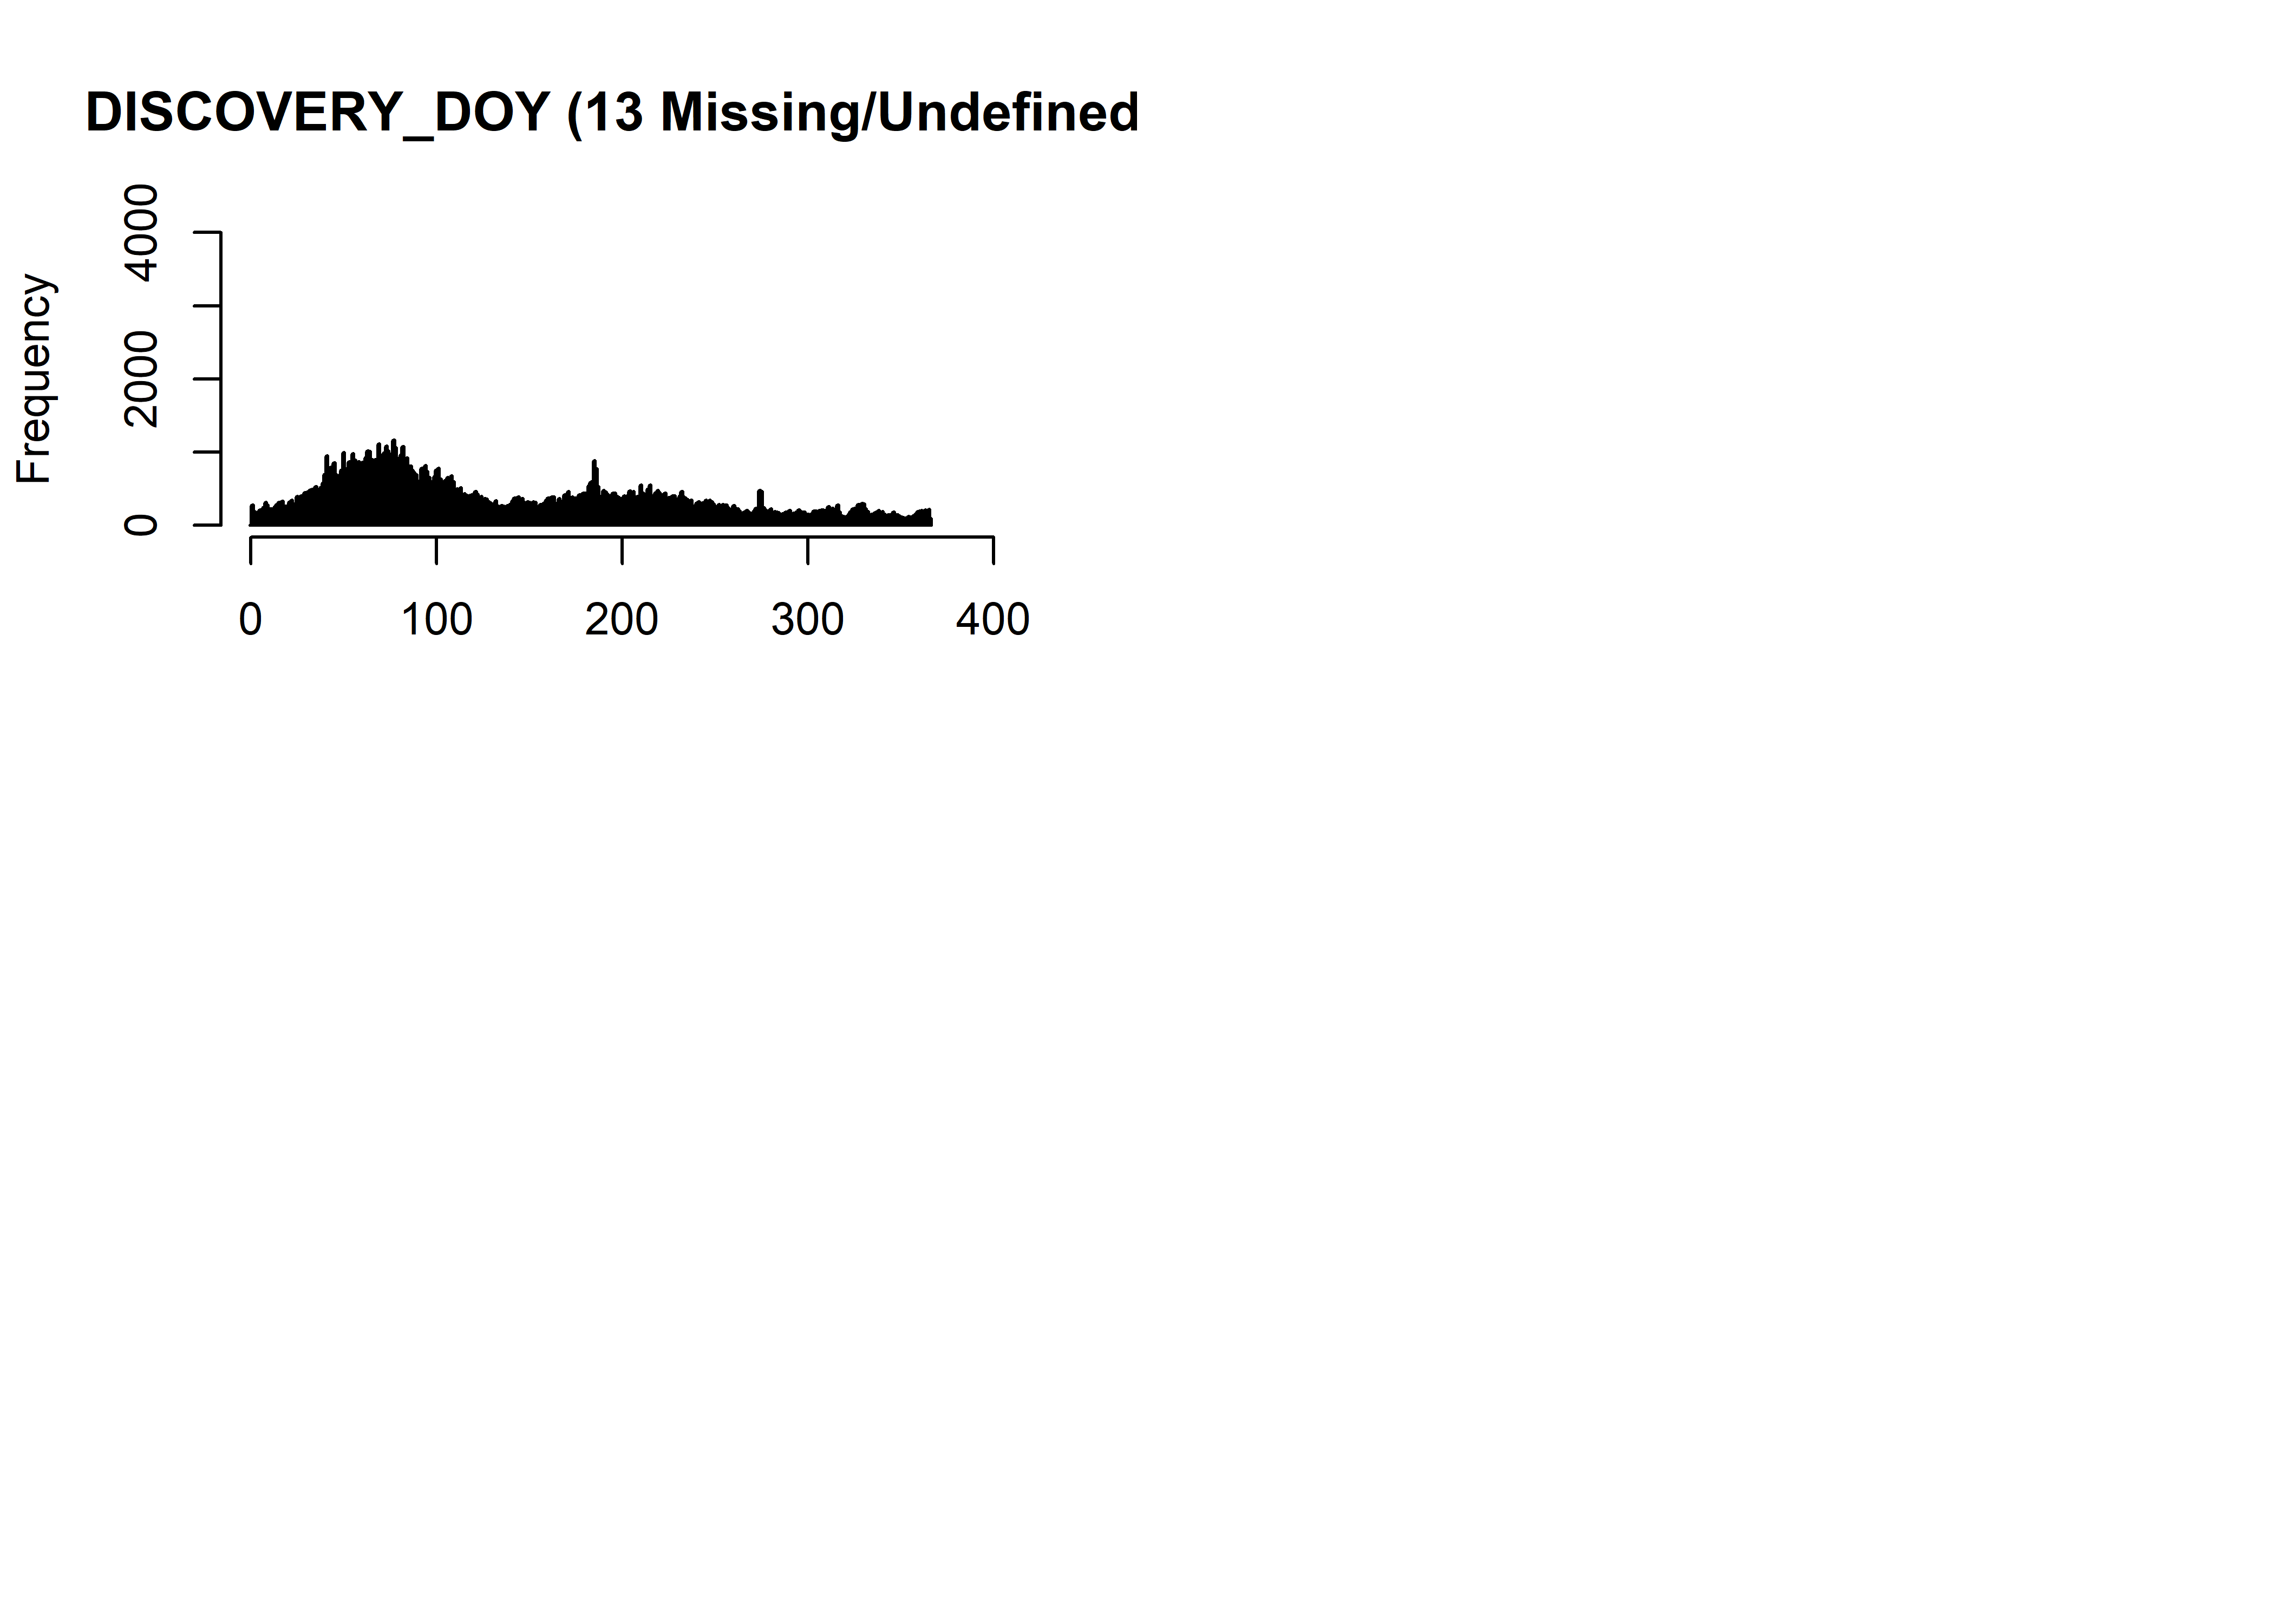
Number of fires/year (FS and FWS)
hist(fpafod$FIRE_YEAR[fpafod$NWCG_REPORTING_AGENCY =="FS"], xlim=c(1980,2015), ylim=c(0,40000),
  breaks=seq(1979.5,2014.5,by=1))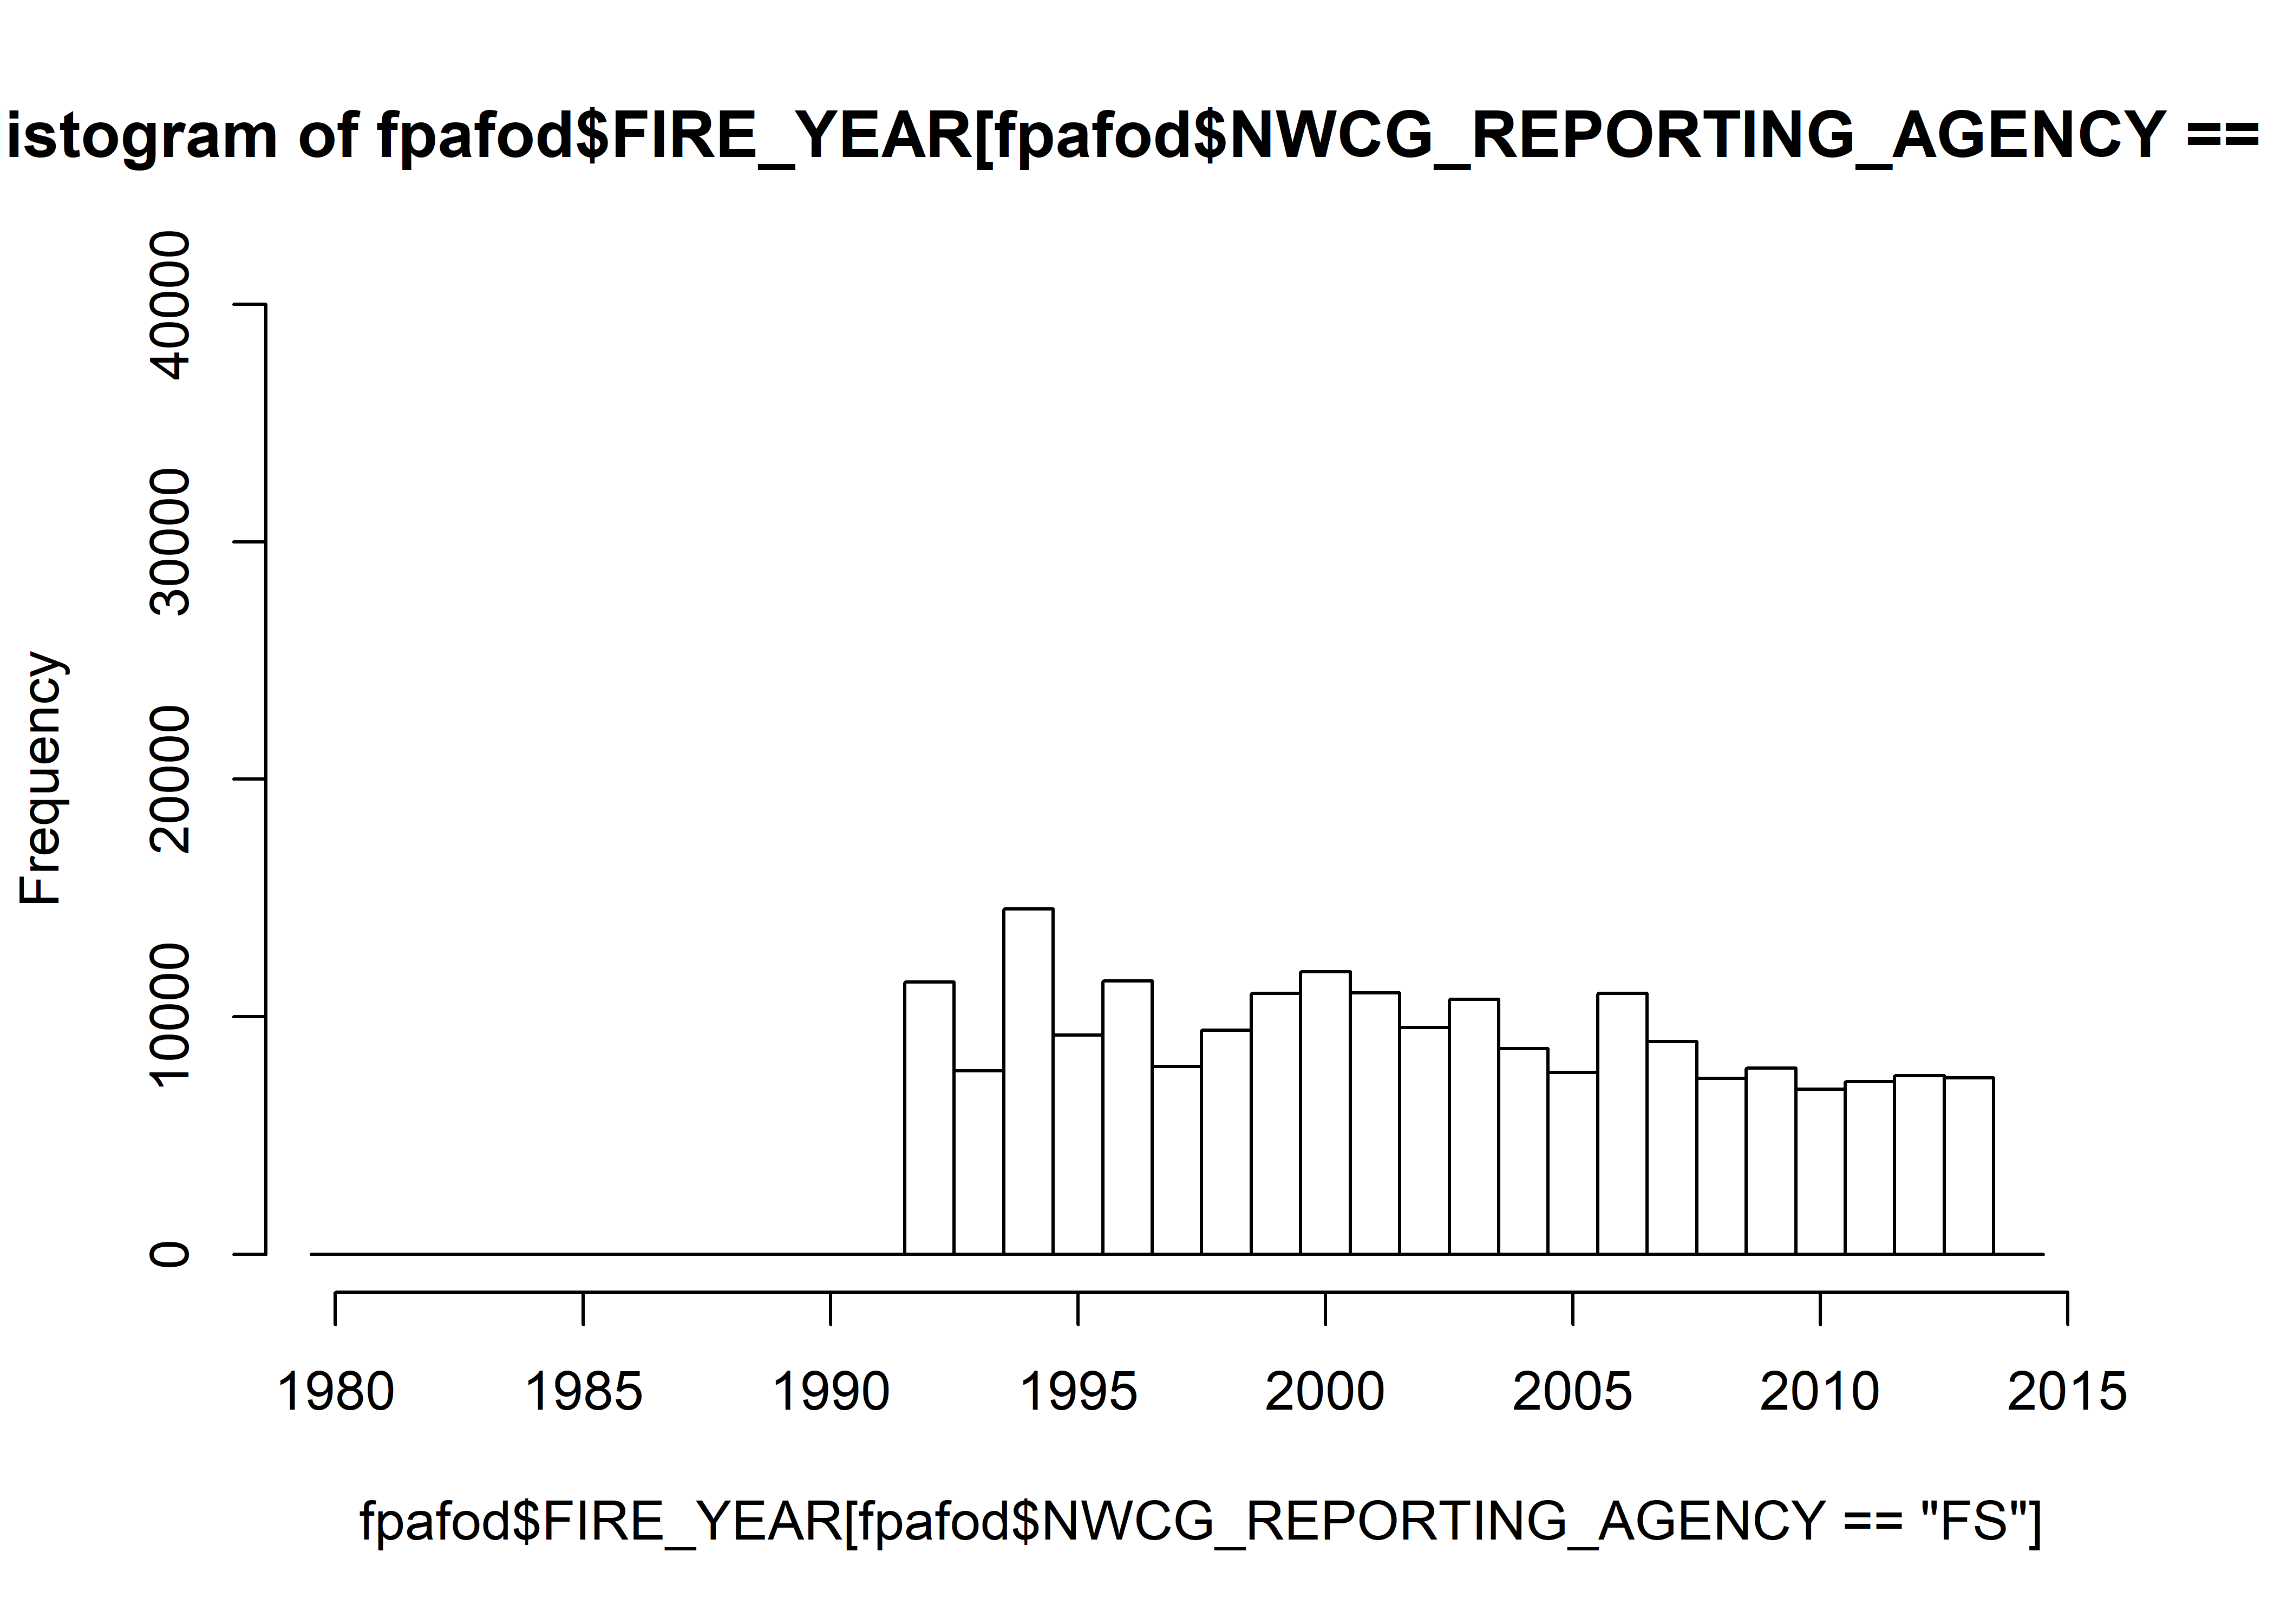
hist(fpafod$FIRE_YEAR[fpafod$NWCG_REPORTING_AGENCY =="FWS"], xlim=c(1980,2015), ylim=c(0,40000),
  breaks=seq(1979.5,2014.5,by=1))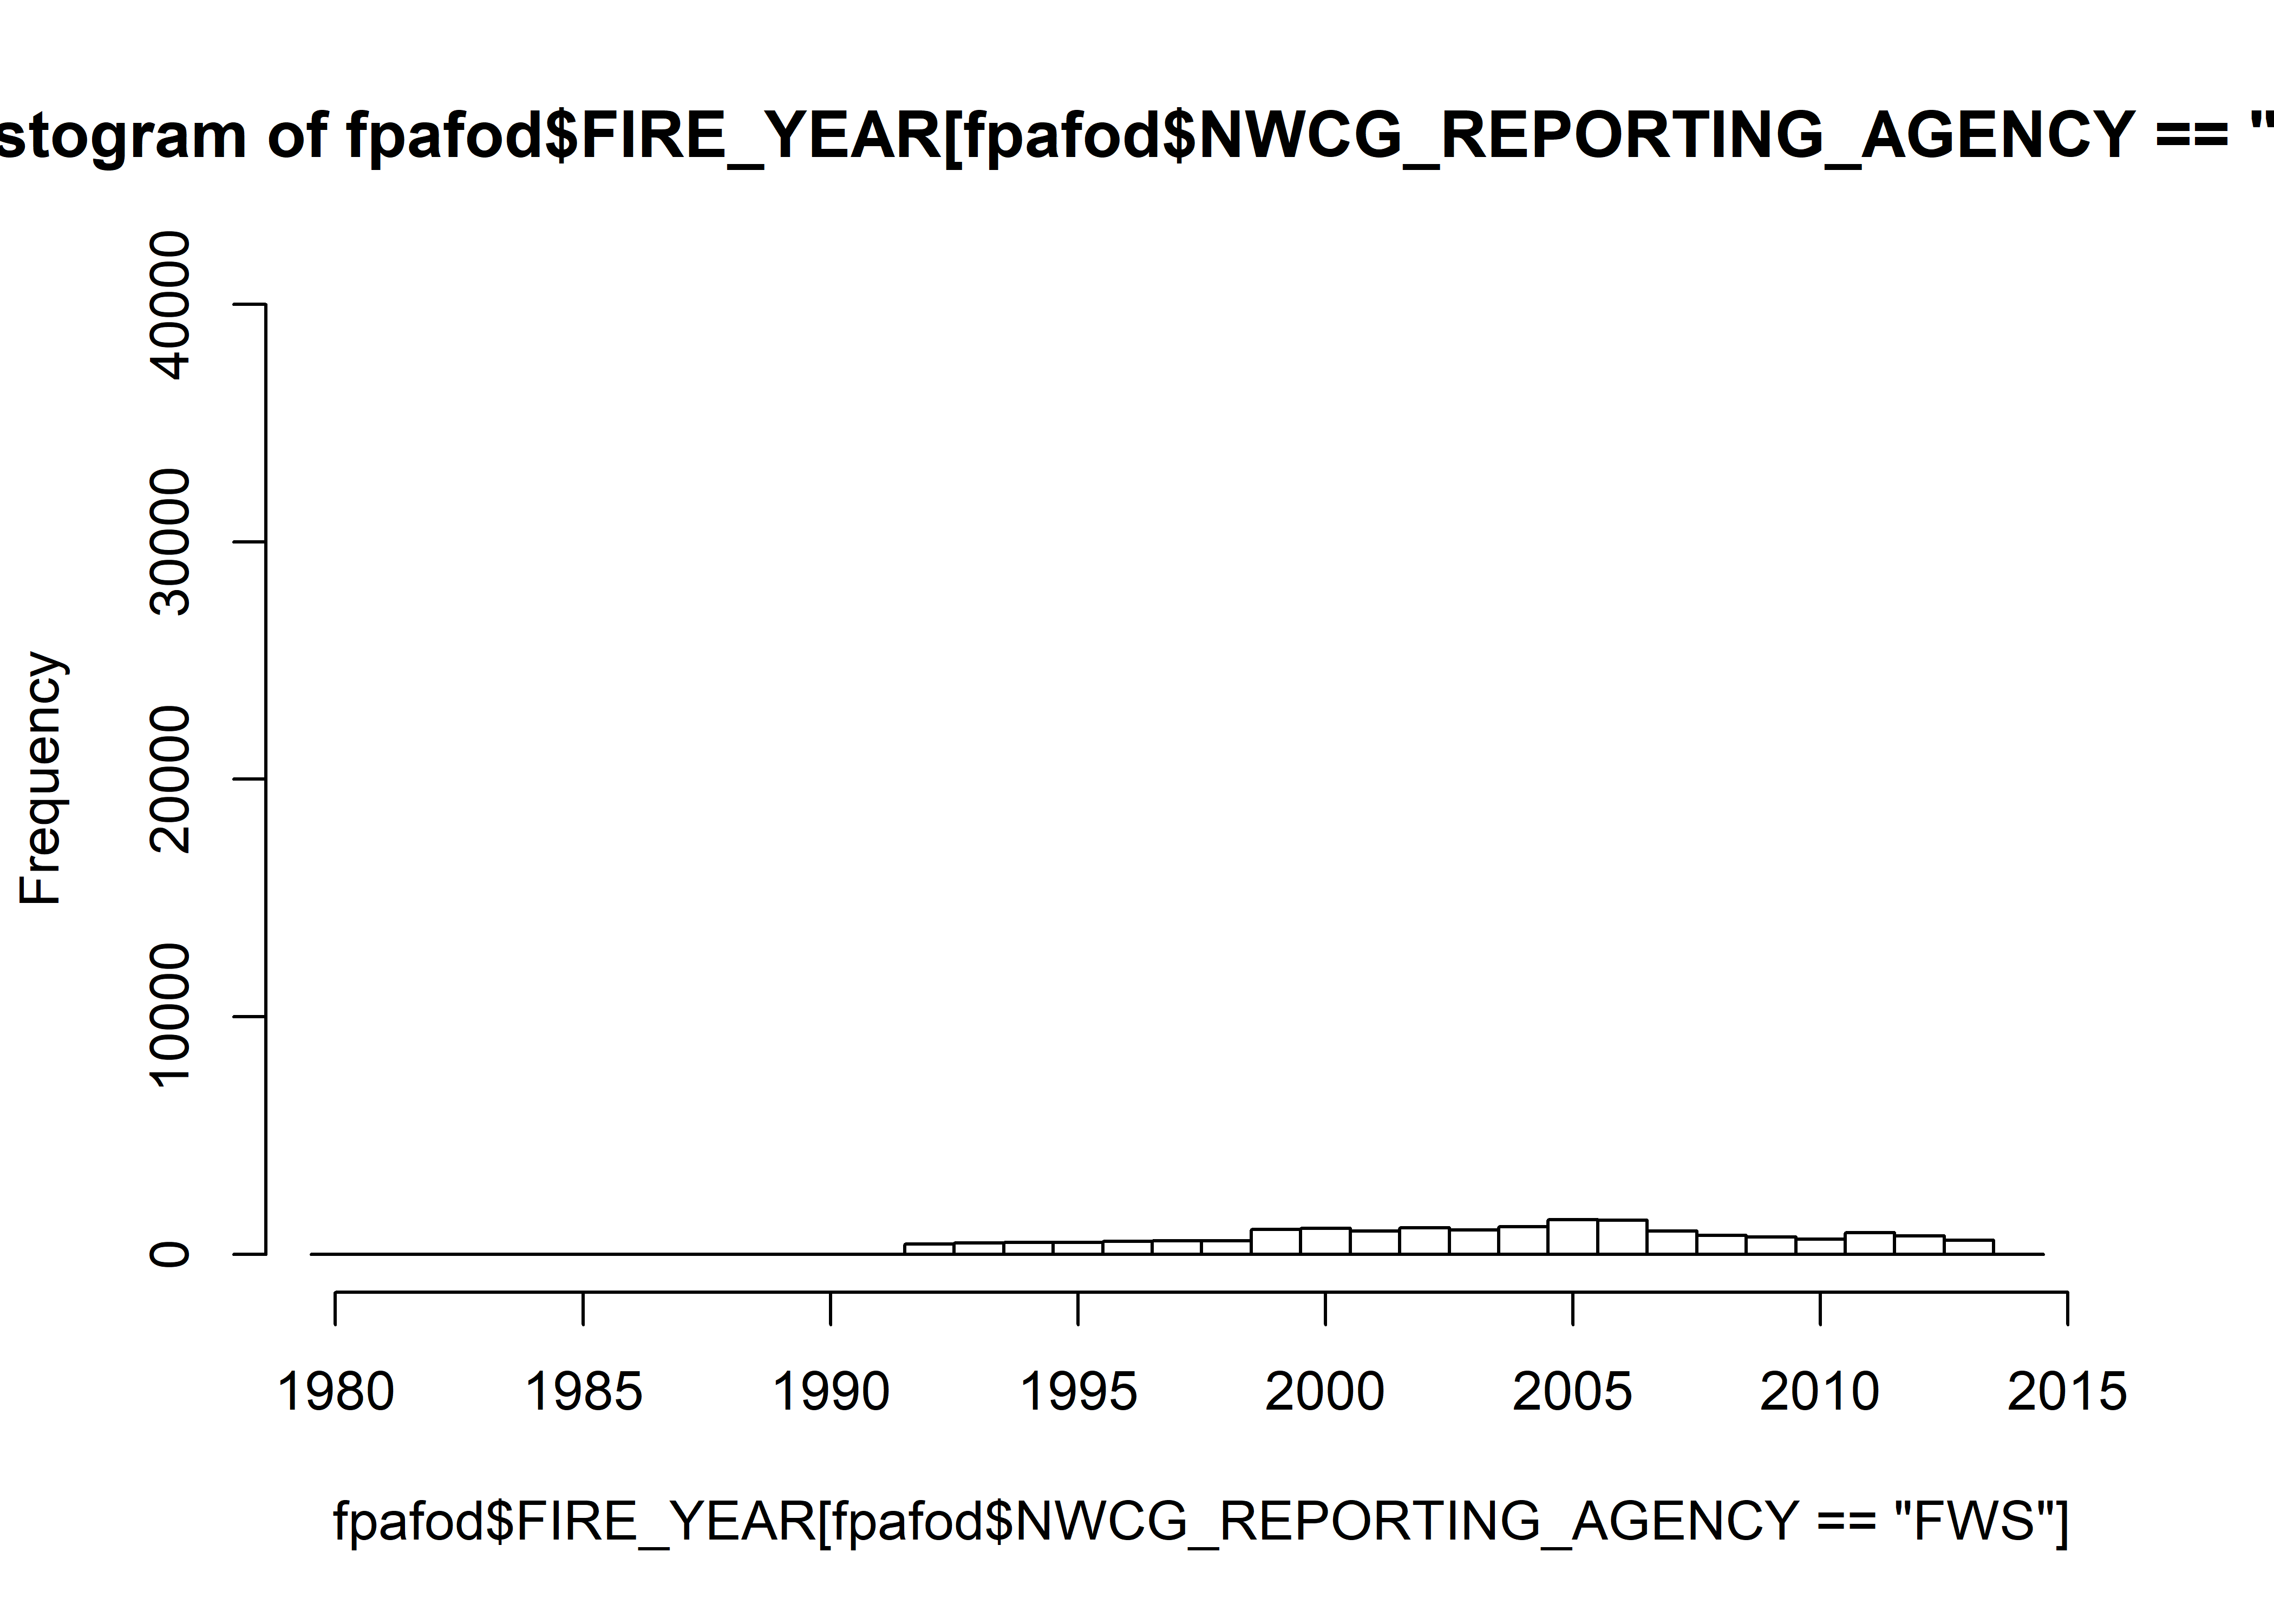
Mosaic plots by agency (FS and FWS)
table(fpafod$NWCG_REPORTING_AGENCY)##
## BIA BLM BOR DOD DOE FS FWS IA NPS ST/C&L TRIBE
## 108423 90801 11 59 1 206731 18409 21841 19571 1254551 7078fpafod.tablemon <- table(fpafod$FIRE_YEAR[fpafod$NWCG_REPORTING_AGENCY == "FS"],
fpafod$startmon[fpafod$NWCG_REPORTING_AGENCY == "FS"])
mosaicplot(fpafod.tablemon, color=monthcolors, cex.axis=0.6, las=3, main="All Fires -- FS")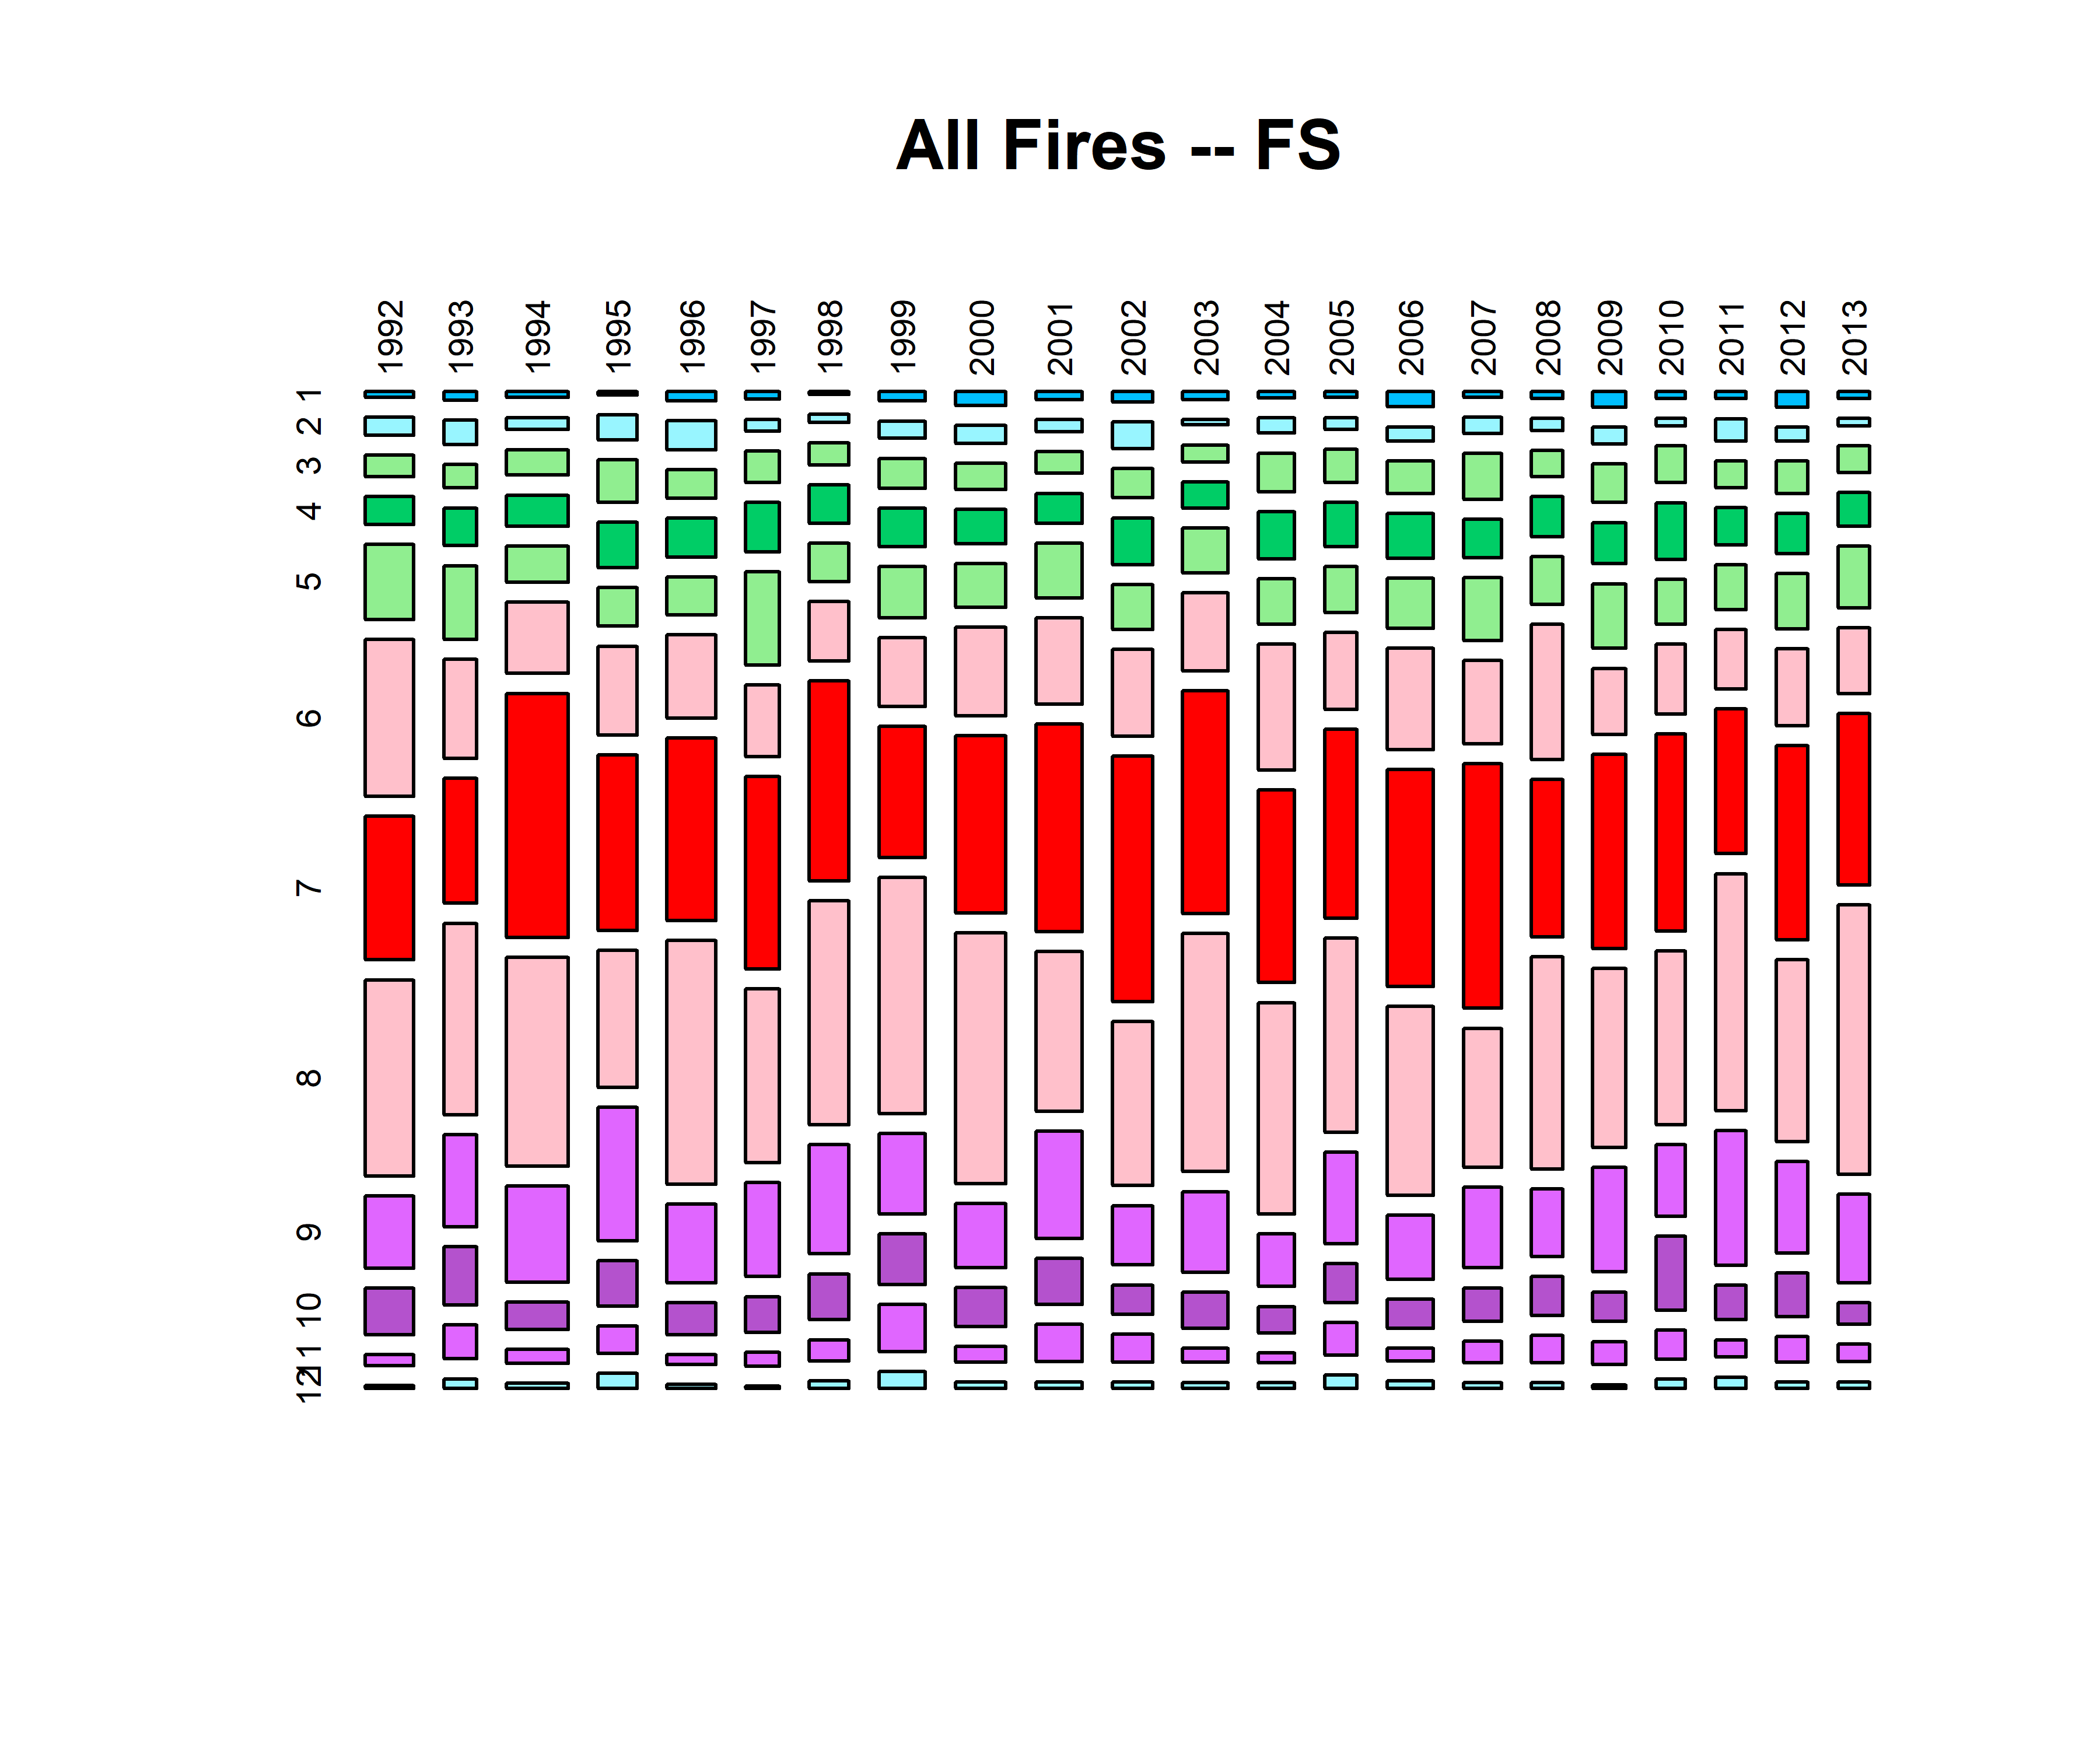
fpafod.tablemon <- table(fpafod$FIRE_YEAR[fpafod$NWCG_REPORTING_AGENCY == "FWS"],
  fpafod$startmon[fpafod$NWCG_REPORTING_AGENCY == "FWS"])
mosaicplot(fpafod.tablemon, color=monthcolors, cex.axis=0.6, las=3, main="All Fires -- FWS")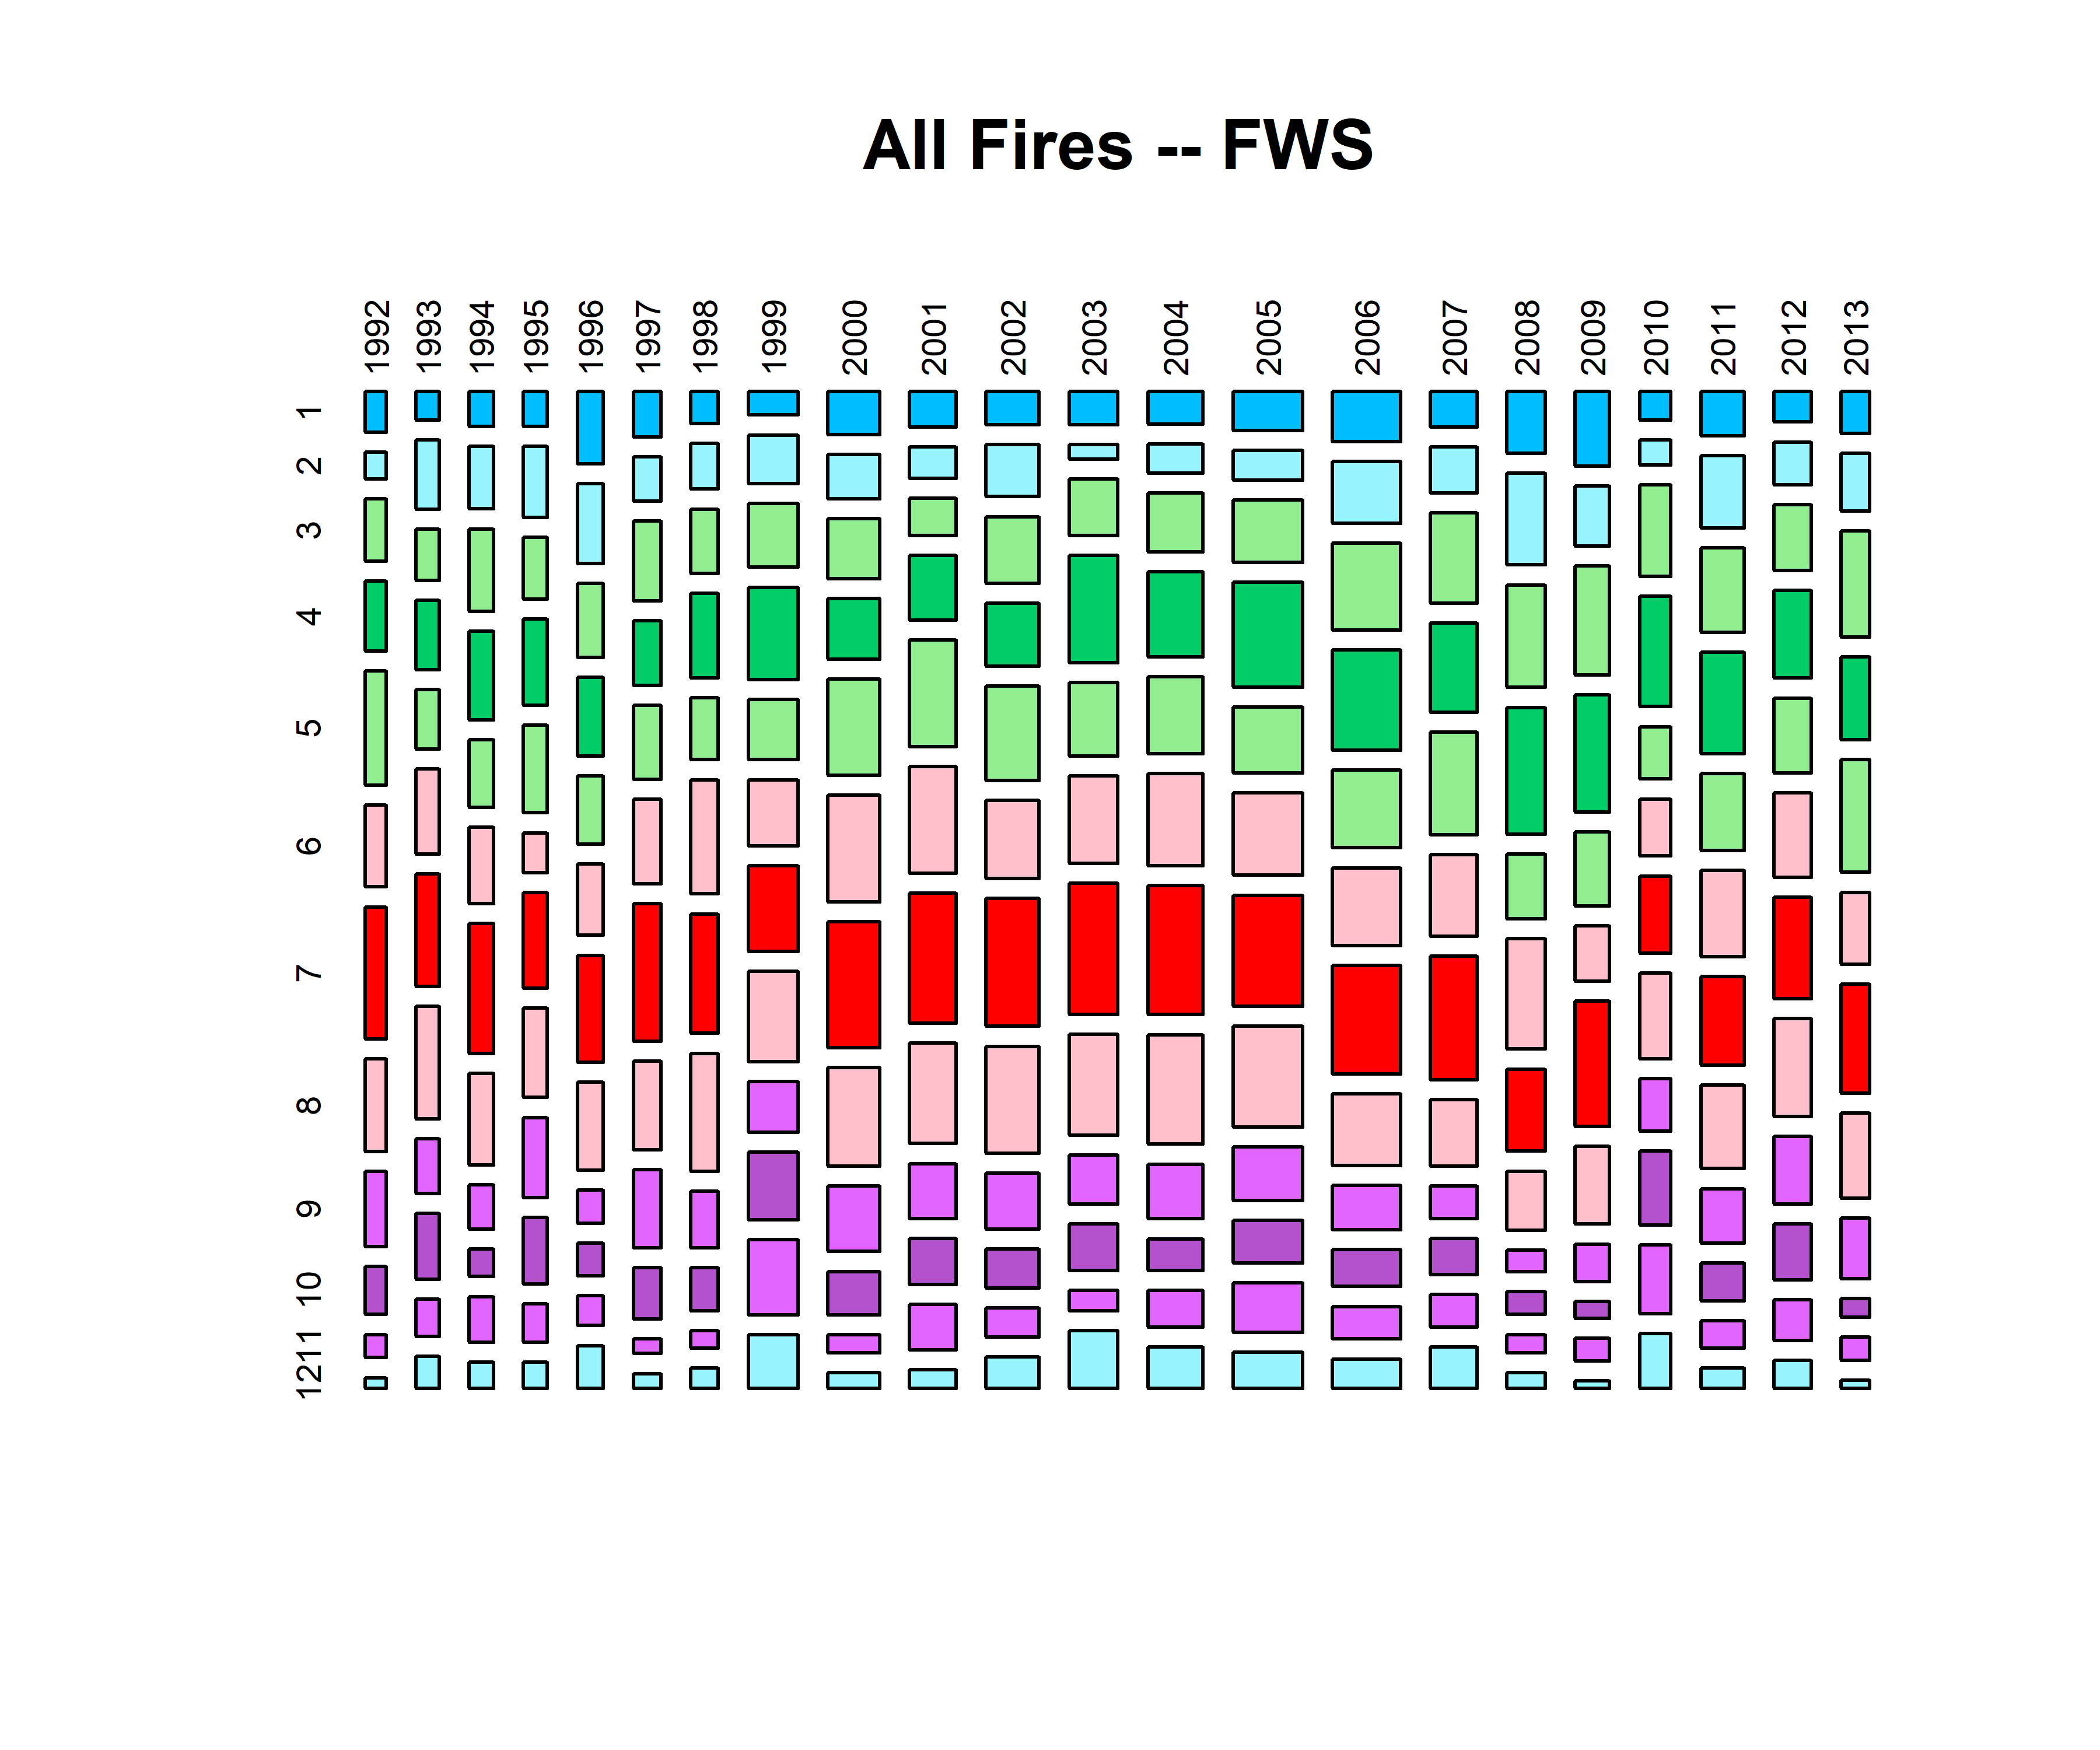
Fish and Wildlife Service data might have discontinuities between 1998 and 1999, and maybe between 2007 and 2008.
1.4 Large(r) fires only
sizecut <- 10.
fpafod.large <- fpafod[fpafod$AREA_HA > sizecut,]
fpafod.large.tablecause <- table(fpafod.large$FIRE_YEAR, fpafod.large$NWCG_REPORTING_AGENCY)
mosaicplot(fpafod.large.tablecause, cex.axis=0.6, las=2, color=mosaiccolor, main="Large Fires by Organization")
# 1 Lightning; 2 Equipment Use; 3 Smoking; 4 Campfire; 5 Debris Burning; 6 Railroad; 7 Arson; 8 Children;
# 9 Miscellaneous; 10 Fireworks; 11 Power Line; 12 Structure; 13 Missing/Undefined
fpafod.large.tablecause <- table(fpafod.large$FIRE_YEAR, fpafod.large$STAT_CAUSE_CODE)
mosaicplot(fpafod.large.tablecause, cex.axis=0.6, las=2, color=mosaiccolor, main="Large Fires by Cause")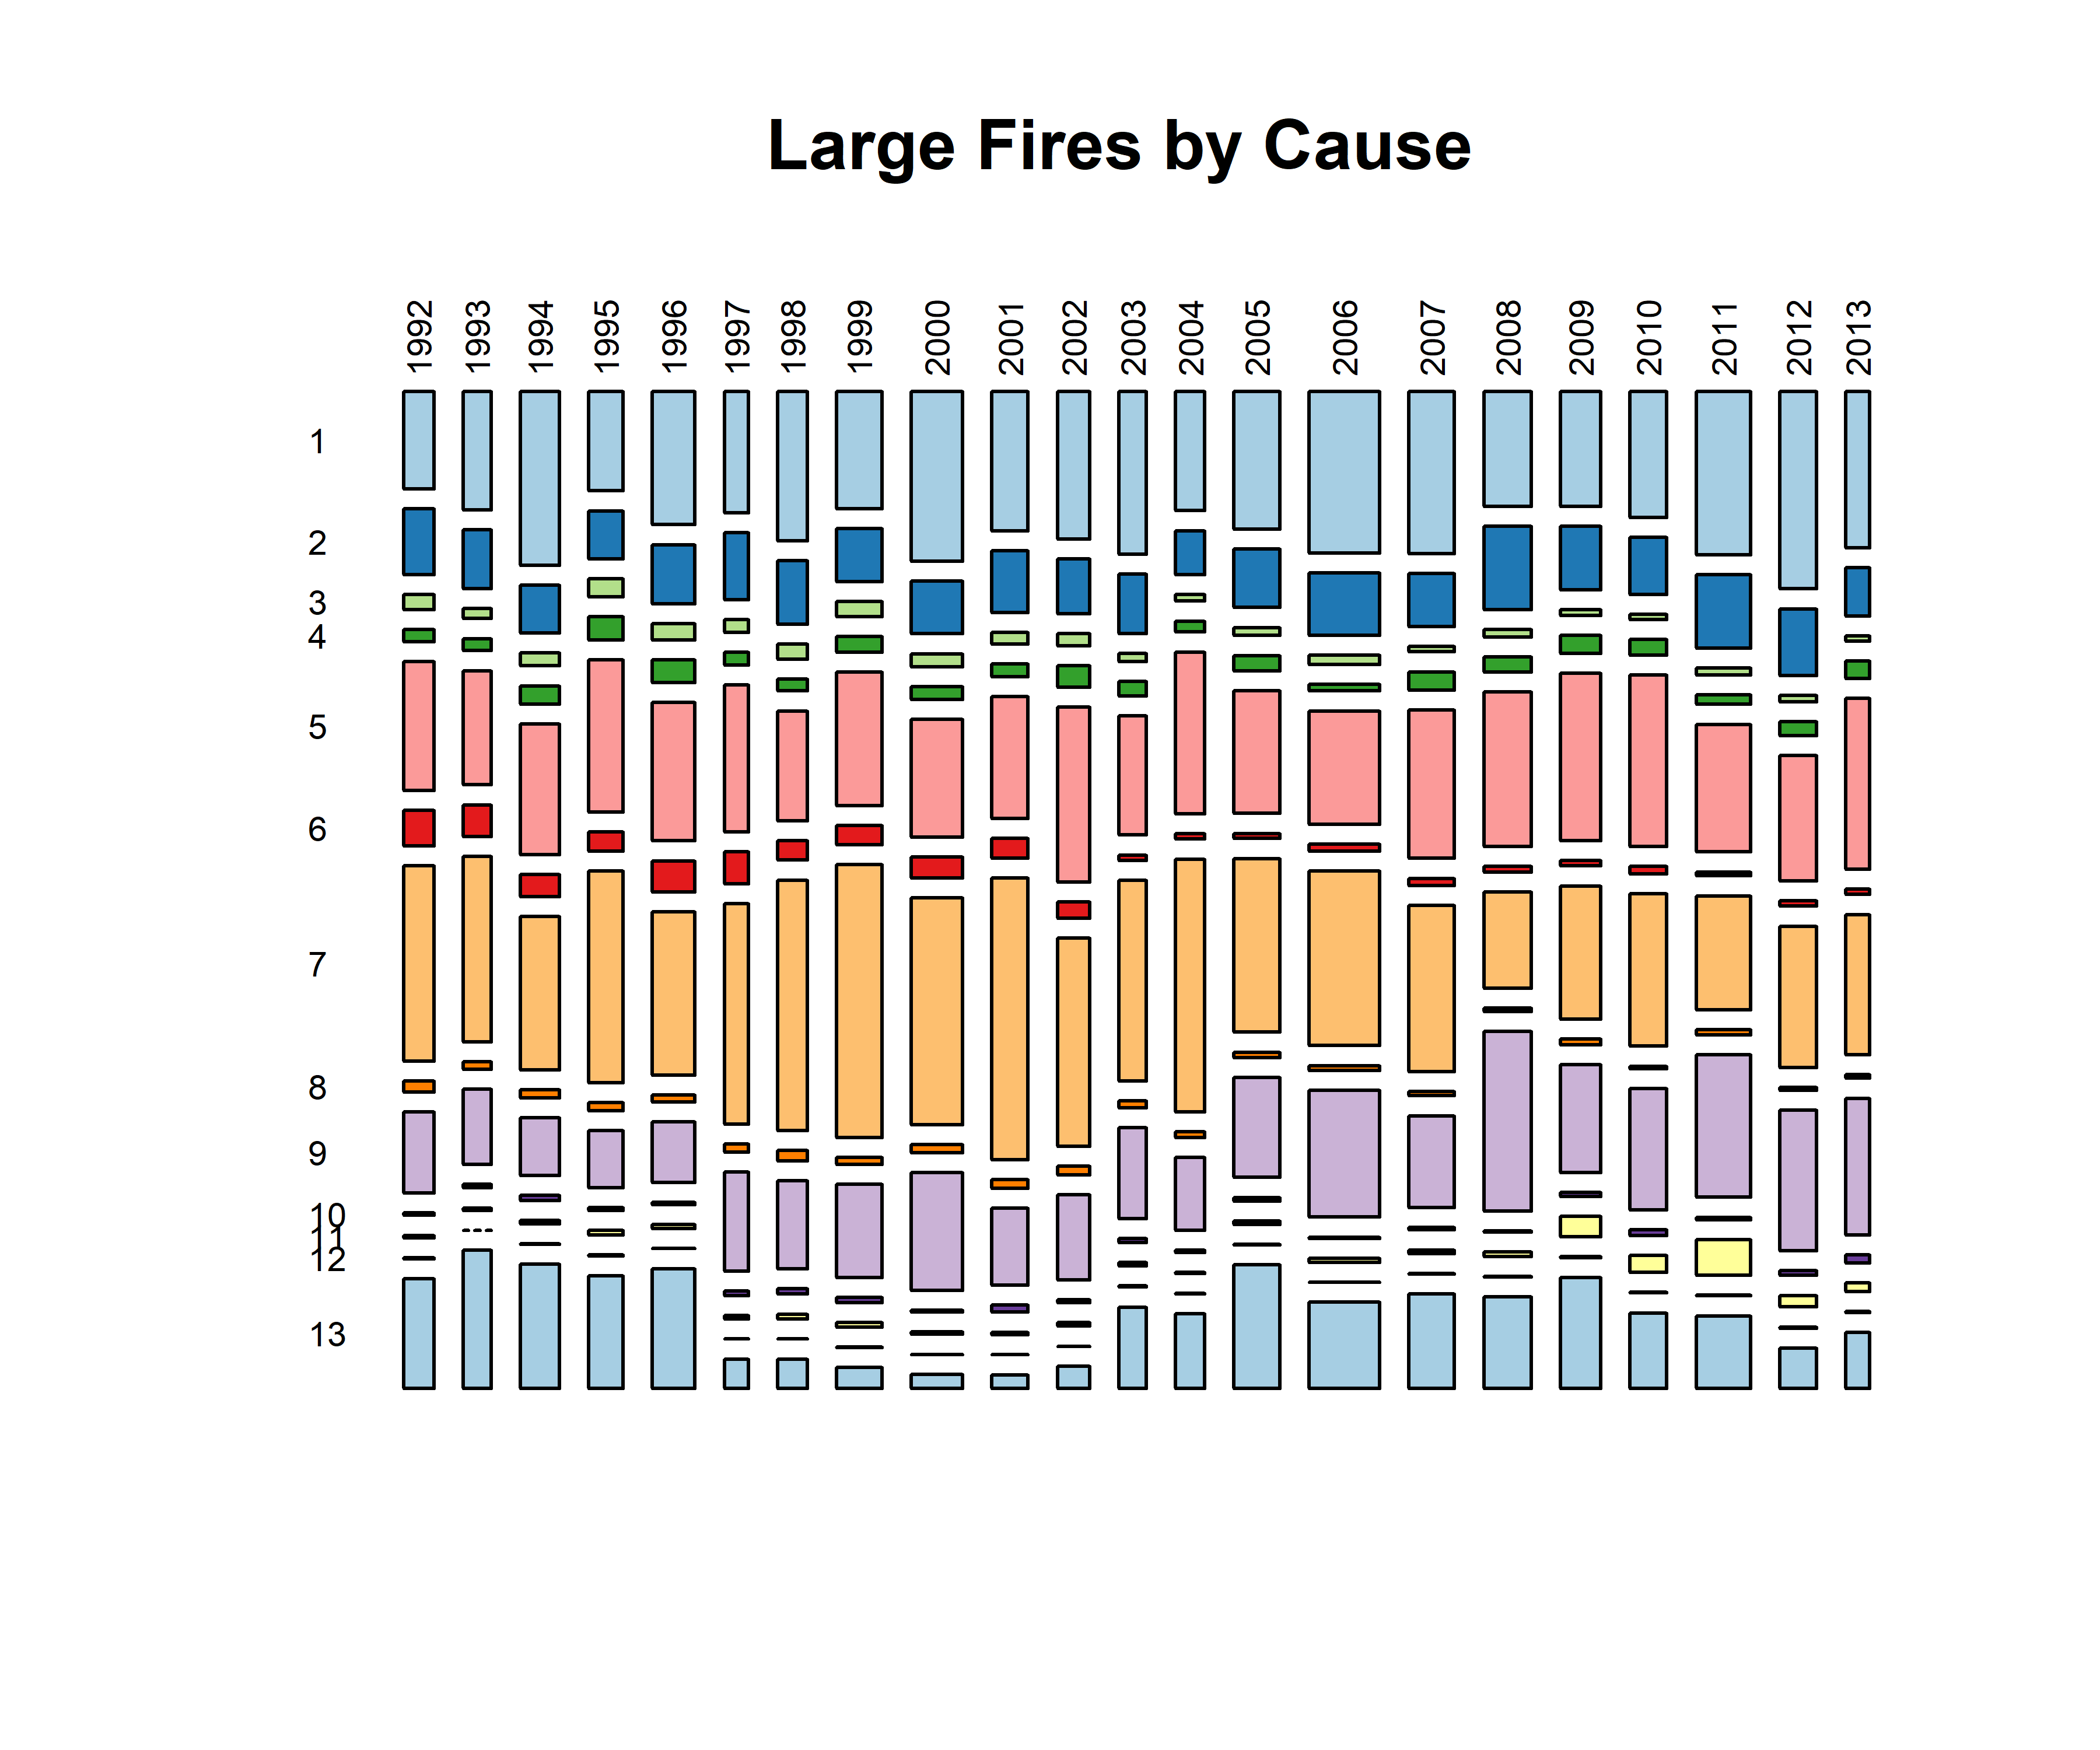
# 1 Lightning; 2 Equipment Use; 3 Smoking; 4 Campfire; 5 Debris Burning; 6 Railroad; 7 Arson; 8 Children;
# 9 Miscellaneous; 10 Fireworks; 11 Power Line; 12 Structure; 13 Missing/Undefined
fpafod.large.tableagencycause <- table(fpafod.large$NWCG_REPORTING_AGENCY, fpafod.large$STAT_CAUSE_CODE)
mosaicplot(fpafod.large.tableagencycause, cex.axis=0.6, las=2, color=mosaiccolor,
  main="Large Fires by Agency and Cause")
# 1 Lightning; 2 Equipment Use; 3 Smoking; 4 Campfire; 5 Debris Burning; 6 Railroad; 7 Arson; 8 Children;
# 9 Miscellaneous; 10 Fireworks; 11 Power Line; 12 Structure; 13 Missing/Undefined
fpafod.large.tablecause <- table(fpafod.large$FIRE_YEAR[fpafod.large$NWCG_REPORTING_AGENCY =="ST/C&L"],
  fpafod.large$STAT_CAUSE_CODE[fpafod.large$NWCG_REPORTING_AGENCY =="ST/C&L"])
mosaicplot(fpafod.large.tablecause, cex.axis=0.6, las=2, color=mosaiccolor, main="ST/C&L Large Fires by Cause")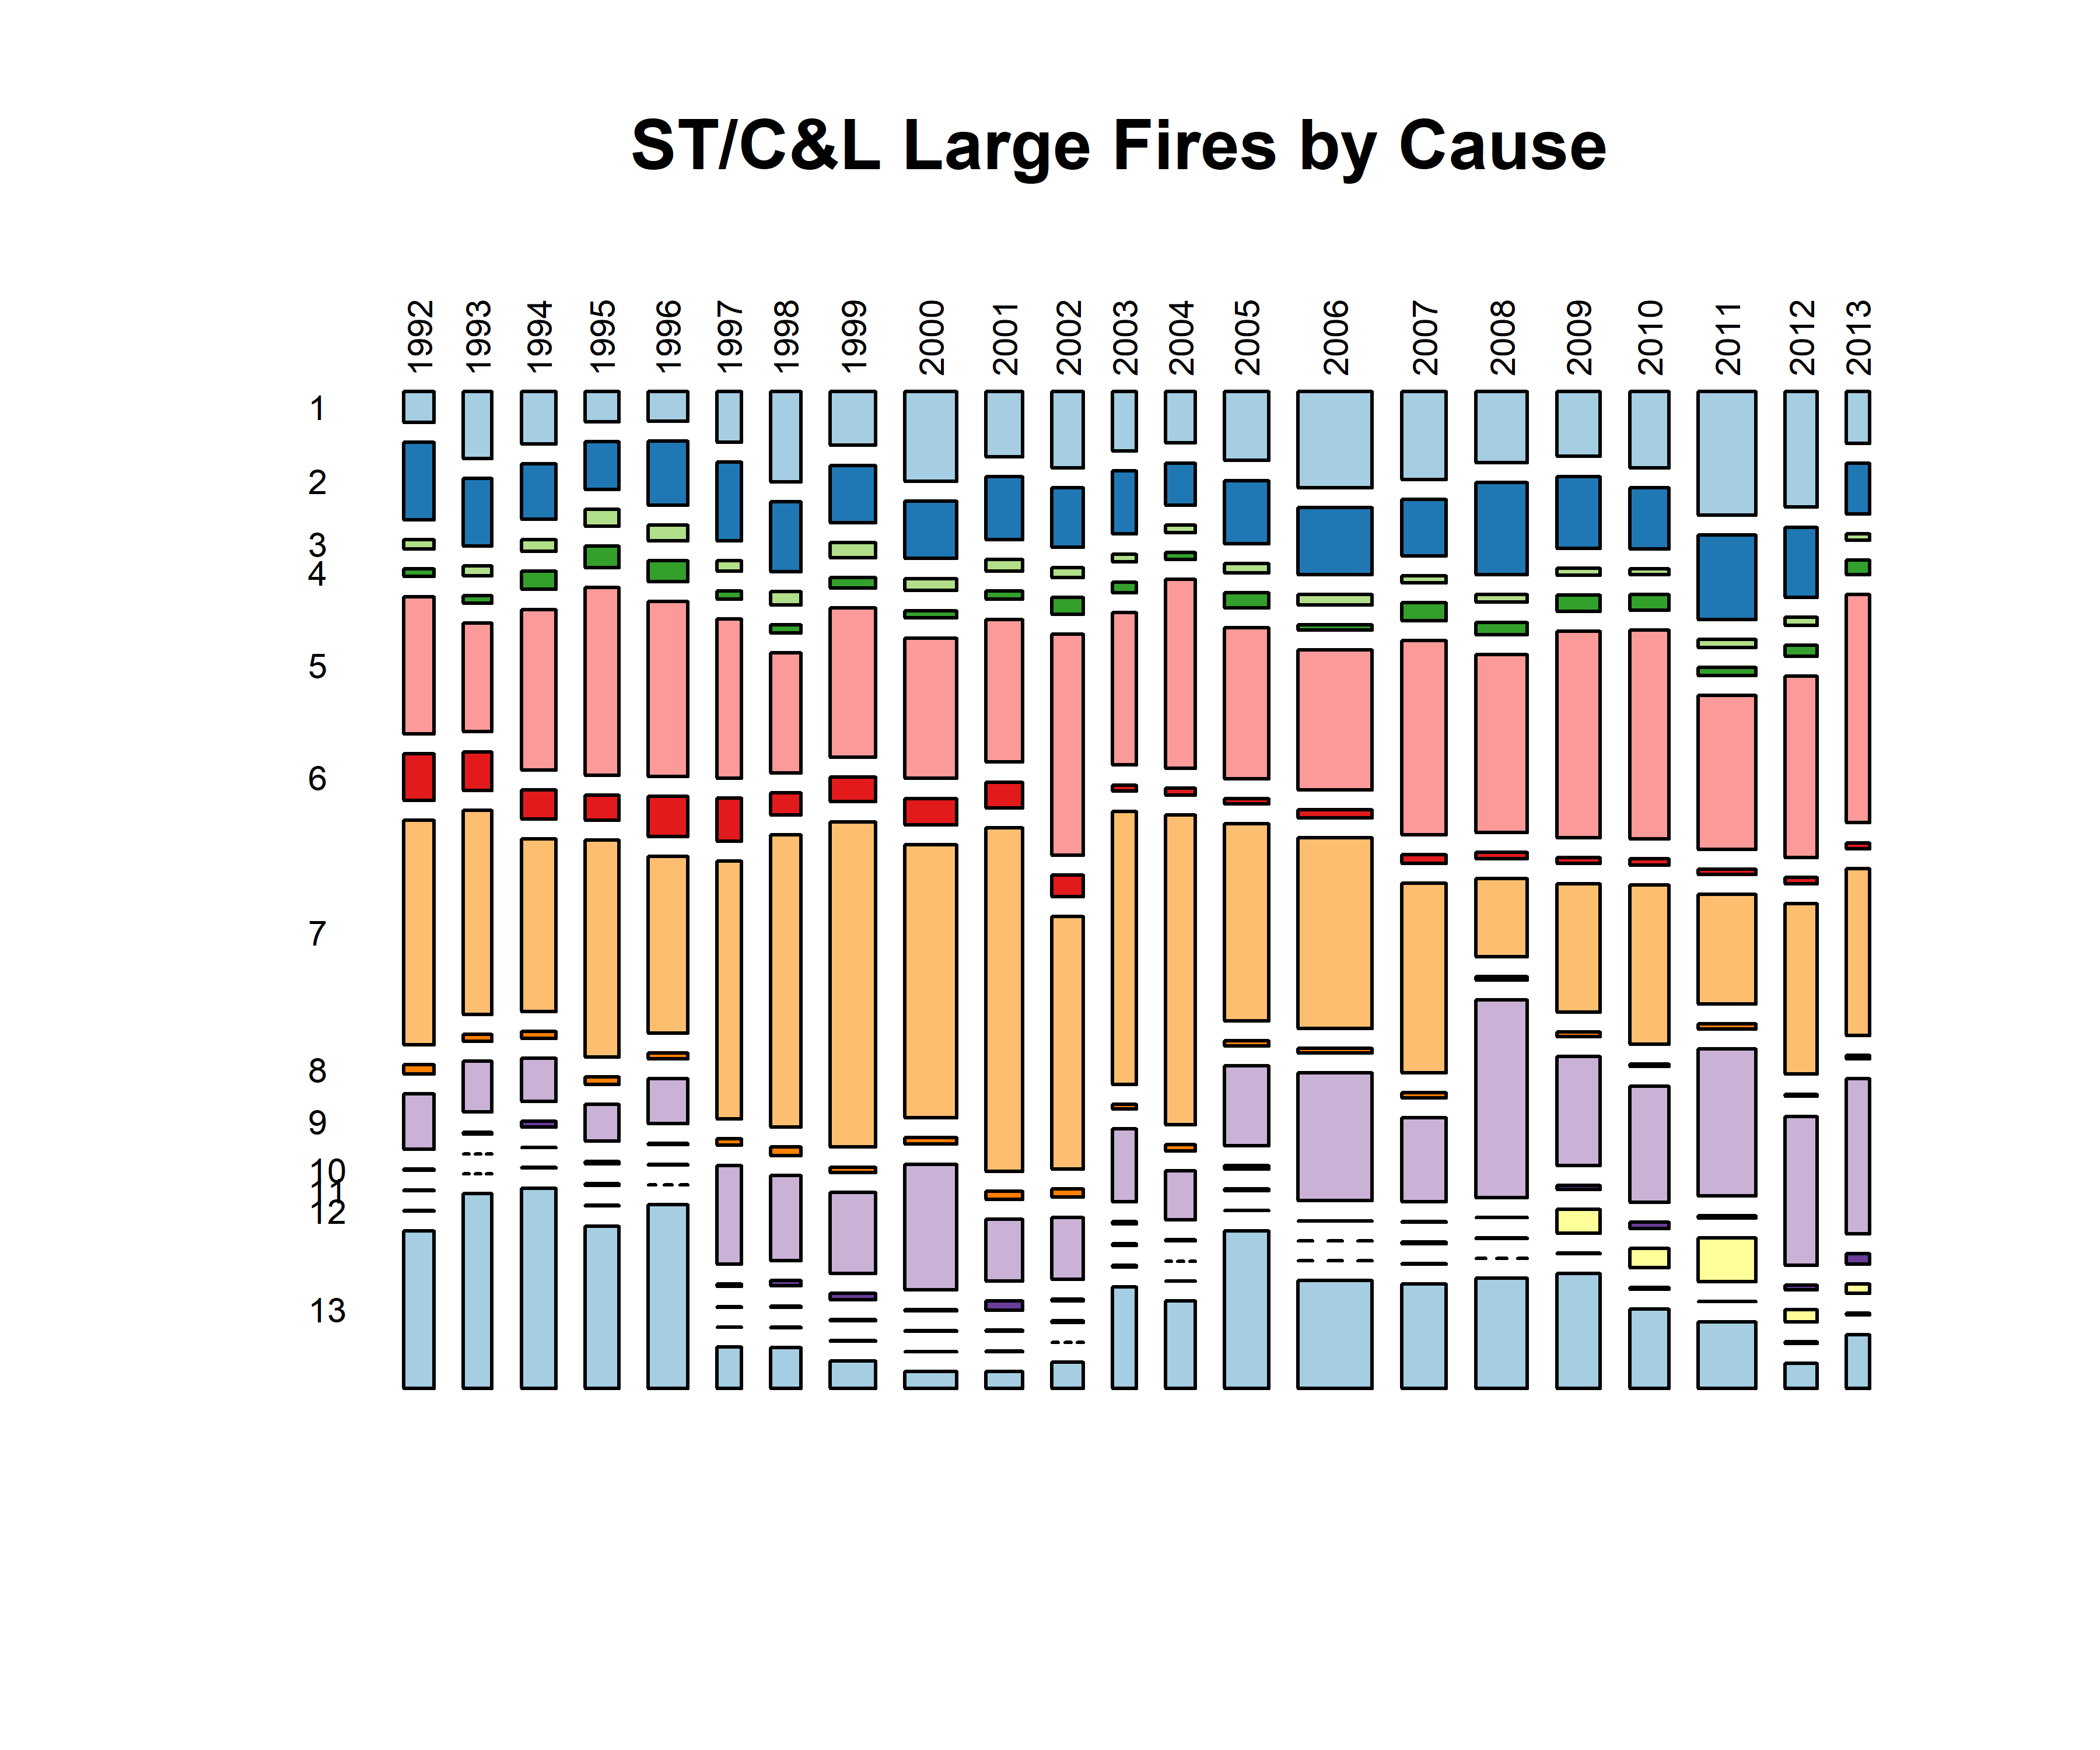
1.4.1 Cause summary
Histograms by cause
# 1 Lightning; 2 Equipment Use; 3 Smoking; 4 Campfire; 5 Debris Burning; 6 Railroad; 7 Arson; 8 Children;
# 9 Miscellaneous; 10 Fireworks; 11 Power Line; 12 Structure; 13 Missing/Undefined
oldpar <- par(mfrow=c(2,2))
ymax <- 500
hist(fpafod.large$DISCOVERY_DOY[fpafod.large$STAT_CAUSE_CODE == 1], breaks=seq(-0.5,366.5,by=1), freq=-TRUE,
  ylim=c(0,ymax), xlim=c(0,400), xlab="", main="Large Fires DISCOVERY_DOY (1 Lightning)")
hist(fpafod.large$DISCOVERY_DOY[fpafod.large$STAT_CAUSE_CODE == 2], breaks=seq(-0.5,366.5,by=1), freq=-TRUE,
  ylim=c(0,ymax), xlim=c(0,400), xlab="", main="Large Fires DISCOVERY_DOY (2 Equipment Use)")
hist(fpafod.large$DISCOVERY_DOY[fpafod.large$STAT_CAUSE_CODE == 3], breaks=seq(-0.5,366.5,by=1), freq=-TRUE,
  ylim=c(0,ymax), xlim=c(0,400), xlab="", main="Large Fires DISCOVERY_DOY (3 Smoking)")
hist(fpafod.large$DISCOVERY_DOY[fpafod.large$STAT_CAUSE_CODE == 4], breaks=seq(-0.5,366.5,by=1), freq=-TRUE,
  ylim=c(0,ymax), xlim=c(0,400), xlab="", main="Large Fires DISCOVERY_DOY (4 Campfire)")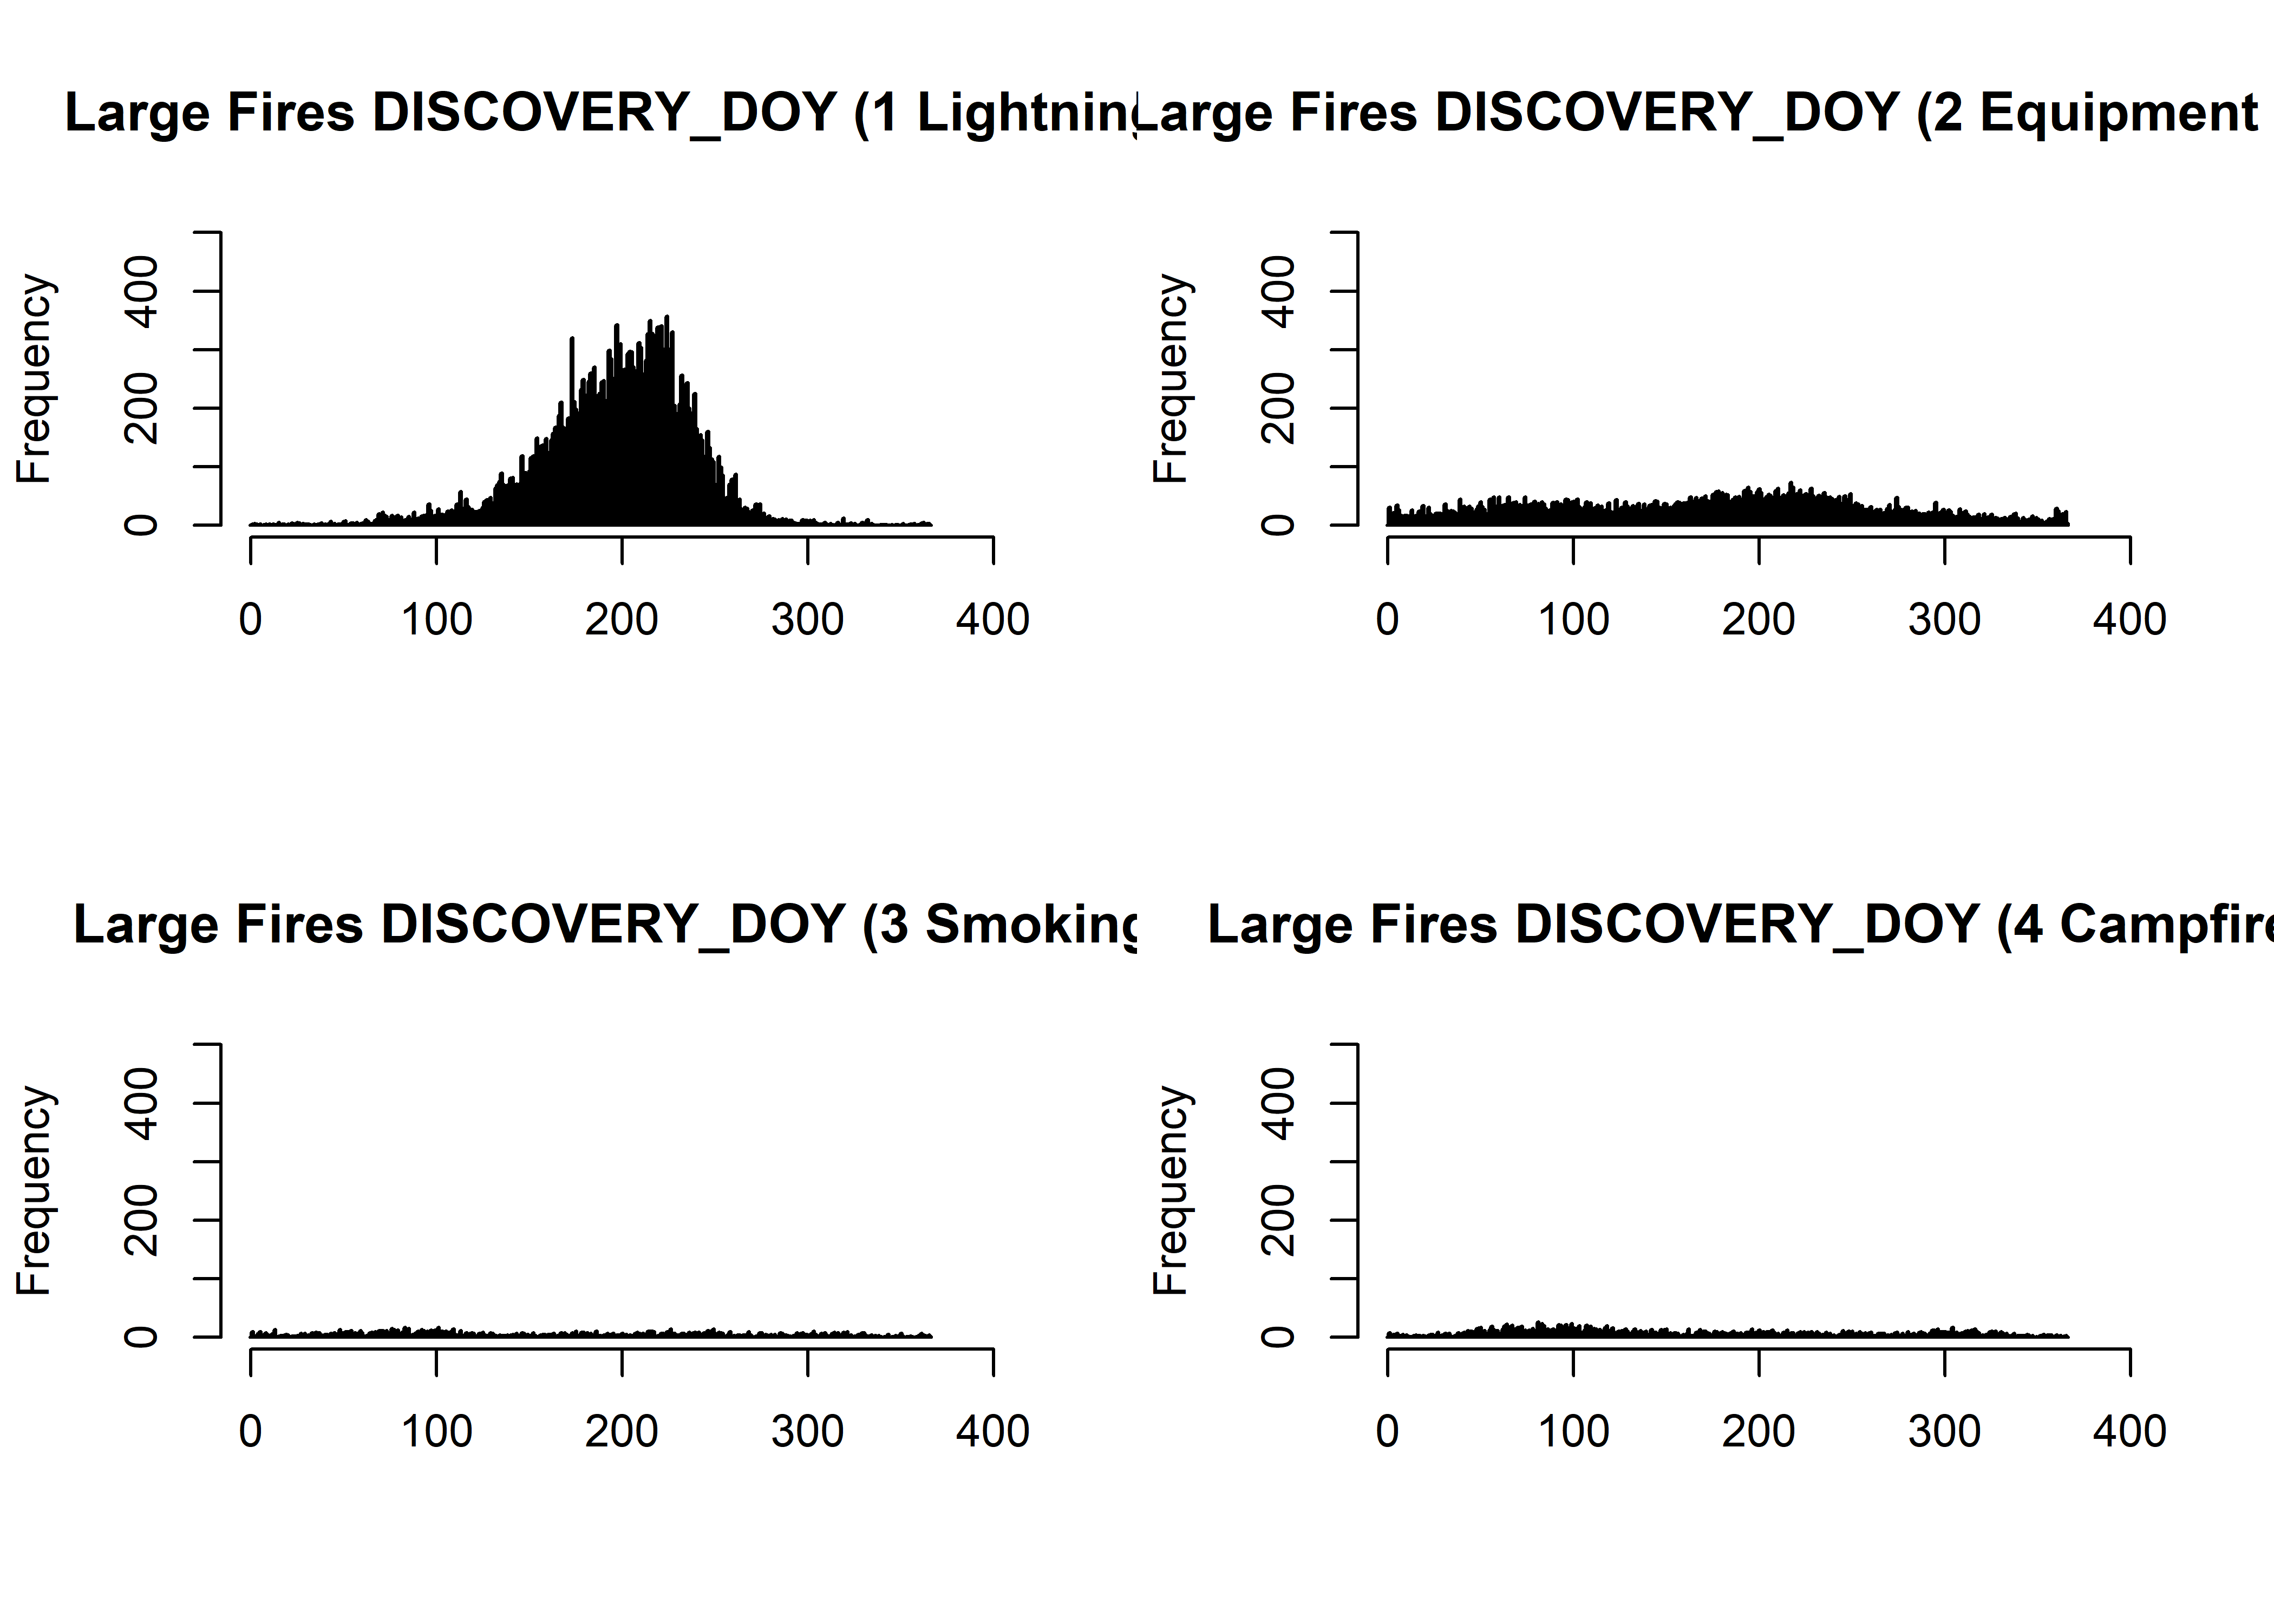
hist(fpafod.large$DISCOVERY_DOY[fpafod.large$STAT_CAUSE_CODE == 5], breaks=seq(-0.5,366.5,by=1), freq=-TRUE,
  ylim=c(0,ymax), xlim=c(0,400), xlab="", main="Large Fires DISCOVERY_DOY (5 Debris Burning)")
hist(fpafod.large$DISCOVERY_DOY[fpafod.large$STAT_CAUSE_CODE == 6], breaks=seq(-0.5,366.5,by=1), freq=-TRUE,
  ylim=c(0,ymax), xlim=c(0,400), xlab="", main="Large Fires DISCOVERY_DOY (6 Railroad)")
hist(fpafod.large$DISCOVERY_DOY[fpafod.large$STAT_CAUSE_CODE == 7], breaks=seq(-0.5,366.5,by=1), freq=-TRUE,
  ylim=c(0,ymax), xlim=c(0,400), xlab="", main="Large Fires DISCOVERY_DOY (7 Arson)")
hist(fpafod.large$DISCOVERY_DOY[fpafod.large$STAT_CAUSE_CODE == 8], breaks=seq(-0.5,366.5,by=1), freq=-TRUE,
ylim=c(0,ymax), xlim=c(0,400), xlab="", main="Large Fires DISCOVERY_DOY (8 Children)") 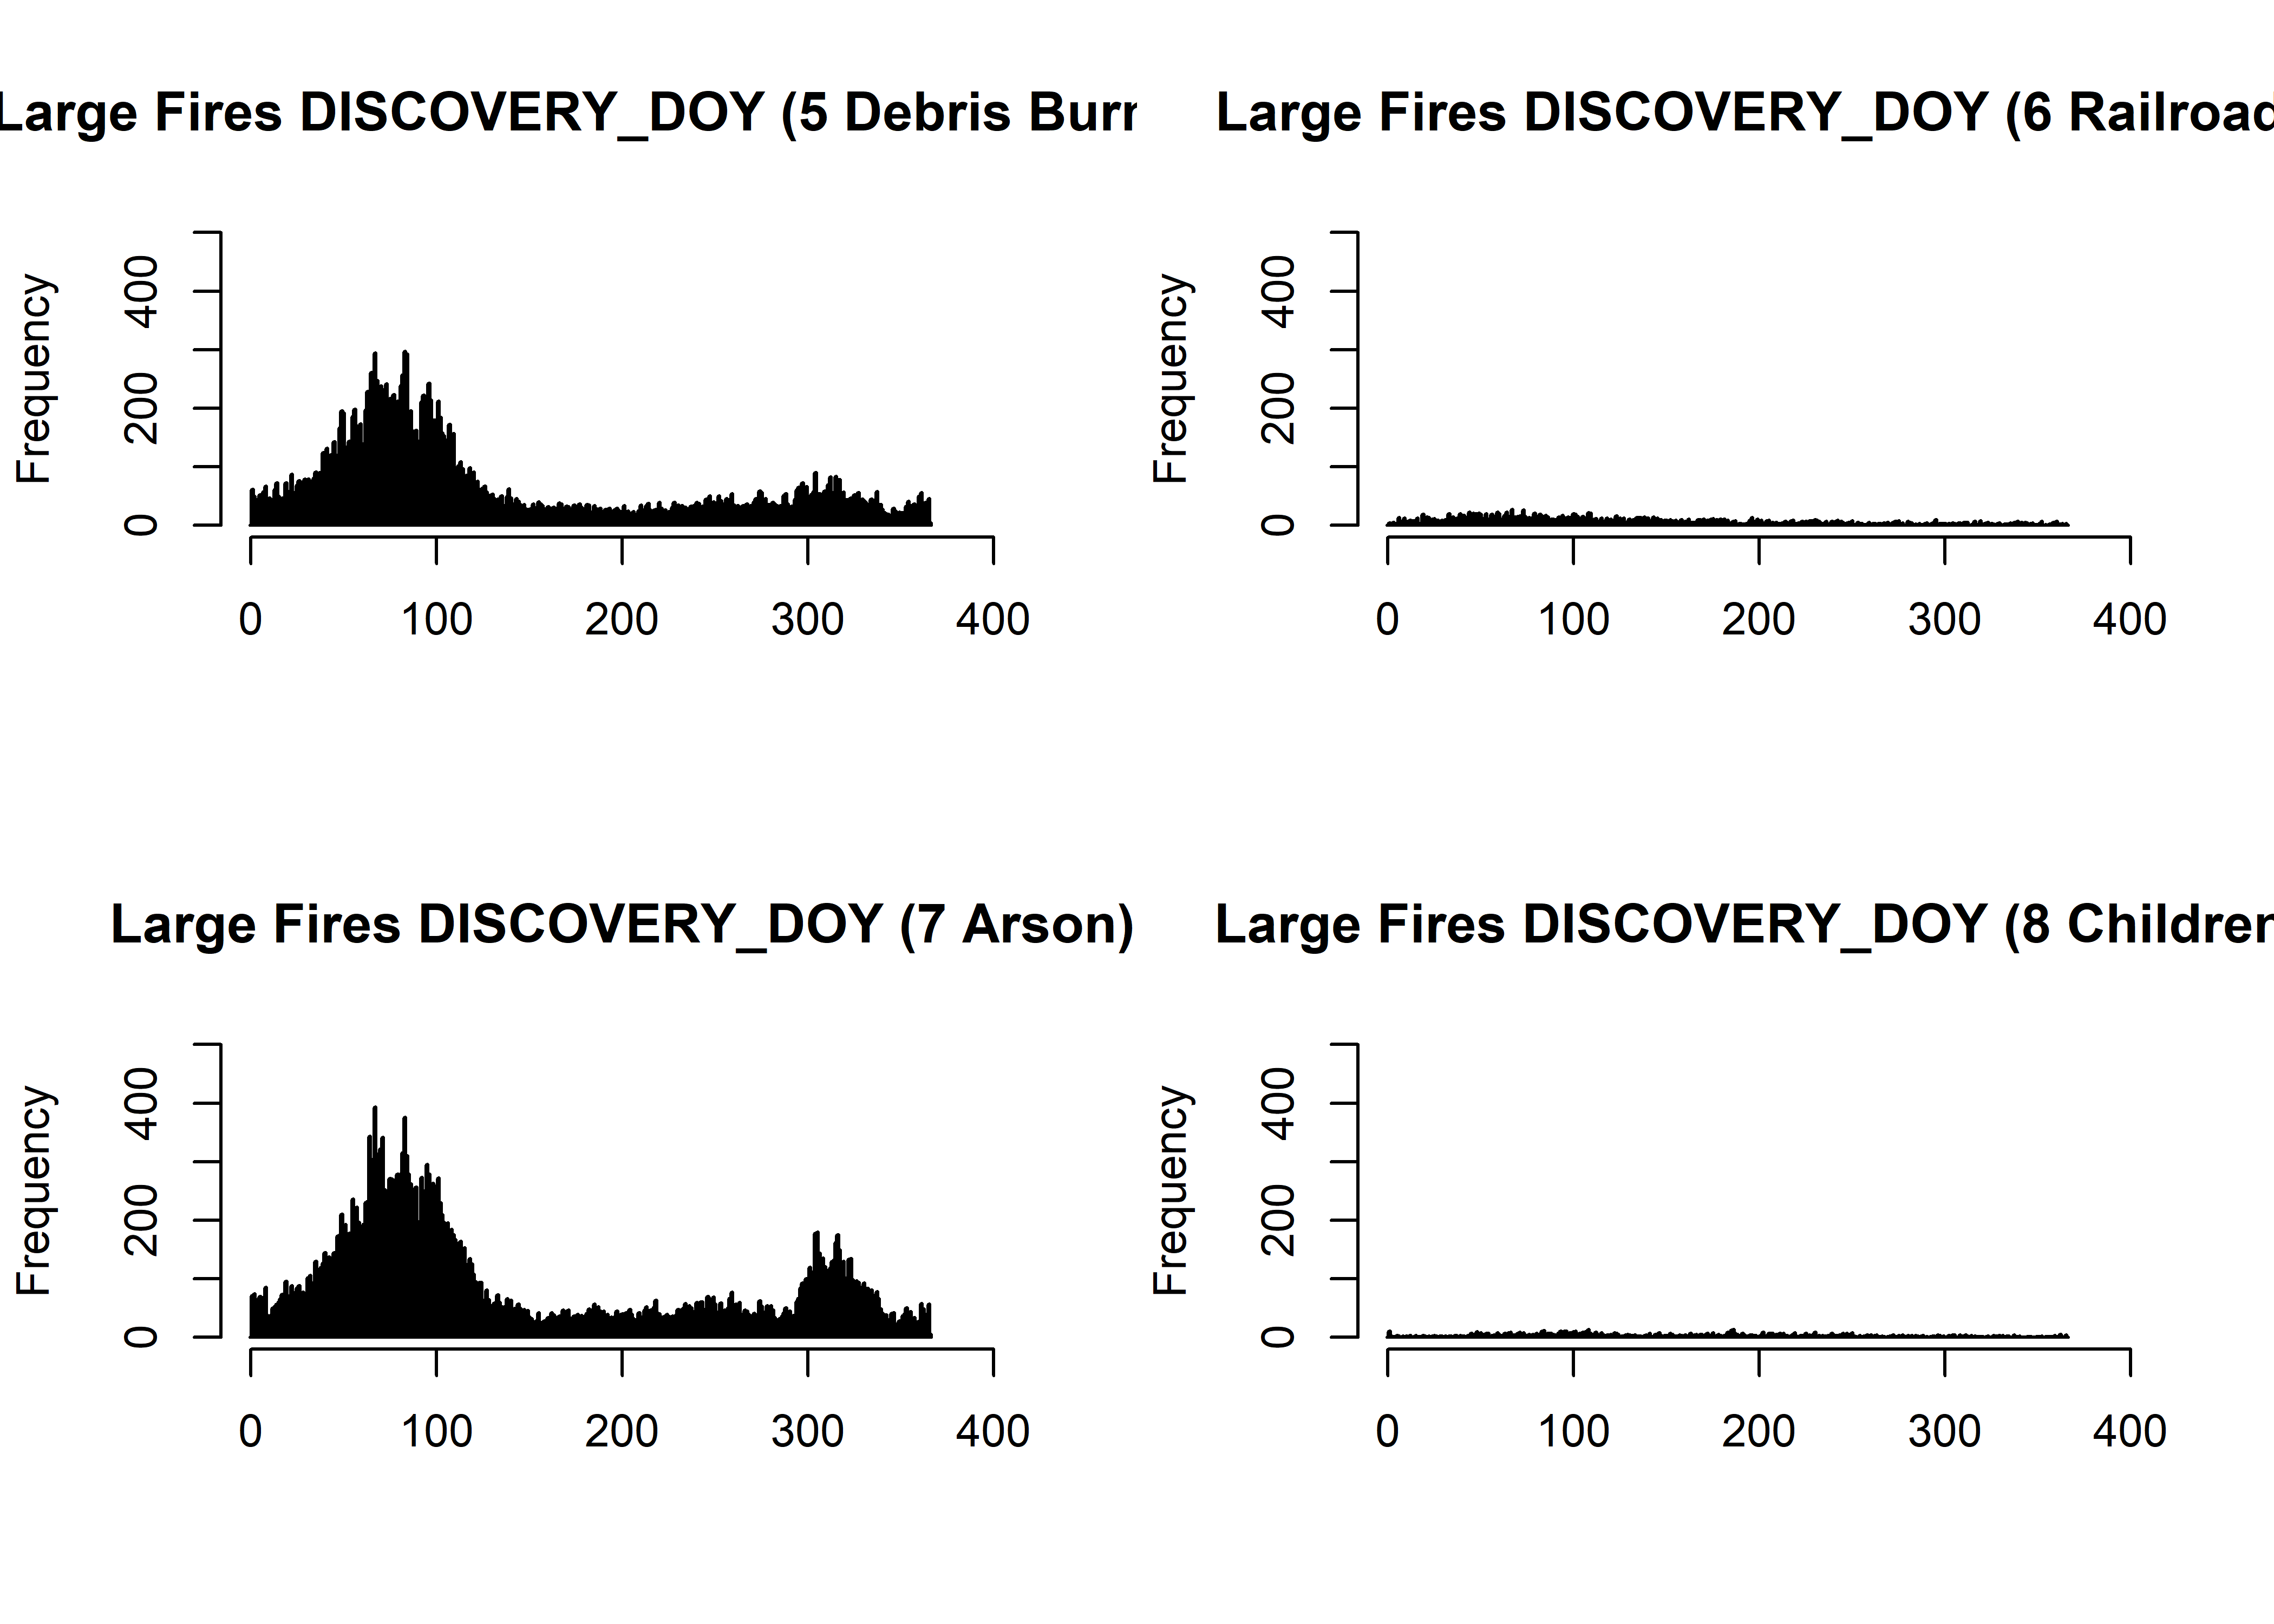
hist(fpafod.large$DISCOVERY_DOY[fpafod.large$STAT_CAUSE_CODE == 9], breaks=seq(-0.5,366.5,by=1), freq=-TRUE,
  ylim=c(0,ymax), xlim=c(0,400), xlab="", main="Large Fires DISCOVERY_DOY (9 Miscellaneous)")
hist(fpafod.large$DISCOVERY_DOY[fpafod.large$STAT_CAUSE_CODE == 10], breaks=seq(-0.5,366.5,by=1), freq=-TRUE,
  ylim=c(0,ymax), xlim=c(0,400), xlab="", main="Large Fires DISCOVERY_DOY (10 Fireworks)")
hist(fpafod.large$DISCOVERY_DOY[fpafod.large$STAT_CAUSE_CODE == 11], breaks=seq(-0.5,366.5,by=1), freq=-TRUE,
  ylim=c(0,ymax), xlim=c(0,400), xlab="", main="Large Fires DISCOVERY_DOY (11 Power Line)")
hist(fpafod.large$DISCOVERY_DOY[fpafod.large$STAT_CAUSE_CODE == 12], breaks=seq(-0.5,366.5,by=1), freq=-TRUE,
  ylim=c(0,ymax), xlim=c(0,400), xlab="", main="Large Fires DISCOVERY_DOY (12 Structure)")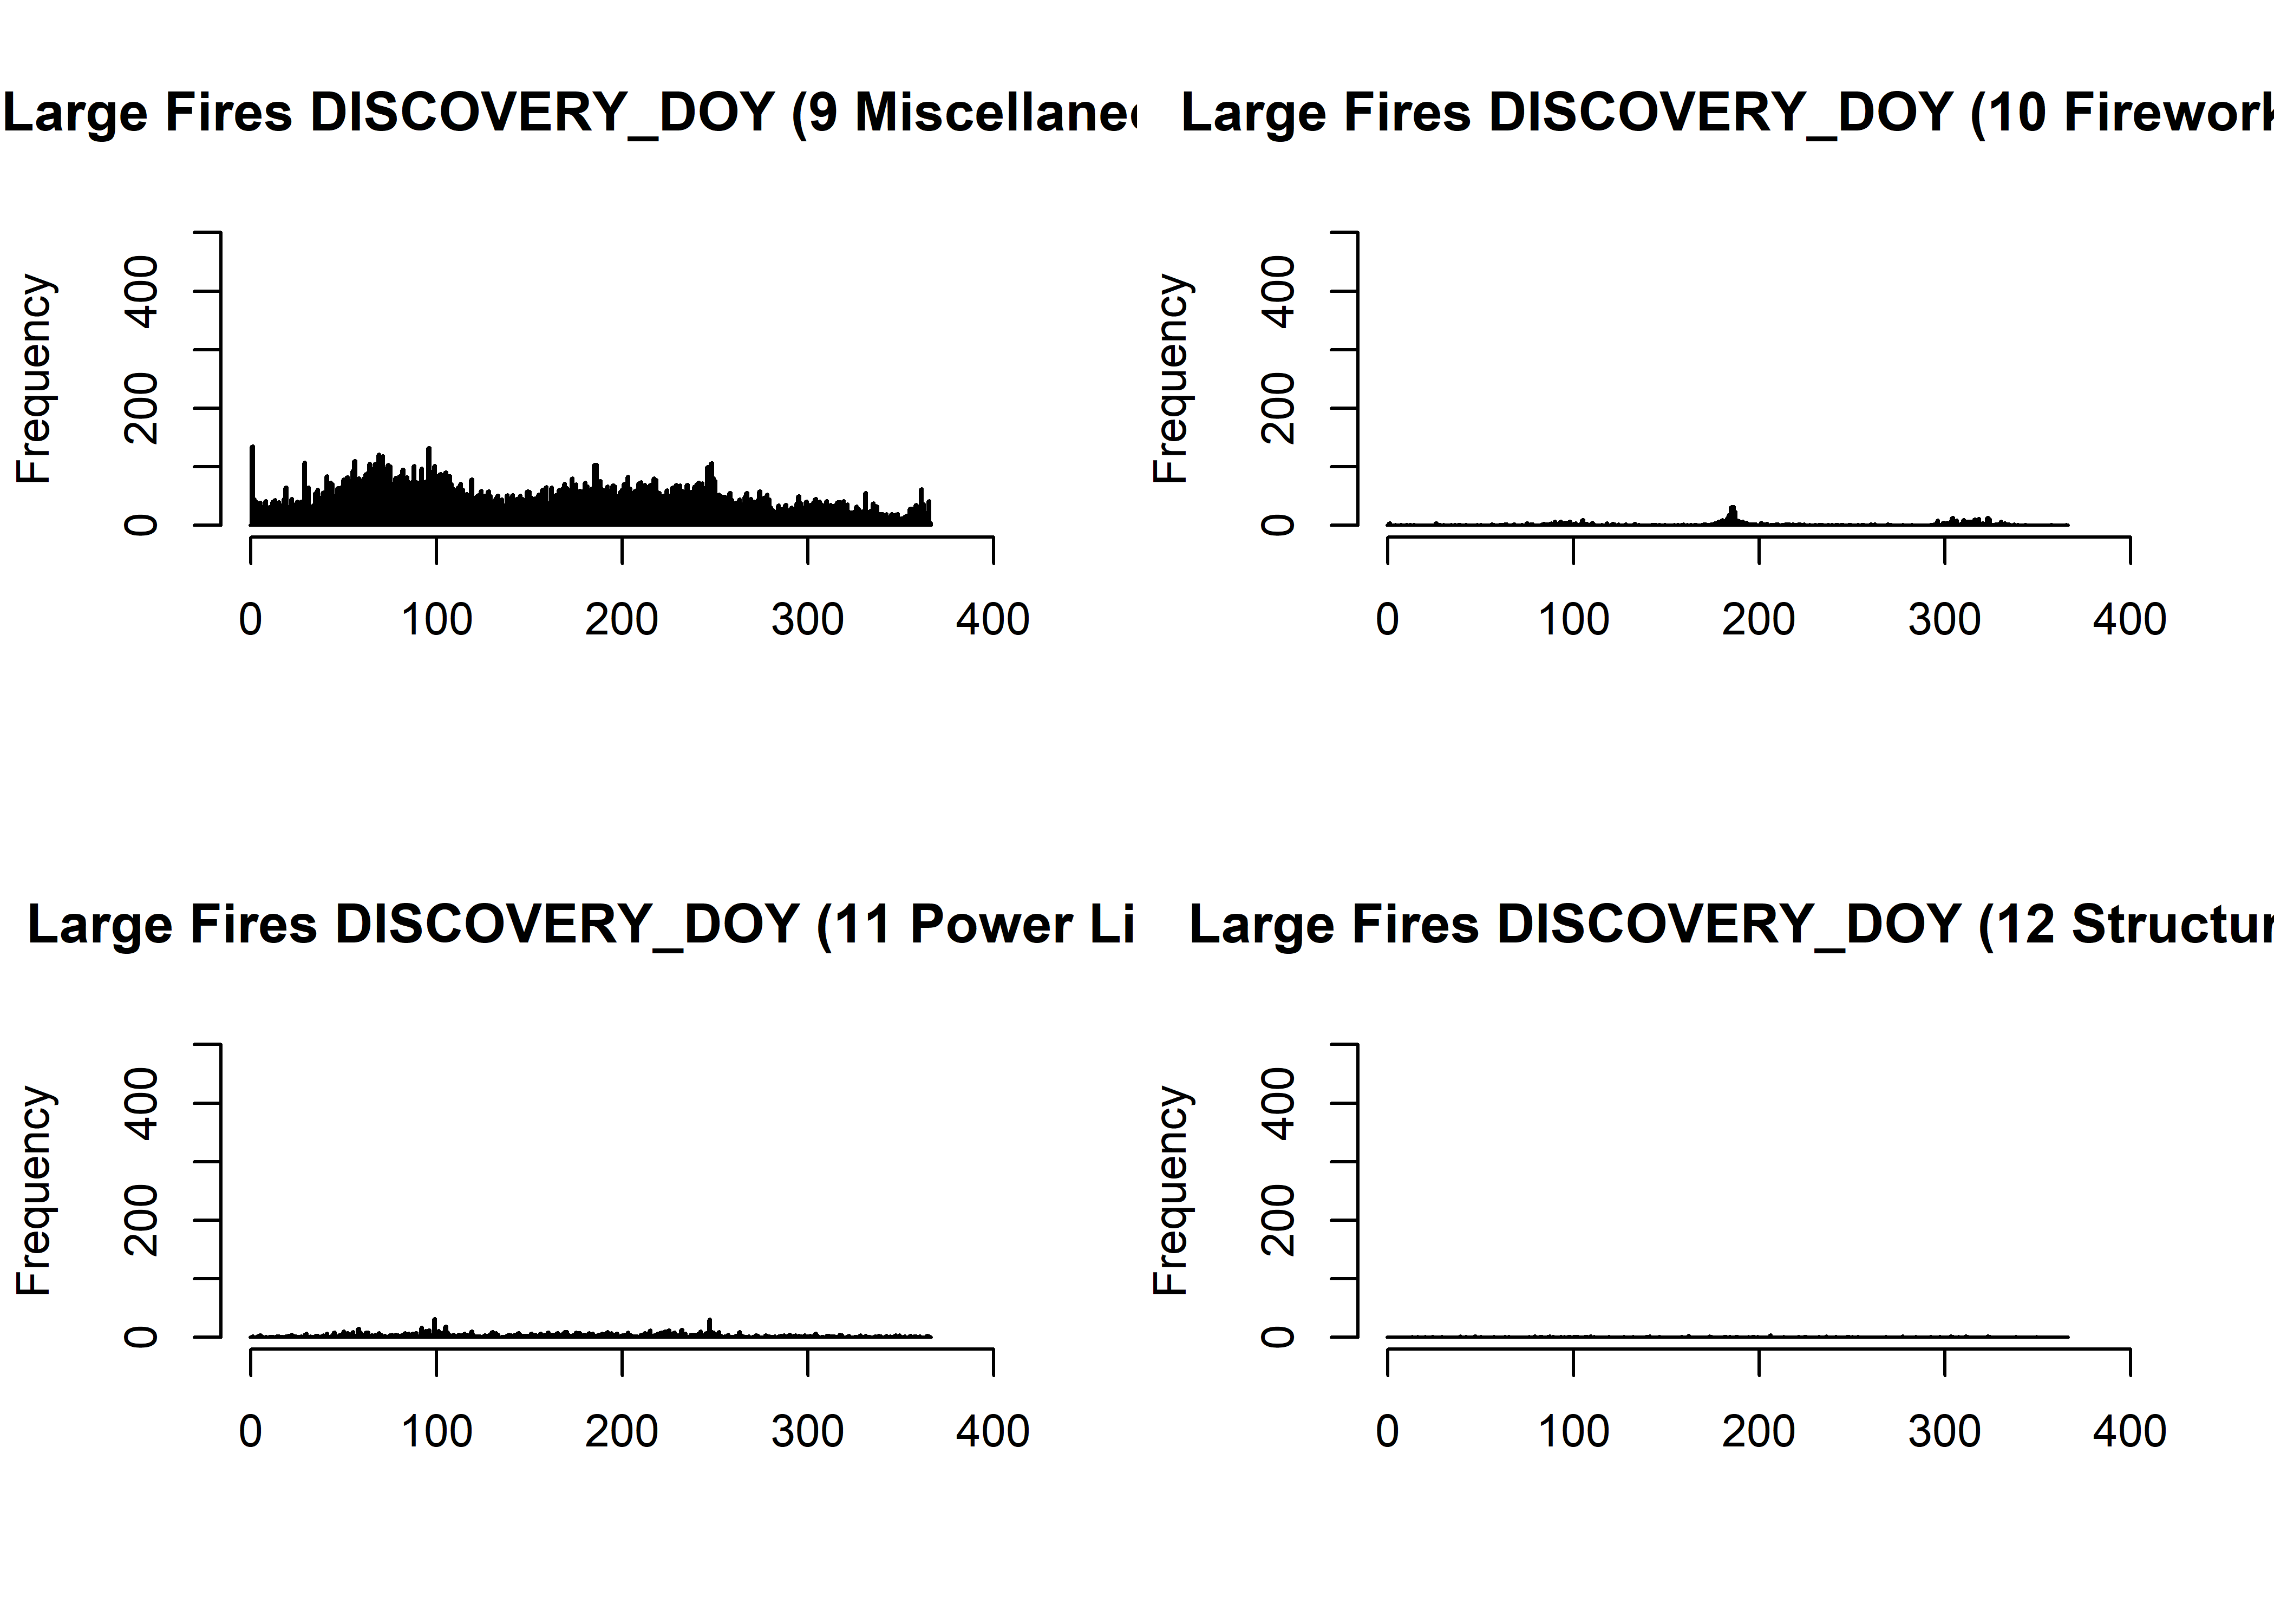
hist(fpafod.large$DISCOVERY_DOY[fpafod.large$STAT_CAUSE_CODE == 13], breaks=seq(-0.5,366.5,by=1), freq=-TRUE,
  ylim=c(0,ymax), xlim=c(0,400), xlab="", main="Large Fires DISCOVERY_DOY (13 Missing/Undefined)")
par(oldpar)
proc.time() - ptm## user system elapsed
## 13.03 -7.00 7.30