Federal Wildland Fire Occurrence Data (FWFOD) Start-Day Anomalies
1 Introduction
The Federal Wildland Fire Occurrence Data – http://wildfire.cr.usgs.gov/firehistory/data.html is perhaps the longest U.S. fire-start data set, but has a significant probem that precludes its use here.
The data set has been recently updated (April 2016) to include data from 2015, but the start-day issue identified previously is still present, as will be demonstrated here.
The data come from the file fh_all_1980_2015.dbf (04/22/2016 14:11, downloaded on 30 May 2016).
1.1 Overview
The main unusual feature of this data set is the underrepresentation of fire starts in the first nine days of each month for the first nine months of the year, as will become apparent in this analysis. The data are read here directly from the .dbf file using the read.dbf() function (to minimize the chance that “external” (to R) manipulations of the data might play a role in the unusual features that will emerge from this data set.)
Load the neccessary libaries:
library(foreign)
library(RODBC)
library(maps)
library(lubridate)
Read the data:
filename <- "e:/Projects/fire/DailyFireStarts/data/FWFOD/source/fh_all_1980_2015.dbf"
fwfod <- read.dbf(filename, as.is=TRUE)
List the variables in the data set, print the first and last records, and summarize the data.
str(fwfod, strict.width="cut") # Variables in the data set## 'data.frame': 726888 obs. of 31 variables:
## $ ORGANIZATI: chr "BIA" "BIA" "BIA" "BIA" ...
## $ UNIT : chr "EOR" "WER" "PAR" "PAR" ...
## $ SUBUNIT : chr "OKMIA" "AZPPA" "CASCA" "CASCA" ...
## $ SUBUNIT2 : chr NA NA NA NA ...
## $ FIREID : chr "387256" "409416" "466072" "466609" ...
## $ FIRENAME : chr "BLAKEBURN" "FALSE08" "CAMPO RES" "FLS AL #18" ...
## $ FIRENUMBER: chr "9" "28" "3" "99" ...
## $ FIRECODE : chr NA NA NA "BF4X" ...
## $ CAUSE : chr "Human" NA NA NA ...
## $ SPECCAUSE : int 0 0 0 0 0 0 0 0 0 0 ...
## $ STATCAUSE : int 0 0 0 0 0 0 0 0 0 0 ...
## $ SIZECLASS : chr "C" "NR" "NR" "NR" ...
## $ SIZECLASSN: num 3 0 0 0 0 2 0 0 0 0 ...
## $ PROTECTION: int 8 1 1 6 1 8 8 8 8 8 ...
## $ FIREPROTTY: int 48 51 51 56 51 48 48 48 48 48 ...
## $ FIRETYPE : int 4 5 5 5 5 4 4 4 4 4 ...
## $ YEAR_ : chr "2000" "1994" "2000" "2004" ...
## $ STARTDATED: Date, format: "2000-04-08" NA NA ...
## $ CONTRDATED: Date, format: NA NA NA ...
## $ OUTDATED : Date, format: "2000-04-09" NA NA ...
## $ GACC : chr "SACC" "SWCC" "OSCC" "OSCC" ...
## $ DISPATCH : chr "Arkansas-Oklahoma Interagency Coordination Center" "Southeast Zone" "Riverside" ""..
## $ GACCN : num 109 110 108 108 108 104 106 106 106 106 ...
## $ STATE : chr "Oklahoma" "Arizona" "California" "California" ...
## $ STATE_FIPS: chr "40" "04" "06" "06" ...
## $ FIPS : num 40 4 6 6 6 6 53 53 53 53 ...
## $ DLATITUDE : num 34.8 32 33.5 33.6 32.9 ...
## $ DLONGITUDE: num -94.7 -111.6 -116.4 -116.3 -116.3 ...
## $ TOTALACRES: num 93 0 0 0 0 1 0 0 0 0 ...
## $ TRPGENCAUS: int 0 0 0 0 0 0 0 0 0 0 ...
## $ TRPSPECCAU: int 0 0 0 0 0 0 0 0 0 0 ...
## - attr(*, "data_types")= chr "C" "C" "C" "C" ...head(fwfod); tail(fwfod)## ORGANIZATI UNIT SUBUNIT SUBUNIT2 FIREID FIRENAME FIRENUMBER FIRECODE CAUSE SPECCAUSE
## 1 BIA EOR OKMIA <NA> 387256 BLAKEBURN 9 <NA> Human 0
## 2 BIA WER AZPPA <NA> 409416 FALSE08 28 <NA> <NA> 0
## 3 BIA PAR CASCA <NA> 466072 CAMPO RES 3 <NA> <NA> 0
## 4 BIA PAR CASCA <NA> 466609 FLS AL #18 99 BF4X <NA> 0
## 5 BIA PAR CASCA <NA> 615885 False Alarm # 0709 98 DUX1 Human 0
## 6 BIA NWR WAQNT <NA> 443796 LONG V 28 <NA> Human 0
## STATCAUSE SIZECLASS SIZECLASSN PROTECTION FIREPROTTY FIRETYPE YEAR_ STARTDATED CONTRDATED OUTDATED
## 1 0 C 3 8 48 4 2000 2000-04-08 <NA> 2000-04-09
## 2 0 NR 0 1 51 5 1994 <NA> <NA> <NA>
## 3 0 NR 0 1 51 5 2000 <NA> <NA> <NA>
## 4 0 NR 0 6 56 5 2004 <NA> <NA> <NA>
## 5 0 NR 0 1 51 5 2007 <NA> <NA> <NA>
## 6 0 B 2 8 48 4 1996 <NA> <NA> 1996-11-13
## GACC DISPATCH GACCN STATE STATE_FIPS FIPS DLATITUDE
## 1 SACC Arkansas-Oklahoma Interagency Coordination Center 109 Oklahoma 40 40 34.8295
## 2 SWCC Southeast Zone 110 Arizona 04 4 32.0001
## 3 OSCC Riverside 108 California 06 6 33.5351
## 4 OSCC Riverside 108 California 06 6 33.5834
## 5 OSCC Monte Vista 108 California 06 6 32.9001
## 6 ONCC Howard Forest 104 California 06 6 39.8524
## DLONGITUDE TOTALACRES TRPGENCAUS TRPSPECCAU
## 1 -94.7188 93 0 0
## 2 -111.6007 0 0 0
## 3 -116.3892 0 0 0
## 4 -116.3175 0 0 0
## 5 -116.2673 0 0 0
## 6 -123.7303 1 0 0## ORGANIZATI UNIT SUBUNIT SUBUNIT2 FIREID FIRENAME FIRENUMBER FIRECODE
## 726883 BLM ID IDFRD Four Rivers Field Office 686531 RA 12 GEM CO 0 JZ3L
## 726884 NPS AKRO AKNOP Noatak National Preserve 688016 NAKOLIKUROK FA 23 804 JZ3L
## 726885 BLM AK AKAFS Alaska Fire Service 682037 False Alarm 16 0 JT1C
## 726886 BLM AK AKAFS Alaska Fire Service 683845 Wulik River 0 JZ3E
## 726887 BLM AK AKAFS Alaska Fire Service 682612 False Alarm 22 0 JZ2Y
## 726888 BLM AK AKAFS Alaska Fire Service 678764 False Alarm 04 0 JQ1M
## CAUSE SPECCAUSE STATCAUSE SIZECLASS SIZECLASSN PROTECTION FIREPROTTY FIRETYPE YEAR_ STARTDATED
## 726883 Unknown 0 0 NR 0 7 37 3 2015 2015-09-27
## 726884 Unknown 0 0 NR 0 2 52 5 2015 2015-07-24
## 726885 Unknown 0 0 NR 0 6 56 5 2015 2015-06-22
## 726886 Natural 0 0 F 6 6 16 1 2015 2015-07-24
## 726887 Unknown 0 0 NR 0 1 51 5 2015 2015-07-24
## 726888 Unknown 0 0 NR 0 6 56 5 2015 2015-05-23
## CONTRDATED OUTDATED GACC DISPATCH GACCN STATE STATE_FIPS FIPS
## 726883 <NA> <NA> AKCC Galena Fire Management Zone 101 Alaska 02 2
## 726884 <NA> <NA> AKCC Galena Fire Management Zone 101 Alaska 02 2
## 726885 <NA> <NA> AKCC Upper Yukon Fire Management Zone 101 Alaska 02 2
## 726886 2015-08-23 2015-08-23 AKCC Galena Fire Management Zone 101 Alaska 02 2
## 726887 <NA> <NA> AKCC Galena Fire Management Zone 101 Alaska 02 2
## 726888 <NA> <NA> AKCC Upper Yukon Fire Management Zone 101 Alaska 02 2
## DLATITUDE DLONGITUDE TOTALACRES TRPGENCAUS TRPSPECCAU
## 726883 67.75000 -160.4500 0.0 0 0
## 726884 67.75000 -160.4500 0.0 0 0
## 726885 67.90000 -144.8000 0.0 0 0
## 726886 67.91580 -163.6866 1744.7 1 0
## 726887 68.16667 -164.4500 0.0 0 0
## 726888 69.03333 -148.2500 0.0 0 0summary(fwfod)## ORGANIZATI UNIT SUBUNIT SUBUNIT2 FIREID
## Length:726888 Length:726888 Length:726888 Length:726888 Length:726888
## Class :character Class :character Class :character Class :character Class :character
## Mode :character Mode :character Mode :character Mode :character Mode :character
##
##
##
##
## FIRENAME FIRENUMBER FIRECODE CAUSE SPECCAUSE
## Length:726888 Length:726888 Length:726888 Length:726888 Min. : 0.000
## Class :character Class :character Class :character Class :character 1st Qu.: 0.000
## Mode :character Mode :character Mode :character Mode :character Median : 0.000
## Mean : 5.197
## 3rd Qu.: 5.000
## Max. :32.000
##
## STATCAUSE SIZECLASS SIZECLASSN PROTECTION FIREPROTTY FIRETYPE
## Min. :0.000 Length:726888 Min. :0.000 Min. :0.00 Min. : 0.000 Min. :0.0000
## 1st Qu.:0.000 Class :character 1st Qu.:1.000 1st Qu.:0.00 1st Qu.: 0.000 1st Qu.:0.0000
## Median :0.000 Mode :character Median :1.000 Median :1.00 Median :11.000 Median :1.0000
## Mean :1.488 Mean :1.695 Mean :1.43 Mean : 9.184 Mean :0.7755
## 3rd Qu.:1.000 3rd Qu.:2.000 3rd Qu.:1.00 3rd Qu.:11.000 3rd Qu.:1.0000
## Max. :9.000 Max. :7.000 Max. :9.00 Max. :67.000 Max. :6.0000
##
## YEAR_ STARTDATED CONTRDATED OUTDATED GACC
## Length:726888 Min. :0213-08-11 Min. :1980-01-01 Min. :1980-01-01 Length:726888
## Class :character 1st Qu.:1991-08-06 1st Qu.:1991-07-22 1st Qu.:1992-08-01 Class :character
## Mode :character Median :1999-09-14 Median :1999-08-15 Median :2000-06-29 Mode :character
## Mean :1999-04-21 Mean :1999-02-04 Mean :1999-12-15
## 3rd Qu.:2006-08-24 3rd Qu.:2006-07-28 3rd Qu.:2007-01-14
## Max. :2015-12-31 Max. :2015-12-31 Max. :2030-05-06
## NA's :121137 NA's :140884 NA's :82468
## DISPATCH GACCN STATE STATE_FIPS FIPS
## Length:726888 Min. : 0.0 Length:726888 Length:726888 Min. : 1.00
## Class :character 1st Qu.:104.0 Class :character Class :character 1st Qu.: 6.00
## Mode :character Median :106.0 Mode :character Mode :character Median :28.00
## Mean :106.2 Mean :24.72
## 3rd Qu.:109.0 3rd Qu.:41.00
## Max. :110.0 Max. :78.00
##
## DLATITUDE DLONGITUDE TOTALACRES TRPGENCAUS TRPSPECCAU
## Min. :17.94 Min. :-178.8 Min. : 0.0 Min. :0.000 Min. : 0.000
## 1st Qu.:35.35 1st Qu.:-118.5 1st Qu.: 0.1 1st Qu.:0.000 1st Qu.: 0.000
## Median :39.73 Median :-112.0 Median : 0.2 Median :0.000 Median : 0.000
## Mean :40.12 Mean :-110.0 Mean : 256.1 Mean :1.818 Mean : 5.977
## 3rd Qu.:44.27 3rd Qu.:-105.2 3rd Qu.: 2.0 3rd Qu.:3.000 3rd Qu.: 8.000
## Max. :81.54 Max. : 108.0 Max. :2000000.0 Max. :9.000 Max. :32.000
## List the number of fires by different (general) causes, by agency, and by agency and cause:
table(fwfod$CAUSE) # general causes##
## Human Natural Undetermined Unknown
## 398847 300791 156 1458table(fwfod$ORGANIZATI) # reporting organization##
## BIA BLM BOR FS FWS NPS
## 161414 168935 32 324478 28132 43897table(fwfod$ORGANIZATI,fwfod$CAUSE) # cause by reporting organization##
## Human Natural Undetermined Unknown
## BIA 130226 27127 0 672
## BLM 62380 86517 0 567
## BOR 24 8 0 0
## FS 159201 165268 0 9
## FWS 21593 6383 156 0
## NPS 25423 15488 0 210The data seem to have been read in correctly.
1.2 Clean up
There are many records (121137) with no fire-start dates (i.e. STARTDATED is missing). Get the total number of points in the data set and the number without fire-start dates.
length(fwfod[,1]) # Number of points in the data set## [1] 726888sum(is.na(fwfod$STARTDATED)) # number with missing start dates## [1] 121137For later use, create three versions of fwfod, one with all observations (fwfod_all), one with the observations with missing values of STARDATED removed (fwfod_nonmissing), and one containing only the observations with missing STARTDATED values fwfod_missing:
# create a copy of fwfod
fwfod_all <- fwfod

# set a valid-point indicator variable
fwfod_all$validpt <- rep(1,length(fwfod_all[,1]))

#check for missing STARTDATED values
fwfod_all$validpt[is.na(fwfod_all$STARTDATED) == TRUE] <- 0
table(fwfod_all$validpt)
##
## 0 1
## 121137 605751# Commit the changes
fwfod_nonmissing <- fwfod_all[fwfod_all$validpt == 1,]
length(fwfod_nonmissing[,1]) # Number of points in the data set with nonmissing STARTDATED values## [1] 605751fwfod_missing <- fwfod_all[fwfod_all$validpt == 0,]
length(fwfod_missing[,1]) # Number of points in the data set with missing STARTDATED values## [1] 121137At this point there are 605751 records remaining in the fwfod_nonmissing data set.
1.3 Start-day missing values
The number of records with missing STARTDATED values is relatively large, about one-fifth of the total number of points in the data set.
Map all of the points, and overlay the points with missing STARTDATED values:
oldpar <- par(mfrow=c(1,2))
plot(NULL, ylim=c(24,50), xlim=c(-125,-65), xlab="Longitude", ylab="Latitude")
map("world", add=TRUE, lwd=2, col="gray"); map("state", add=TRUE, lwd=2, col="gray")
points(fwfod_nonmissing$DLATITUDE ~ fwfod_nonmissing$DLONGITUDE, pch=16, cex=0.2, col="red")
points(fwfod_missing$DLATITUDE ~ fwfod_missing$DLONGITUDE, pch=16, cex=0.2, col="black")
legend("bottomleft", legend=c("FWFOD","FWFOD_missing"), lwd=3, cex=0.5, col=c("red","black"))

plot(NULL, ylim=c(50,75), xlim=c(-180,-125), xlab="Longitude", ylab="Latitude")
map("world", add=TRUE, lwd=2, col="gray"); map("state", add=TRUE, lwd=2, col="gray")
points(fwfod_nonmissing$DLATITUDE ~ fwfod_nonmissing$DLONGITUDE, pch=16, cex=0.2, col="red")
points(fwfod_missing$DLATITUDE ~ fwfod_missing$DLONGITUDE, pch=16, cex=0.2, col="black")
legend("bottomleft", legend=c("FWFOD","FWFOD_missing"), lwd=3, cex=0.5, col=c("red","black"))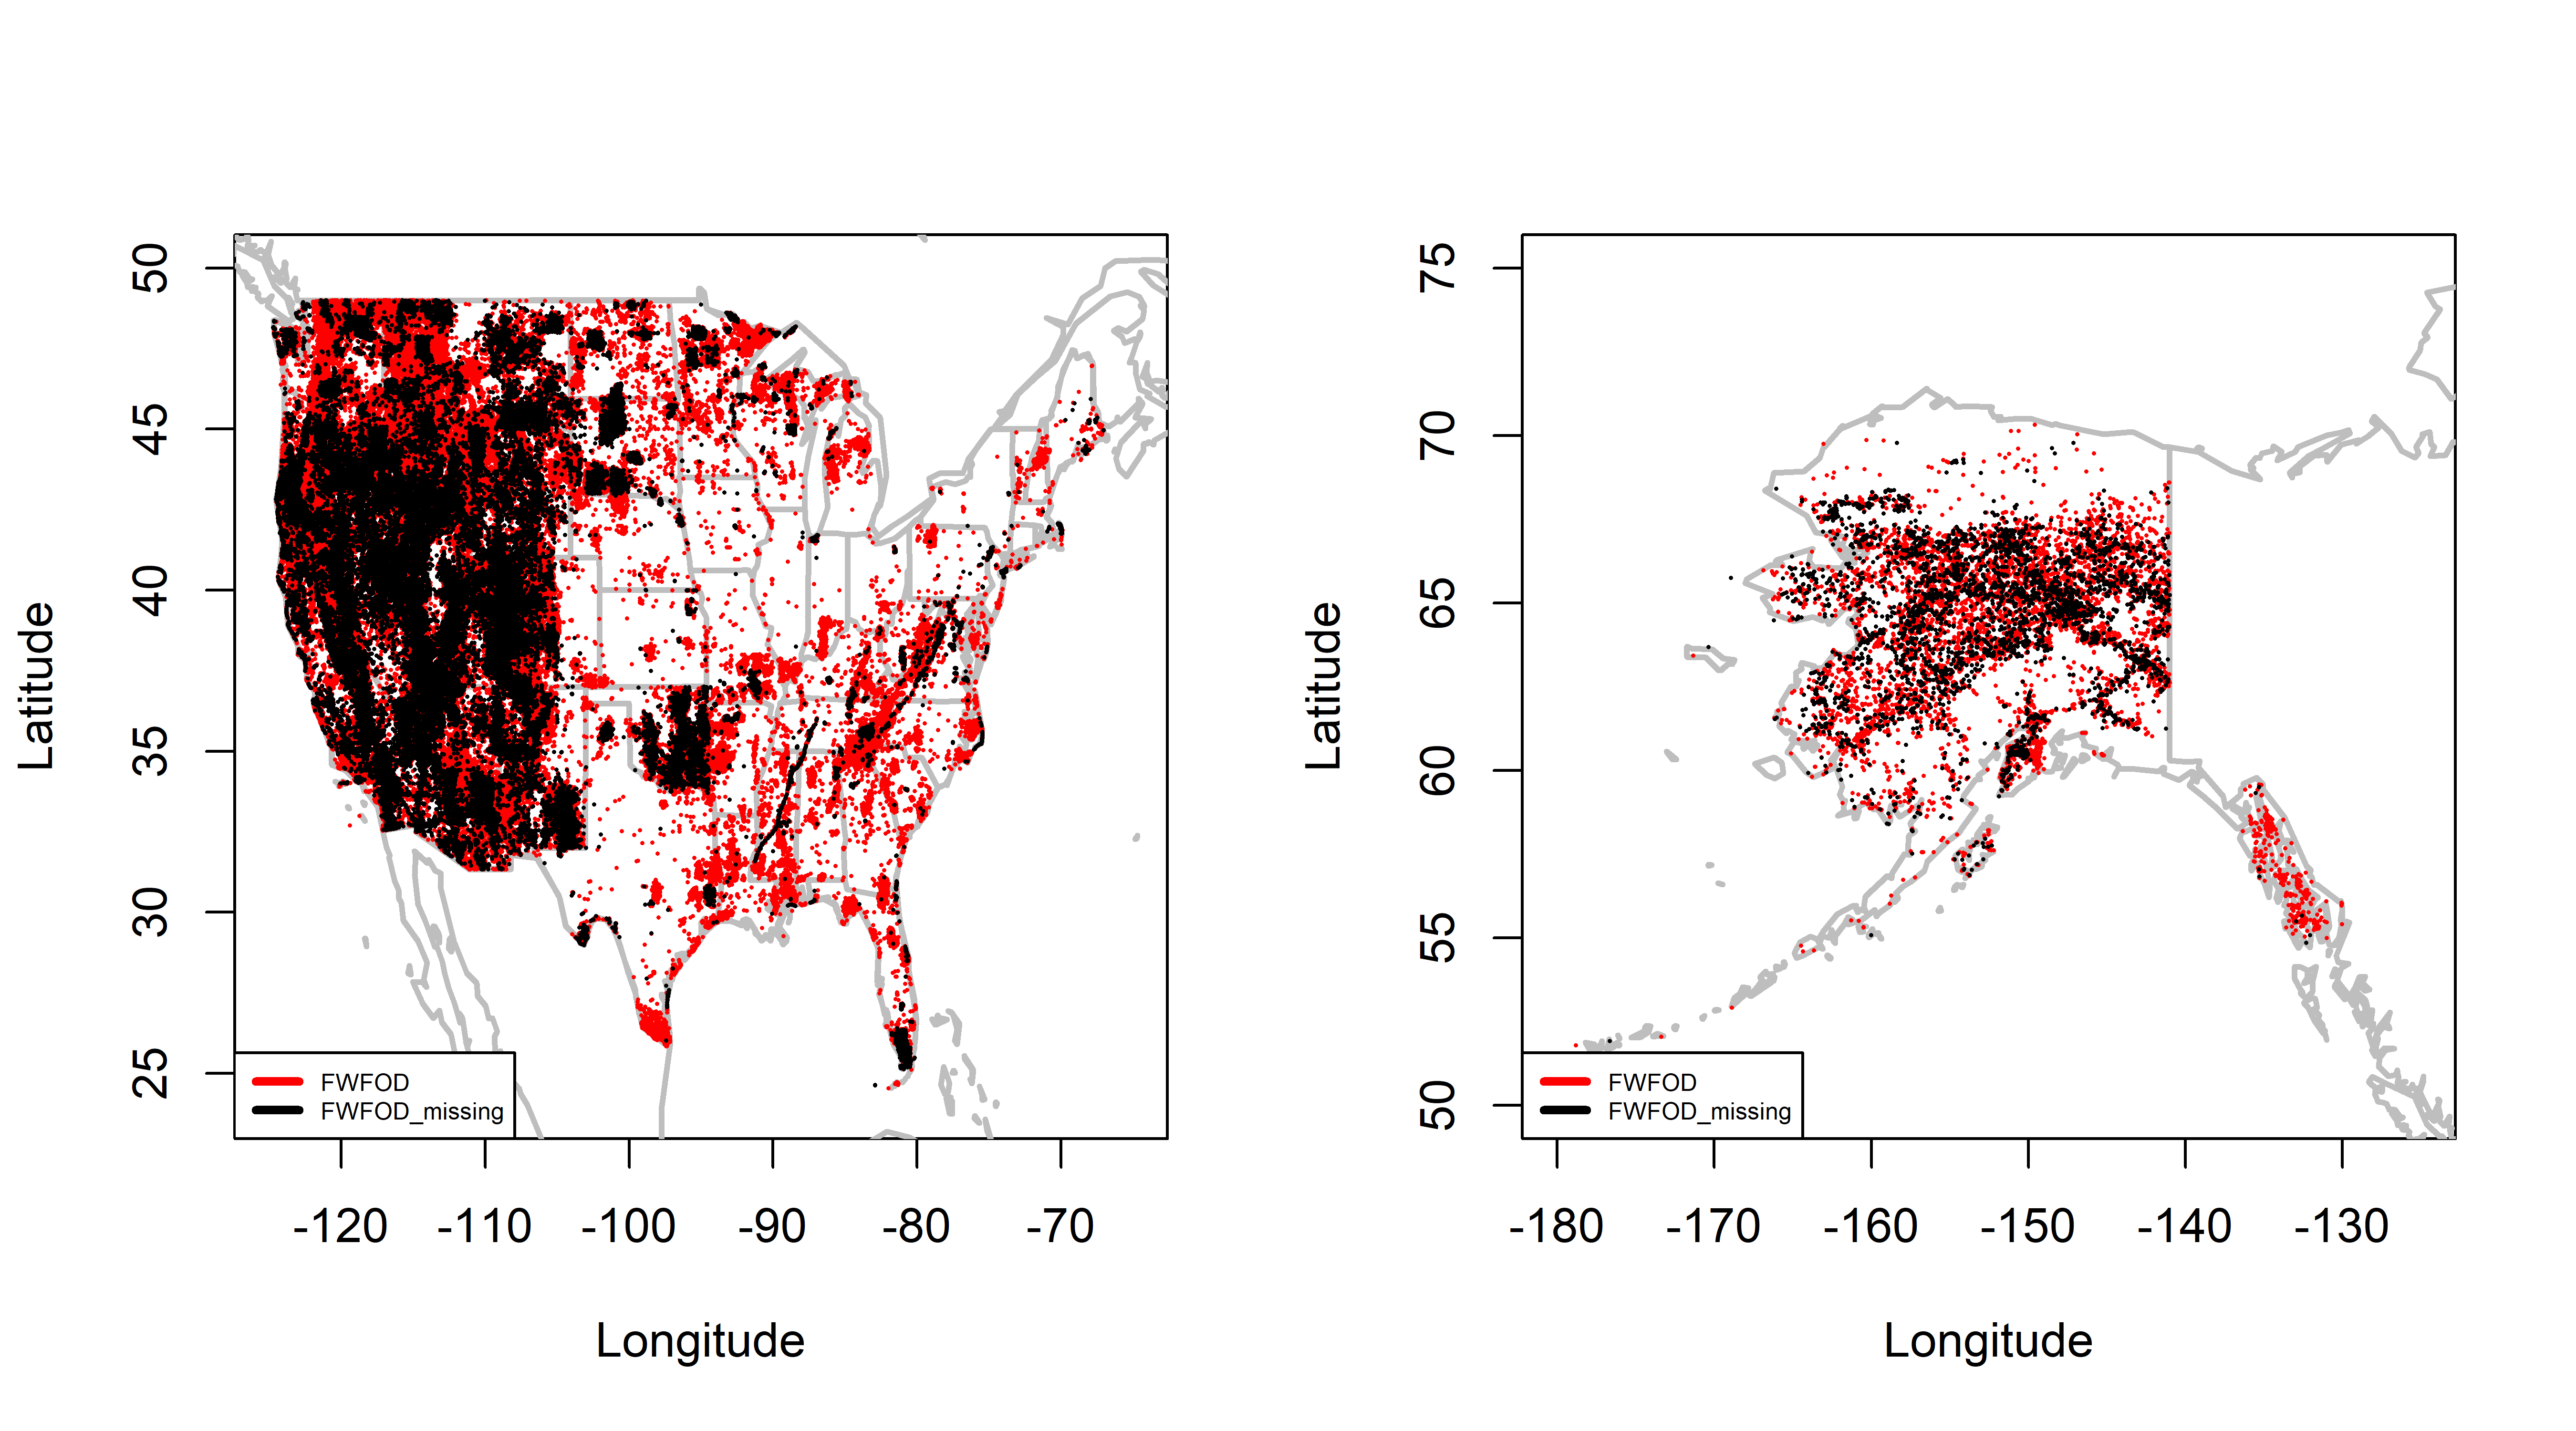
par(oldpar)The points with missing STARTDATED values are distributed across the US, but are more concentrated in Alaska, where there does not seem to be any particular pattern, and in the western US, where the pattern seems to have some structure possibly related to the land ownership of different reporting agencies.
1.3.1 Decompose fire-start dates
The variable STARTDATED can be disassembled into its component parts, including the year (startyear), month (startmonth), day within the month (startday) and day number within the year (startdaynum).
fwfod_nonmissing$STARTDATED <- as.character(fwfod_nonmissing$STARTDATED)
fwfod_nonmissing$STARTDATED <- as.Date(fwfod_nonmissing$STARTDATED)
fwfod_nonmissing$startyear <- as.numeric(format(fwfod_nonmissing$STARTDATED, format="%Y"))
fwfod_nonmissing$startmon <- as.numeric(format(fwfod_nonmissing$STARTDATED, format="%m"))
fwfod_nonmissing$startday <- as.numeric(format(fwfod_nonmissing$STARTDATED, format="%d"))
fwfod_nonmissing$startdaynum <- yday((strptime(fwfod_nonmissing$STARTDATED, "%Y-%m-%d")))
Check the startyear values:
## check records
table(fwfod_nonmissing$startyear)
##
## 213 1013 1980 1981 1982 1983 1984 1985 1986 1987 1988 1989 1990 1991 1992 1993 1994
## 1 1 8954 10328 6278 6451 9147 10390 15489 19422 19908 17797 17830 17332 19320 14300 23666
## 1995 1996 1997 1998 1999 2000 2001 2002 2003 2004 2005 2006 2007 2008 2009 2010 2011
## 16754 20189 14309 18183 21657 23064 21303 20639 22155 19210 19508 24576 20414 15651 15742 14946 15801
## 2012 2013 2014 2015
## 16320 16378 15475 16863There are two records with startyear values less than 1980. Remove them:
fwfod_nonmissing <- fwfod_nonmissing[fwfod_nonmissing$startyear >= 1980, ]
table(fwfod_nonmissing$startyear)
##
## 1980 1981 1982 1983 1984 1985 1986 1987 1988 1989 1990 1991 1992 1993 1994 1995 1996
## 8954 10328 6278 6451 9147 10390 15489 19422 19908 17797 17830 17332 19320 14300 23666 16754 20189
## 1997 1998 1999 2000 2001 2002 2003 2004 2005 2006 2007 2008 2009 2010 2011 2012 2013
## 14309 18183 21657 23064 21303 20639 22155 19210 19508 24576 20414 15651 15742 14946 15801 16320 16378
## 2014 2015
## 15475 168631.4 The start-day problem
The number of fire starts on each day of the month are listed in the following tables for all fires, naturual (e.g. lighting) and human-started fires:
# all fires
table(fwfod_nonmissing$startday)
##
## 1 2 3 4 5 6 7 8 9 10 11 12 13 14 15 16 17
## 13915 13443 13089 14112 13478 13071 13771 13498 12478 23485 21959 22514 22375 22486 21495 21644 22245
## 18 19 20 21 22 23 24 25 26 27 28 29 30 31
## 21559 21966 22361 21966 22549 23788 23011 22726 23280 21833 23175 22248 22581 13648# natural (lightning)
table(fwfod_nonmissing$startday[fwfod_nonmissing$CAUSE=="Natural"])##
## 1 2 3 4 5 6 7 8 9 10 11 12 13 14 15 16 17
## 6198 5841 5682 5794 5873 5798 6384 6199 5734 10800 9112 9680 9980 9442 8972 9263 9822
## 18 19 20 21 22 23 24 25 26 27 28 29 30 31
## 9268 9533 9764 9395 9684 10562 9926 9695 10313 9143 9537 9672 9974 6296# human
table(fwfod_nonmissing$startday[fwfod_nonmissing$CAUSE=="Human"])##
## 1 2 3 4 5 6 7 8 9 10 11 12 13 14 15 16 17
## 7598 7520 7317 8256 7537 7223 7321 7234 6663 12435 12574 12576 12134 12748 12272 12103 12147
## 18 19 20 21 22 23 24 25 26 27 28 29 30 31
## 12003 12127 12331 12313 12605 12968 12823 12776 12678 12414 13387 12278 12295 7177As can be seen in the tables, the typical number of fires per day in the first 9 days of the month is roughly half of the typical number for days 10 through 31 (with the number on the 31st day appropriate for the number of 31-day months of the year).
The pattern in the tables can be visualized by histograms of startday. Each day number should be roughly equally likely, but days 1 through 9 can be seen to occur less frequently (about half as many) as days 10-30:
oldpar <- par(mfrow=c(1,3))
hist(fwfod_nonmissing$startday, breaks=seq(-0.5,31.5,by=1), freq=-TRUE, main="FWFOD All fires", ylim=c(0,25000))
hist(fwfod_nonmissing$startday[fwfod_nonmissing$CAUSE=="Natural"], breaks=seq(-0.5,31.5,by=1), freq=-TRUE,
  main="FWFOD Natural", ylim=c(0,25000))
hist(fwfod_nonmissing$startday[fwfod_nonmissing$CAUSE=="Human"], breaks=seq(-0.5,31.5,by=1), freq=-TRUE,
  main="FWFOD Human", ylim=c(0,25000))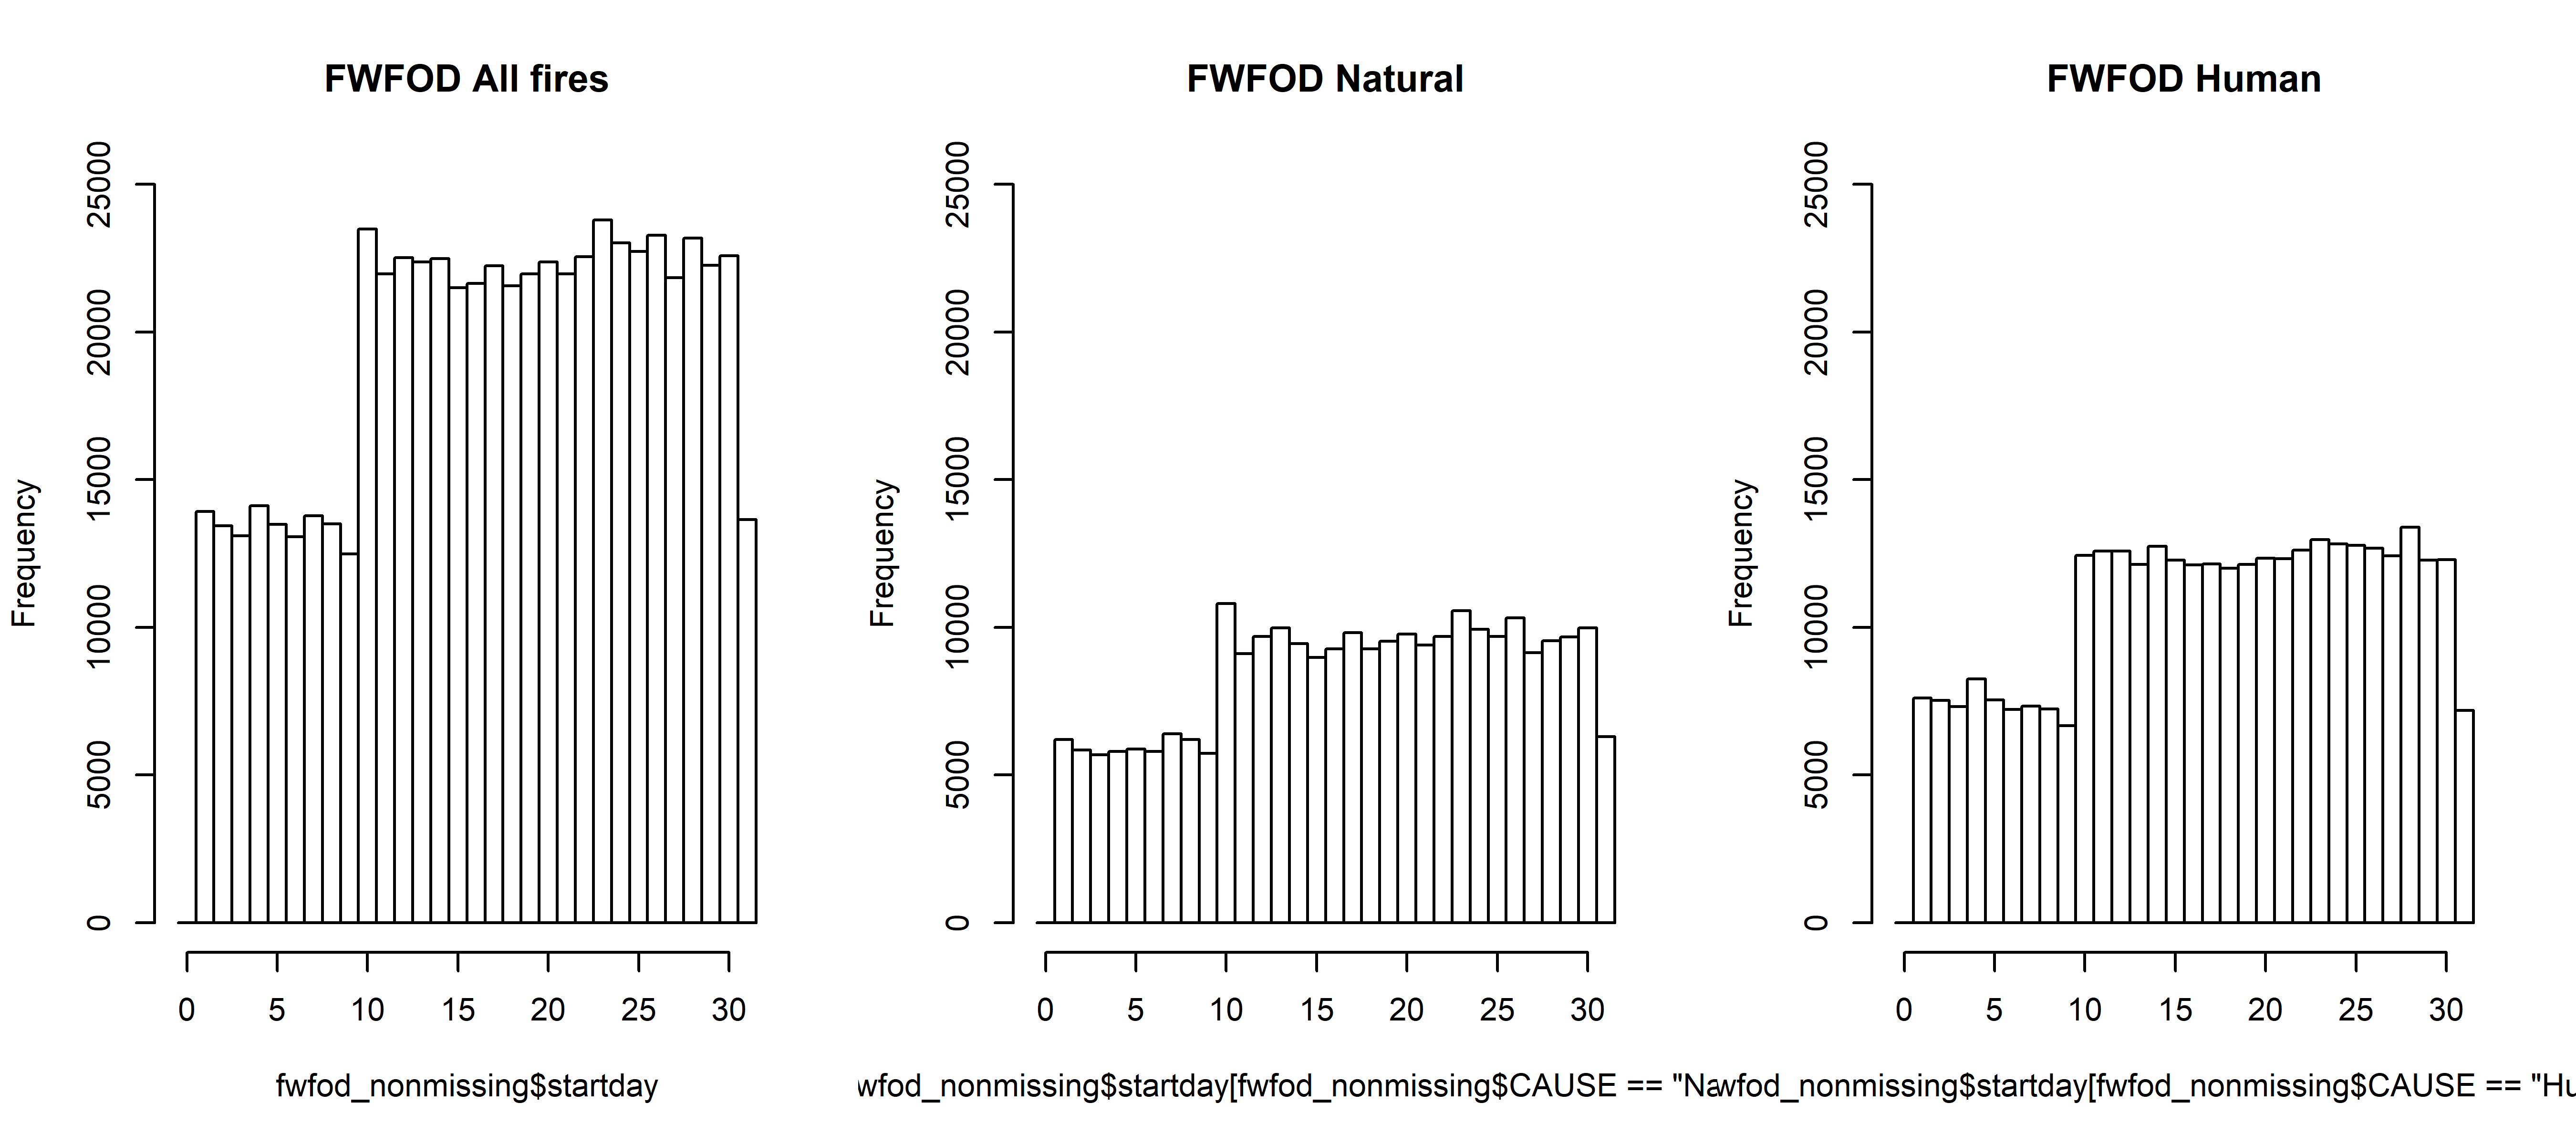
par(oldpar)Another view of the issue can be seen by looking at histograms of startdaynum, the day of the year for each fire:
hist(fwfod_nonmissing$startdaynum, breaks=seq(-0.5,366.5,by=1), freq=-TRUE,
  main="FWFOD All fires", ylim=c(0,6000), xlim=c(0,360), col="black", xaxp=c(0, 360, 12))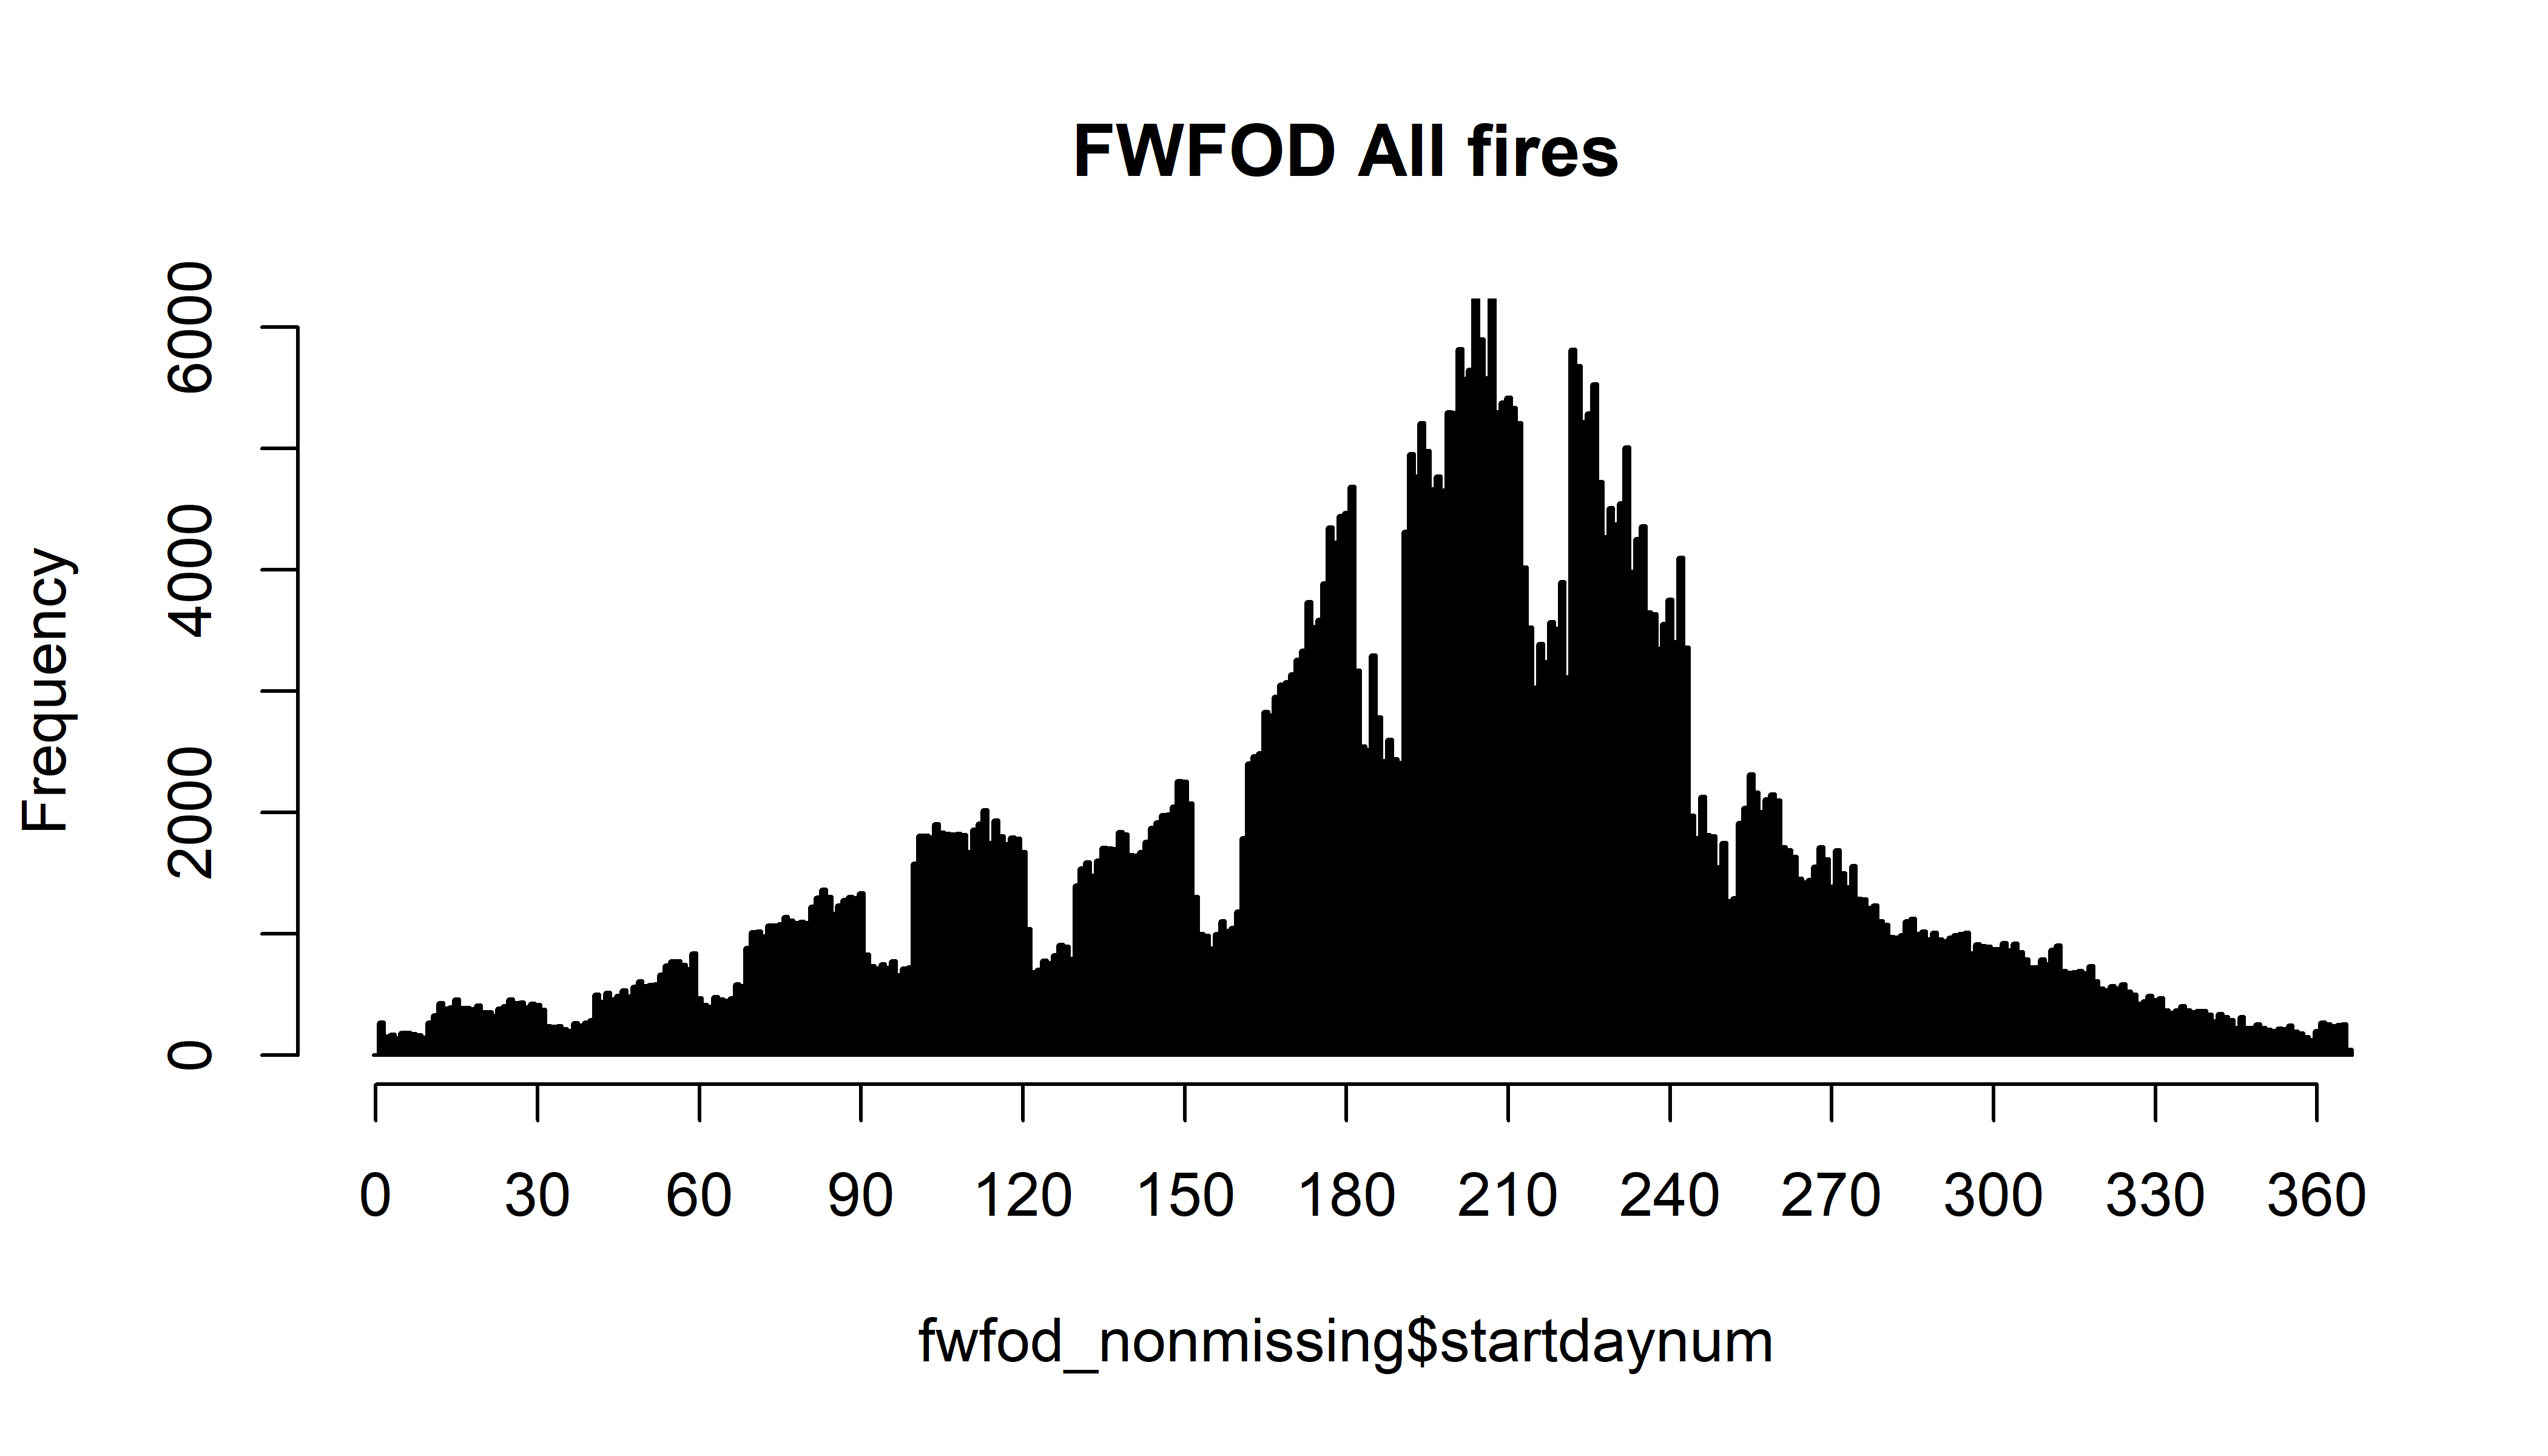
hist(fwfod_nonmissing$startdaynum[fwfod_nonmissing$CAUSE == "Natural"], breaks=seq(-0.5,366.5,by=1), freq=-TRUE,
  main="FWFOD Natural", xlim=c(0,360), ylim=c(0,6000), col="black", xaxp=c(0, 360, 12))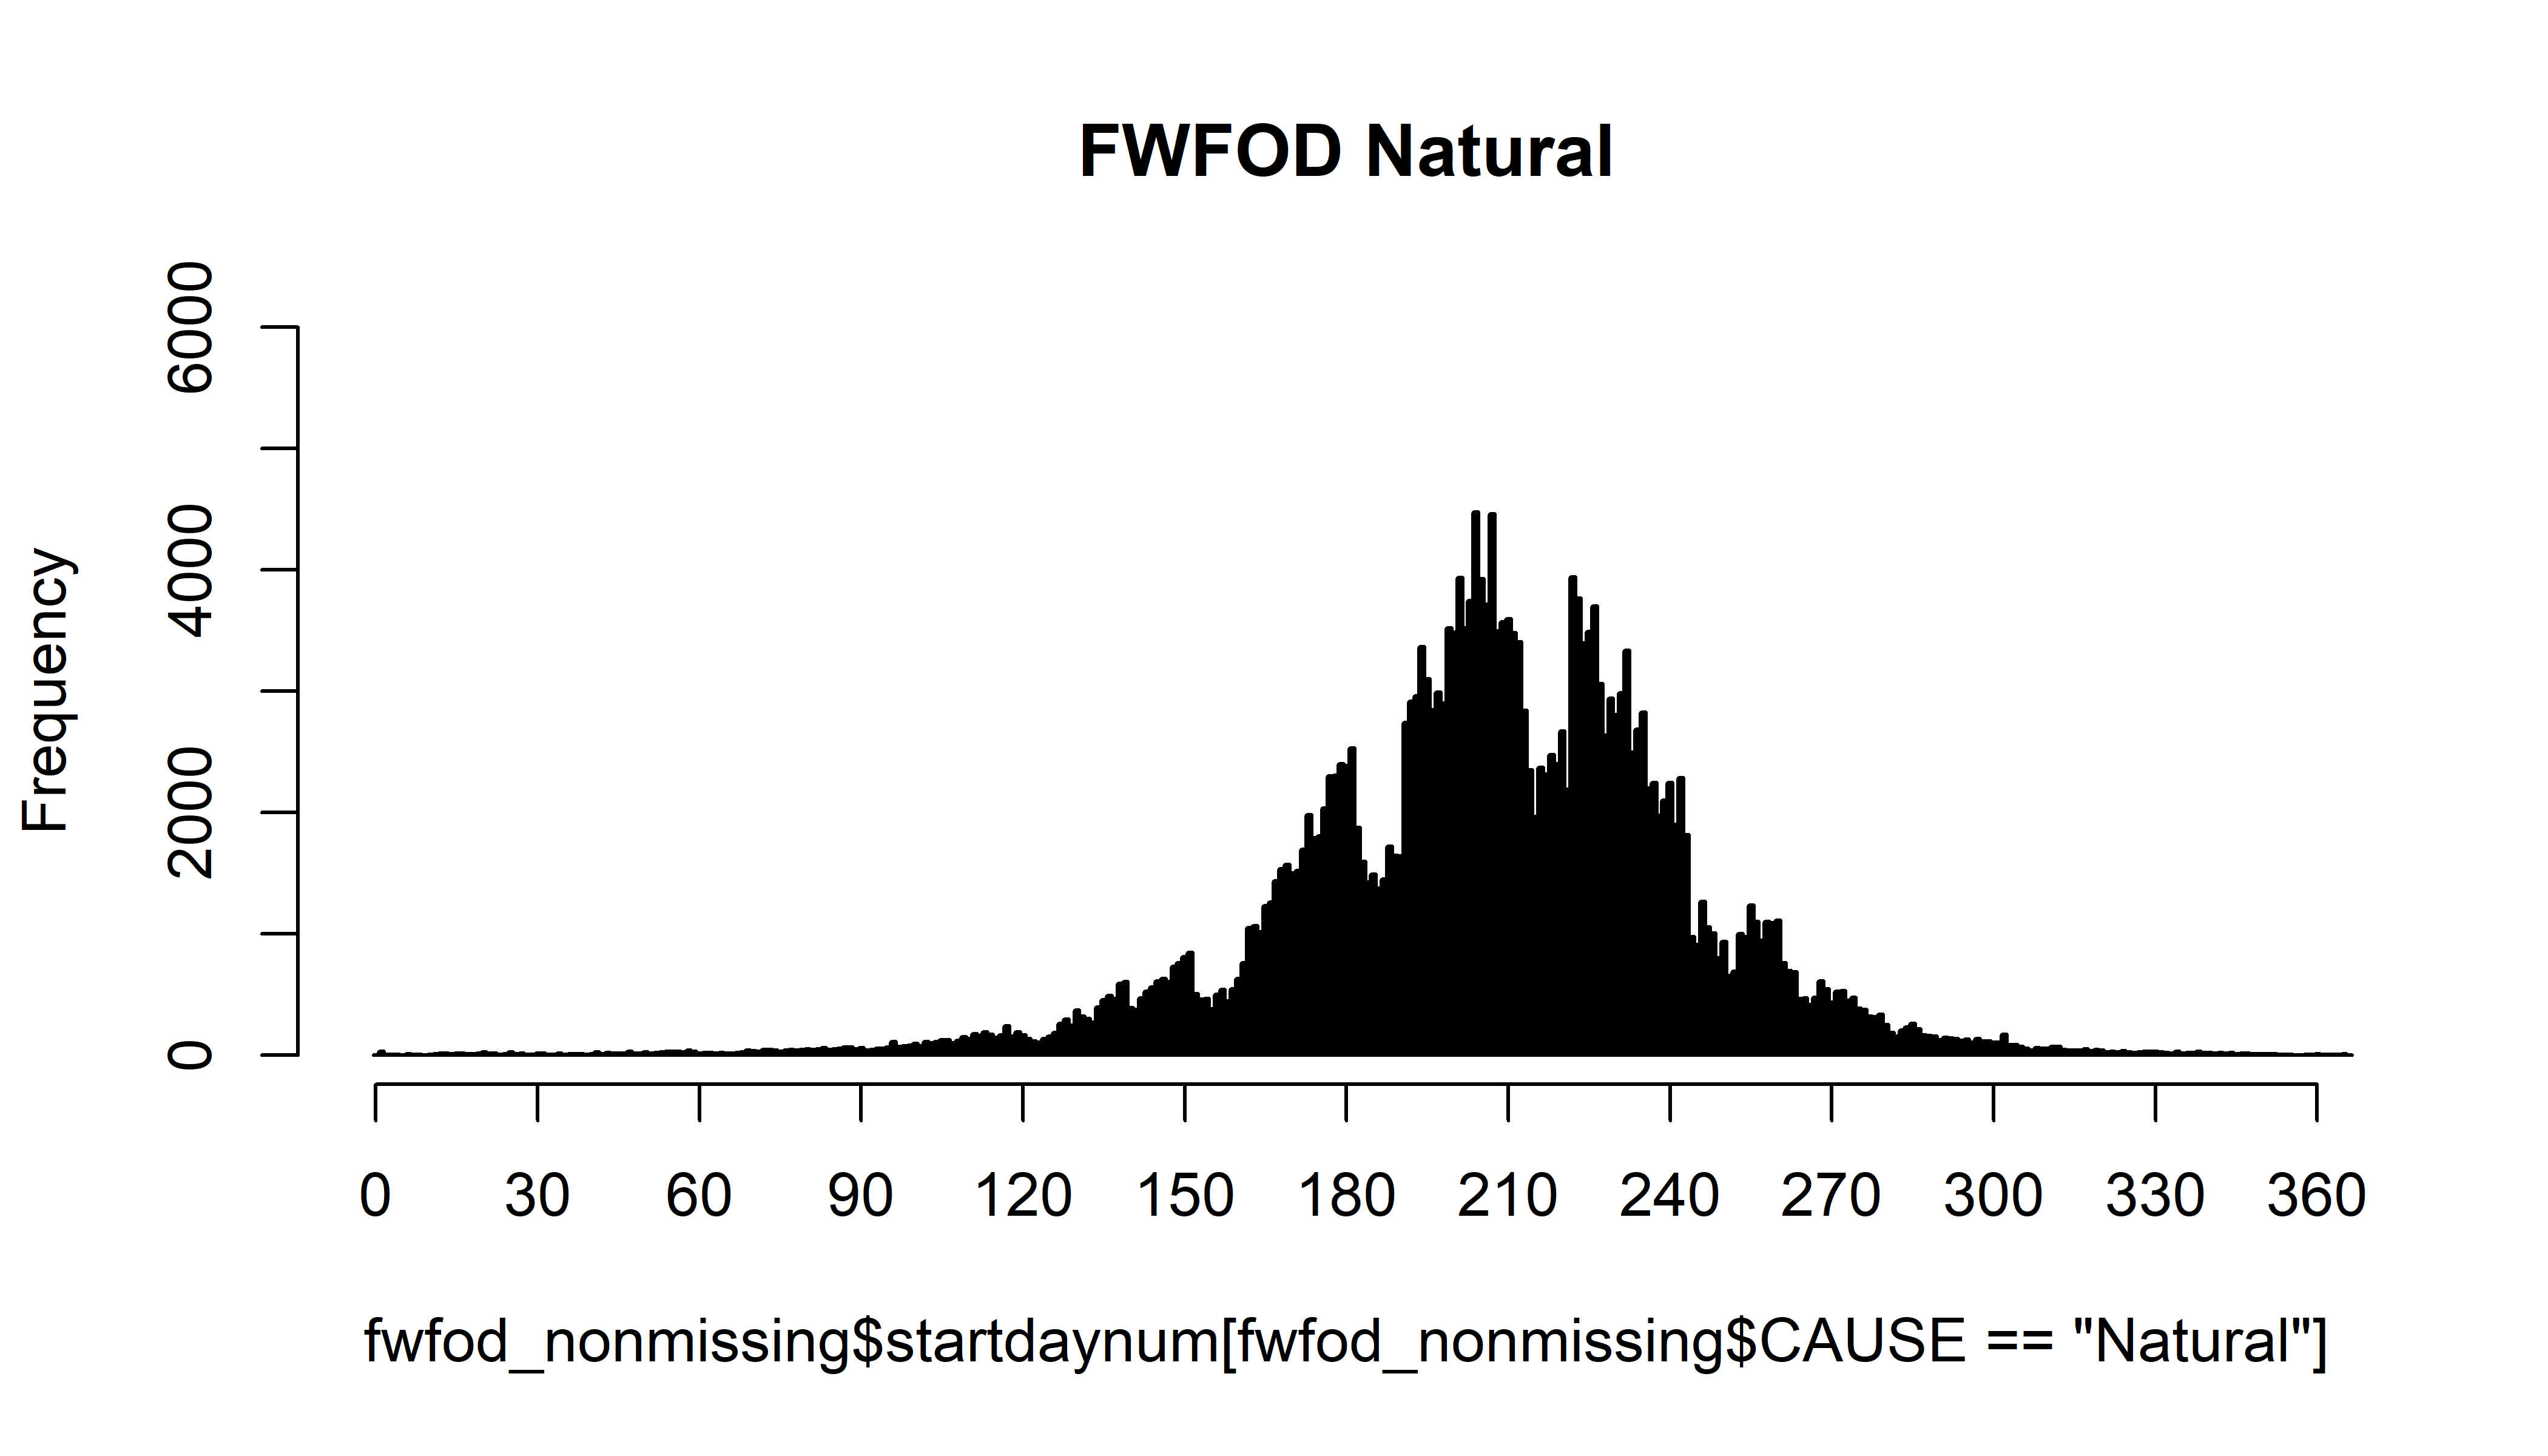
hist(fwfod_nonmissing$startdaynum[fwfod_nonmissing$CAUSE == "Human"], breaks=seq(-0.5,366.5,by=1), freq=-TRUE,
  main="FWFOD Human", xlim=c(0,360), ylim=c(0,6000), col="black", xaxp=c(0, 360, 12))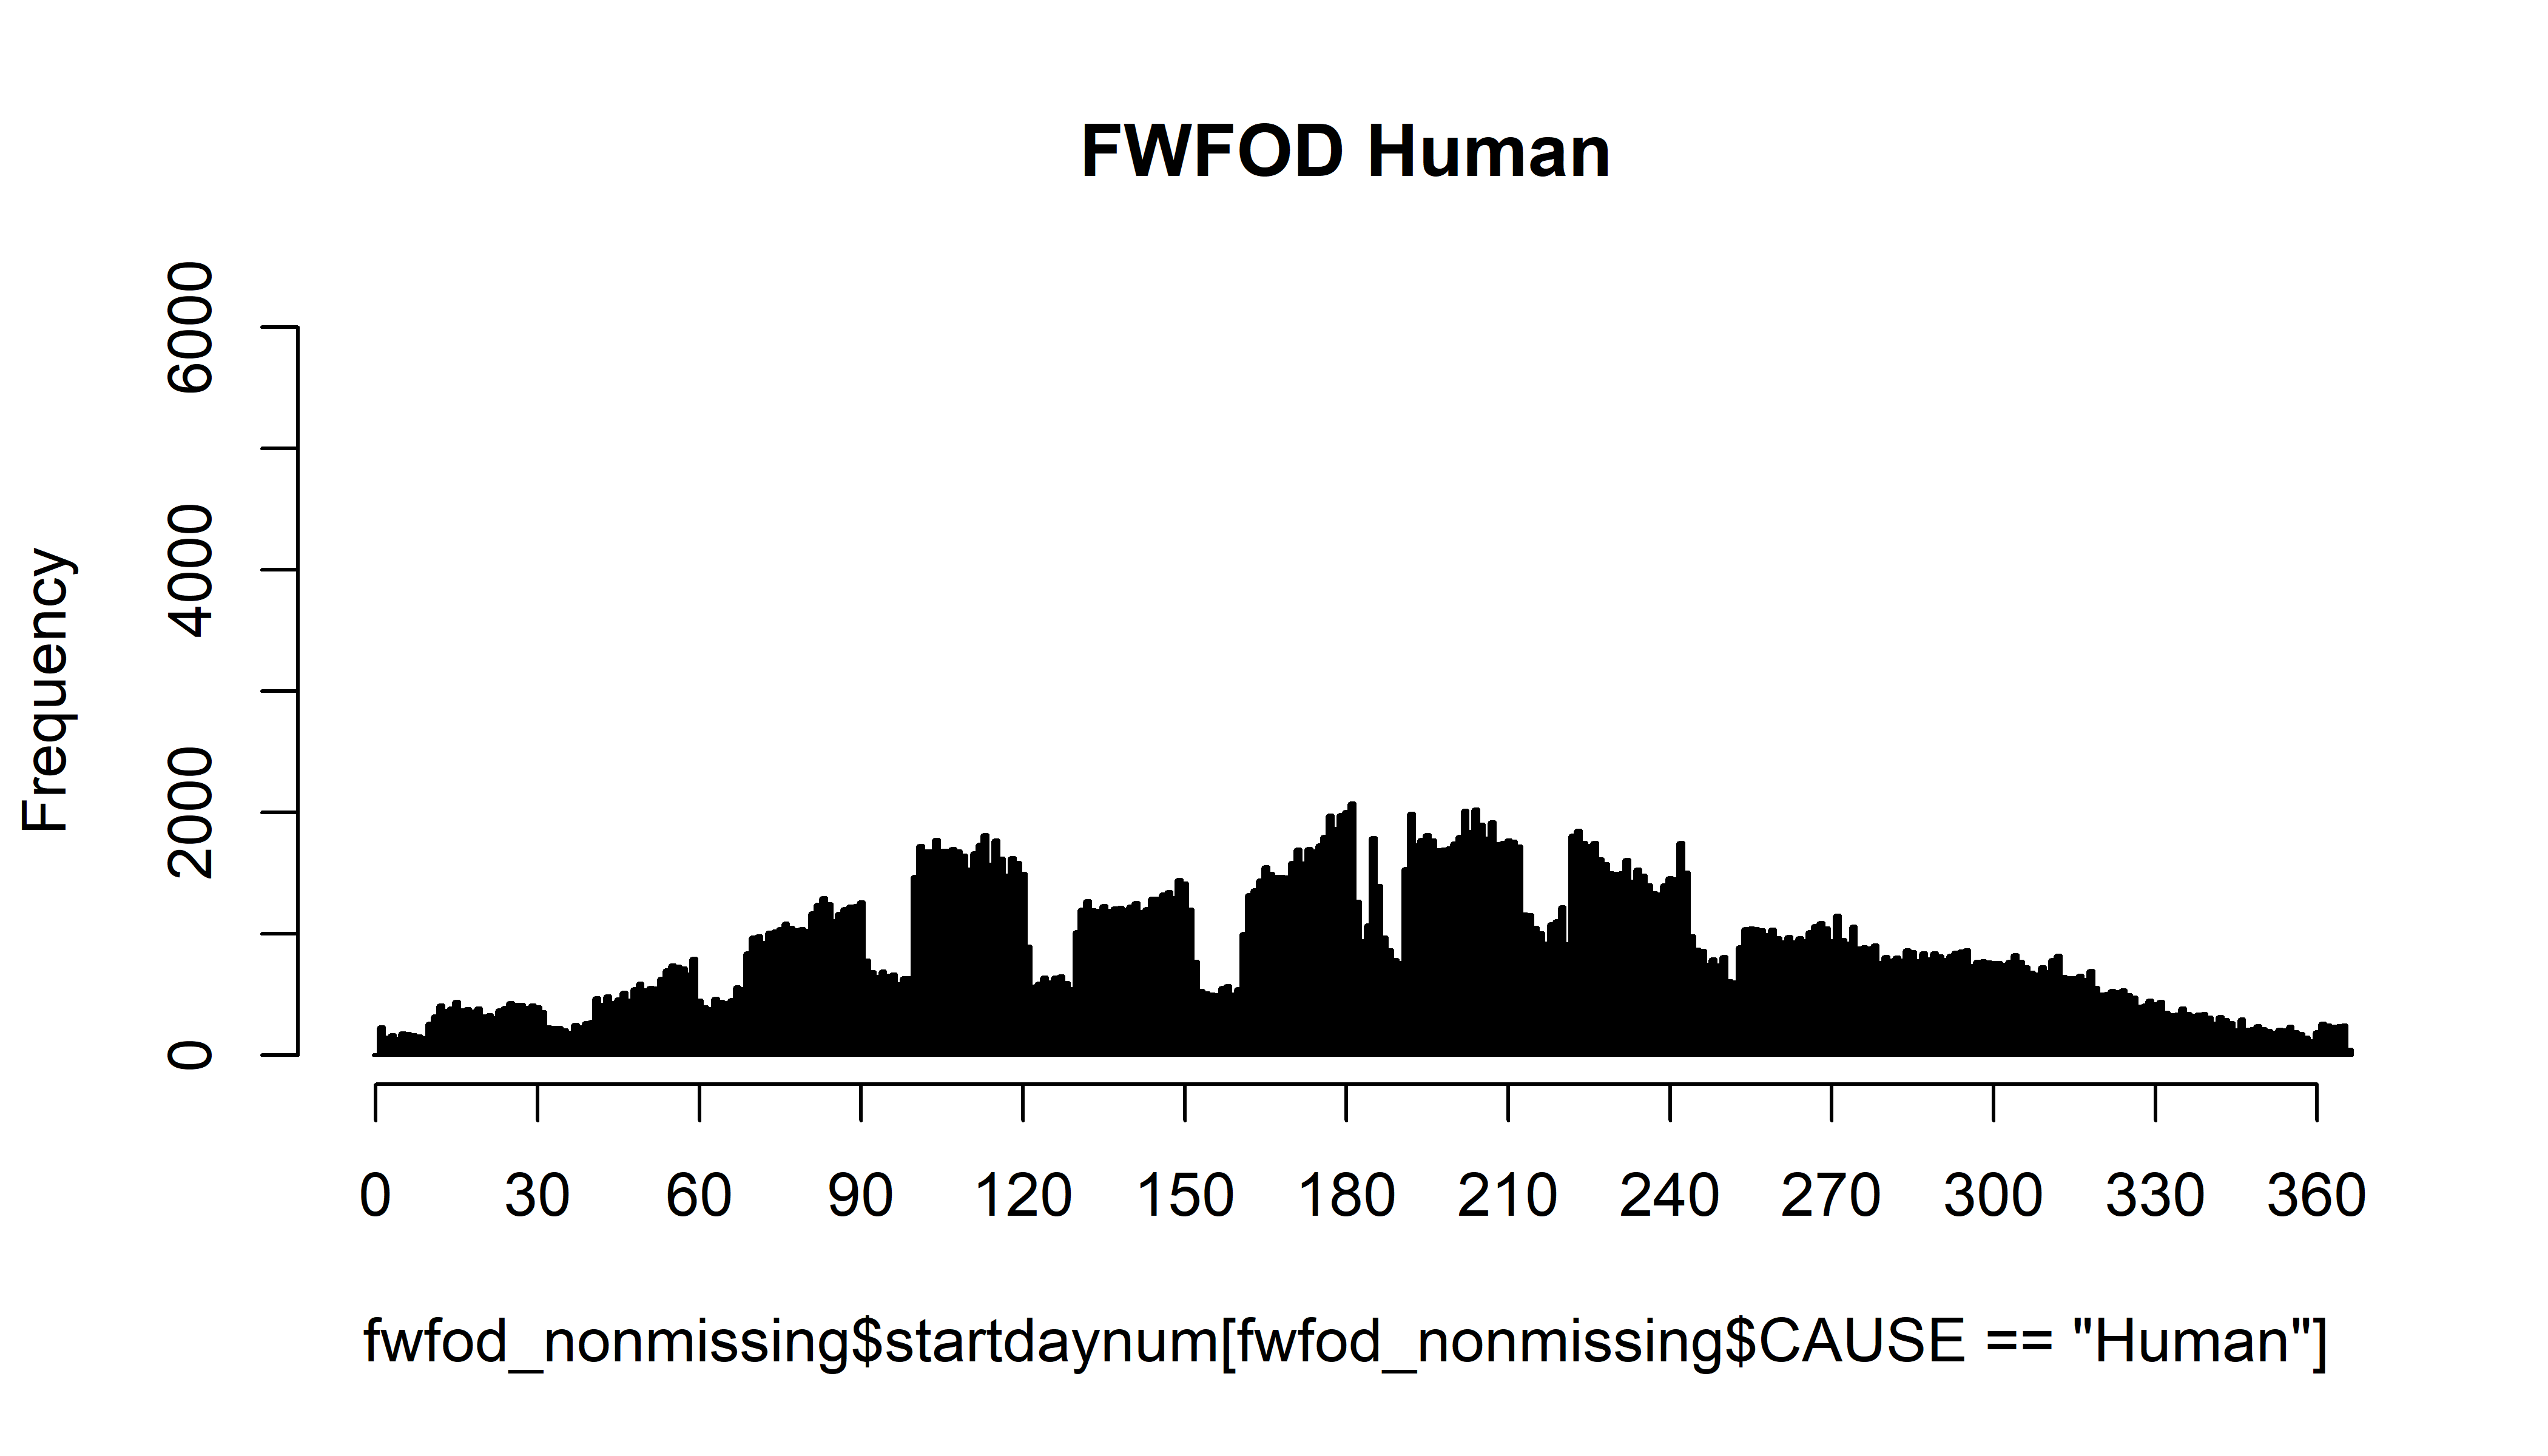
Note the obvious “chunks” in the histograms, corresponding to days 1-9 in each month (except for Oct-Dec (e.g. stardaynum > 275), see below).
2 Comparison with FPA-FOD
The “FWFOD” data can be compared with the K.C. Short (2014) data set, 2015 version (updated through 2014), referred to here as “FPA-FOD” data):
Spatial wildfire occurrence data for the United States, 1992-2013/Fire Program Analysis Fire-Occurrence Database [FPA_FOD_20150323] (3rd Edition) (Short, K.C., 2014, Earth Syst. Sci. Data, 6:1-27) – http://www.fs.usda.gov/rds/archive/Product/RDS-2013-0009.3/ (2015-07-07, downloaded 2015-08-27).
The data are read directly from the source Microsoft Access data base, so there was no external manipulation of the data. (Note that the connection to the particular Access database that is being read (FPA_FOD_20150323.accdb) is established externally to R (on Windows) using the Data Sources tool (i.e. Control Panel > Administrative Tools > Data Sources (ODBC)). This should be done prior to connecting to the database.)
Read the data from the Access database:
# add DSN: Control Panel > Administratative Tools > Data Sources (ODBC),
# and add FPA_FOD_20150323.accdb before attempting to connect
dbname <- "FPA_FOD_20150323.accdb"
fpafod.db <- odbcConnect(dbname)
odbcGetInfo(fpafod.db) # basic info on the database
## DBMS_Name DBMS_Ver Driver_ODBC_Ver
## "ACCESS" "12.00.0000" "03.51"
## Data_Source_Name Driver_Name Driver_Ver
## "FPA_FOD_20150323.accdb" "ACEODBC.DLL" "Microsoft Access database engine"
## ODBC_Ver Server_Name
## "03.80.0000" "ACCESS"sqlTables(fpafod.db, tableType="TABLE") # list tables in the database## TABLE_CAT TABLE_SCHEM
## 1 E:\\Projects\\fire\\DailyFireStarts\\data\\RDS-2013-0009.3\\source\\FPA_FOD_20150323.accdb <NA>
## 2 E:\\Projects\\fire\\DailyFireStarts\\data\\RDS-2013-0009.3\\source\\FPA_FOD_20150323.accdb <NA>
## TABLE_NAME TABLE_TYPE REMARKS
## 1 Fires TABLE <NA>
## 2 NWCG_UnitIdActive_20120305 TABLE <NA>sqlColumns(fpafod.db, "Fires")$COLUMN_NAME # list the variables in the Fires table## [1] "FOD_ID" "FPA_ID" "SOURCE_SYSTEM_TYPE"
## [4] "SOURCE_SYSTEM" "NWCG_REPORTING_AGENCY" "NWCG_REPORTING_UNIT_ID"
## [7] "NWCG_REPORTING_UNIT_NAME" "SOURCE_REPORTING_UNIT" "SOURCE_REPORTING_UNIT_NAME"
## [10] "LOCAL_FIRE_REPORT_ID" "LOCAL_INCIDENT_ID" "FIRE_CODE"
## [13] "FIRE_NAME" "ICS_209_INCIDENT_NUMBER" "ICS_209_NAME"
## [16] "MTBS_ID" "MTBS_FIRE_NAME" "COMPLEX_NAME"
## [19] "FIRE_YEAR" "DISCOVERY_DATE" "DISCOVERY_DOY"
## [22] "DISCOVERY_TIME" "STAT_CAUSE_CODE" "STAT_CAUSE_DESCR"
## [25] "CONT_DATE" "CONT_DOY" "CONT_TIME"
## [28] "FIRE_SIZE" "FIRE_SIZE_CLASS" "LATITUDE"
## [31] "LONGITUDE" "OWNER_CODE" "OWNER_DESCR"
## [34] "STATE" "COUNTY" "FIPS_CODE"
## [37] "FIPS_NAME"Define the query:
query1 <- paste("SELECT FOD_ID,NWCG_REPORTING_AGENCY,FIRE_YEAR,DISCOVERY_DATE,DISCOVERY_DOY,",
  "STAT_CAUSE_CODE,CONT_DATE,CONT_DOY,FIRE_SIZE,LATITUDE,LONGITUDE,STATE FROM Fires", sep="")
Get the data (this can take a little while), and close the data base:
fpafod <- sqlQuery(fpafod.db, query1)
odbcClose(fpafod.db)
List the variables, first and last lines, and summarize the FPA-FOD data set:
str(fpafod, strict.width="cut")## 'data.frame': 1727476 obs. of 12 variables:
## $ FOD_ID : int 1 2 3 4 5 6 7 8 9 10 ...
## $ NWCG_REPORTING_AGENCY: Factor w/ 11 levels "BIA","BLM","BOR",..: 6 6 6 6 6 6 6 6 6 6 ...
## $ FIRE_YEAR : int 2005 2004 2004 2004 2004 2004 2004 2005 2005 2004 ...
## $ DISCOVERY_DATE : POSIXct, format: "2005-02-02" "2004-05-12" "2004-05-31" ...
## $ DISCOVERY_DOY : int 33 133 152 180 180 182 183 67 74 183 ...
## $ STAT_CAUSE_CODE : num 9 1 5 1 1 1 1 5 5 1 ...
## $ CONT_DATE : POSIXct, format: "2005-02-02" "2004-05-12" "2004-05-31" ...
## $ CONT_DOY : int 33 133 152 185 185 183 184 67 74 184 ...
## $ FIRE_SIZE : num 0.1 0.25 0.1 0.1 0.1 0.1 0.1 0.8 1 0.1 ...
## $ LATITUDE : num 40 38.9 39 38.6 38.6 ...
## $ LONGITUDE : num -121 -120 -121 -120 -120 ...
## $ STATE : Factor w/ 52 levels "AK","AL","AR",..: 5 5 5 5 5 5 5 5 5 5 ...head(fpafod); tail(fpafod)## FOD_ID NWCG_REPORTING_AGENCY FIRE_YEAR DISCOVERY_DATE DISCOVERY_DOY STAT_CAUSE_CODE CONT_DATE
## 1 1 FS 2005 2005-02-02 33 9 2005-02-02
## 2 2 FS 2004 2004-05-12 133 1 2004-05-12
## 3 3 FS 2004 2004-05-31 152 5 2004-05-31
## 4 4 FS 2004 2004-06-28 180 1 2004-07-03
## 5 5 FS 2004 2004-06-28 180 1 2004-07-03
## 6 6 FS 2004 2004-06-30 182 1 2004-07-01
## CONT_DOY FIRE_SIZE LATITUDE LONGITUDE STATE
## 1 33 0.10 40.03694 -121.0058 CA
## 2 133 0.25 38.93306 -120.4044 CA
## 3 152 0.10 38.98417 -120.7356 CA
## 4 185 0.10 38.55917 -119.9133 CA
## 5 185 0.10 38.55917 -119.9331 CA
## 6 183 0.10 38.63528 -120.1036 CA## FOD_ID NWCG_REPORTING_AGENCY FIRE_YEAR DISCOVERY_DATE DISCOVERY_DOY STAT_CAUSE_CODE
## 1727471 201940176 ST/C&L 2005 2005-03-12 71 13
## 1727472 201940177 ST/C&L 2005 2005-04-20 110 13
## 1727473 201940178 ST/C&L 2005 2005-11-24 328 13
## 1727474 201940179 ST/C&L 2004 2004-04-18 109 13
## 1727475 201940180 ST/C&L 2004 2004-04-17 108 13
## 1727476 201940182 ST/C&L 2004 2004-04-08 99 13
## CONT_DATE CONT_DOY FIRE_SIZE LATITUDE LONGITUDE STATE
## 1727471 2005-03-13 72 328 36.96667 -92.83333 MO
## 1727472 2005-04-21 111 282 38.31333 -93.86667 MO
## 1727473 <NA> NA 201 38.26583 -93.66833 MO
## 1727474 2004-04-19 110 1026 38.04167 -91.02222 MO
## 1727475 2004-04-17 108 259 37.53806 -92.96750 MO
## 1727476 2004-04-08 99 304 36.83333 -92.50000 MOsummary(fpafod)## FOD_ID NWCG_REPORTING_AGENCY FIRE_YEAR DISCOVERY_DATE DISCOVERY_DOY
## Min. : 1 ST/C&L :1254551 Min. :1992 Min. :1992-01-01 00:00:00 Min. : 1.0
## 1st Qu.: 465673 FS : 206731 1st Qu.:1998 1st Qu.:1998-04-25 00:00:00 1st Qu.: 89.0
## Median : 985582 BIA : 108423 Median :2003 Median :2003-06-30 00:00:00 Median :164.0
## Mean : 32179232 BLM : 90801 Mean :2003 Mean :2003-03-31 04:27:10 Mean :164.9
## 3rd Qu.: 1761114 IA : 21841 3rd Qu.:2008 3rd Qu.:2008-05-05 00:00:00 3rd Qu.:230.0
## Max. :201940182 NPS : 19571 Max. :2013 Max. :2013-12-31 00:00:00 Max. :366.0
## (Other): 25558
## STAT_CAUSE_CODE CONT_DATE CONT_DOY FIRE_SIZE LATITUDE
## Min. : 1.000 Min. :1992-01-01 00:00:00 Min. : 1.0 Min. : 0.0 Min. :17.94
## 1st Qu.: 3.000 1st Qu.:1996-09-03 00:00:00 1st Qu.:104.0 1st Qu.: 0.1 1st Qu.:32.83
## Median : 5.000 Median :2003-05-07 00:00:00 Median :183.0 Median : 1.0 Median :35.40
## Mean : 5.921 Mean :2003-04-05 08:42:42 Mean :173.9 Mean : 73.0 Mean :36.79
## 3rd Qu.: 9.000 3rd Qu.:2009-06-26 00:00:00 3rd Qu.:232.0 3rd Qu.: 3.6 3rd Qu.:40.77
## Max. :13.000 Max. :2013-12-31 00:00:00 Max. :366.0 Max. :606945.0 Max. :70.14
## NA's :854941 NA's :854941
## LONGITUDE STATE
## Min. :-178.80 CA :173634
## 1st Qu.:-109.83 GA :162479
## Median : -91.18 TX :125227
## Mean : -95.29 NC :104263
## 3rd Qu.: -82.25 FL : 85576
## Max. : -65.26 SC : 78127
## (Other):9981702.1 FPA-FOD start-day values
The FPA-FOD data have an explicit day-of-year variable DISCOVERY_DOY, so just get the other date-related variables:
fpafod$DISCOVERY_DATE <- as.Date(fpafod$DISCOVERY_DATE)
fpafod$startyear <- as.numeric(format(fpafod$DISCOVERY_DATE, format="%Y"))
fpafod$startmon <- as.numeric(format(fpafod$DISCOVERY_DATE, format="%m"))
fpafod$startday <- as.numeric(format(fpafod$DISCOVERY_DATE, format="%d"))
The number of fire starts on each day of the month in the FPA-FOD data set are listed in the following tables, for all fires, natural- and human-started fires:
# all fires
table(fpafod$startday)
##
## 1 2 3 4 5 6 7 8 9 10 11 12 13 14 15 16 17
## 57486 57806 58757 64298 61052 57692 59121 57577 55757 57911 56789 57509 55792 55080 55287 54401 56718
## 18 19 20 21 22 23 24 25 26 27 28 29 30 31
## 56651 57887 55377 55552 56354 57456 57870 56909 54532 52670 55084 51740 49233 31128# natural (STAT_CAUSE_CODE = 1)
table(fpafod$startday[fpafod$STAT_CAUSE_CODE == 1])##
## 1 2 3 4 5 6 7 8 9 10 11 12 13 14 15 16 17 18 19 20 21
## 8551 8677 9101 8873 8741 8480 8557 8049 8002 8510 8264 8595 8761 8316 8120 8153 8523 8532 8427 8427 8924
## 22 23 24 25 26 27 28 29 30 31
## 8492 9123 8864 8666 8214 7749 8604 8550 8167 5299# human (STAT_CAUSE_CODE > 1)
table(fpafod$startday[fpafod$STAT_CAUSE_CODE > 1])##
## 1 2 3 4 5 6 7 8 9 10 11 12 13 14 15 16 17
## 48935 49129 49656 55425 52311 49212 50564 49528 47755 49401 48525 48914 47031 46764 47167 46248 48195
## 18 19 20 21 22 23 24 25 26 27 28 29 30 31
## 48119 49460 46950 46628 47862 48333 49006 48243 46318 44921 46480 43190 41066 25829Get histograms as before, to visualize the pattern:
oldpar <- par(mfrow=c(1,3))
hist(fpafod$startday, breaks=seq(-0.5,31.5,by=1), freq=-TRUE, main="FPA-FOD All fires", ylim=c(0,70000))
hist(fpafod$startday[fpafod$STAT_CAUSE_CODE == 1], breaks=seq(-0.5,31.5,by=1), freq=-TRUE,
  main="FPA-FOD Natural", ylim=c(0,70000))
hist(fpafod$startday[fpafod$STAT_CAUSE_CODE > 1], breaks=seq(-0.5,31.5,by=1), freq=-TRUE,
  main="FPA-FOD Human", ylim=c(0,70000))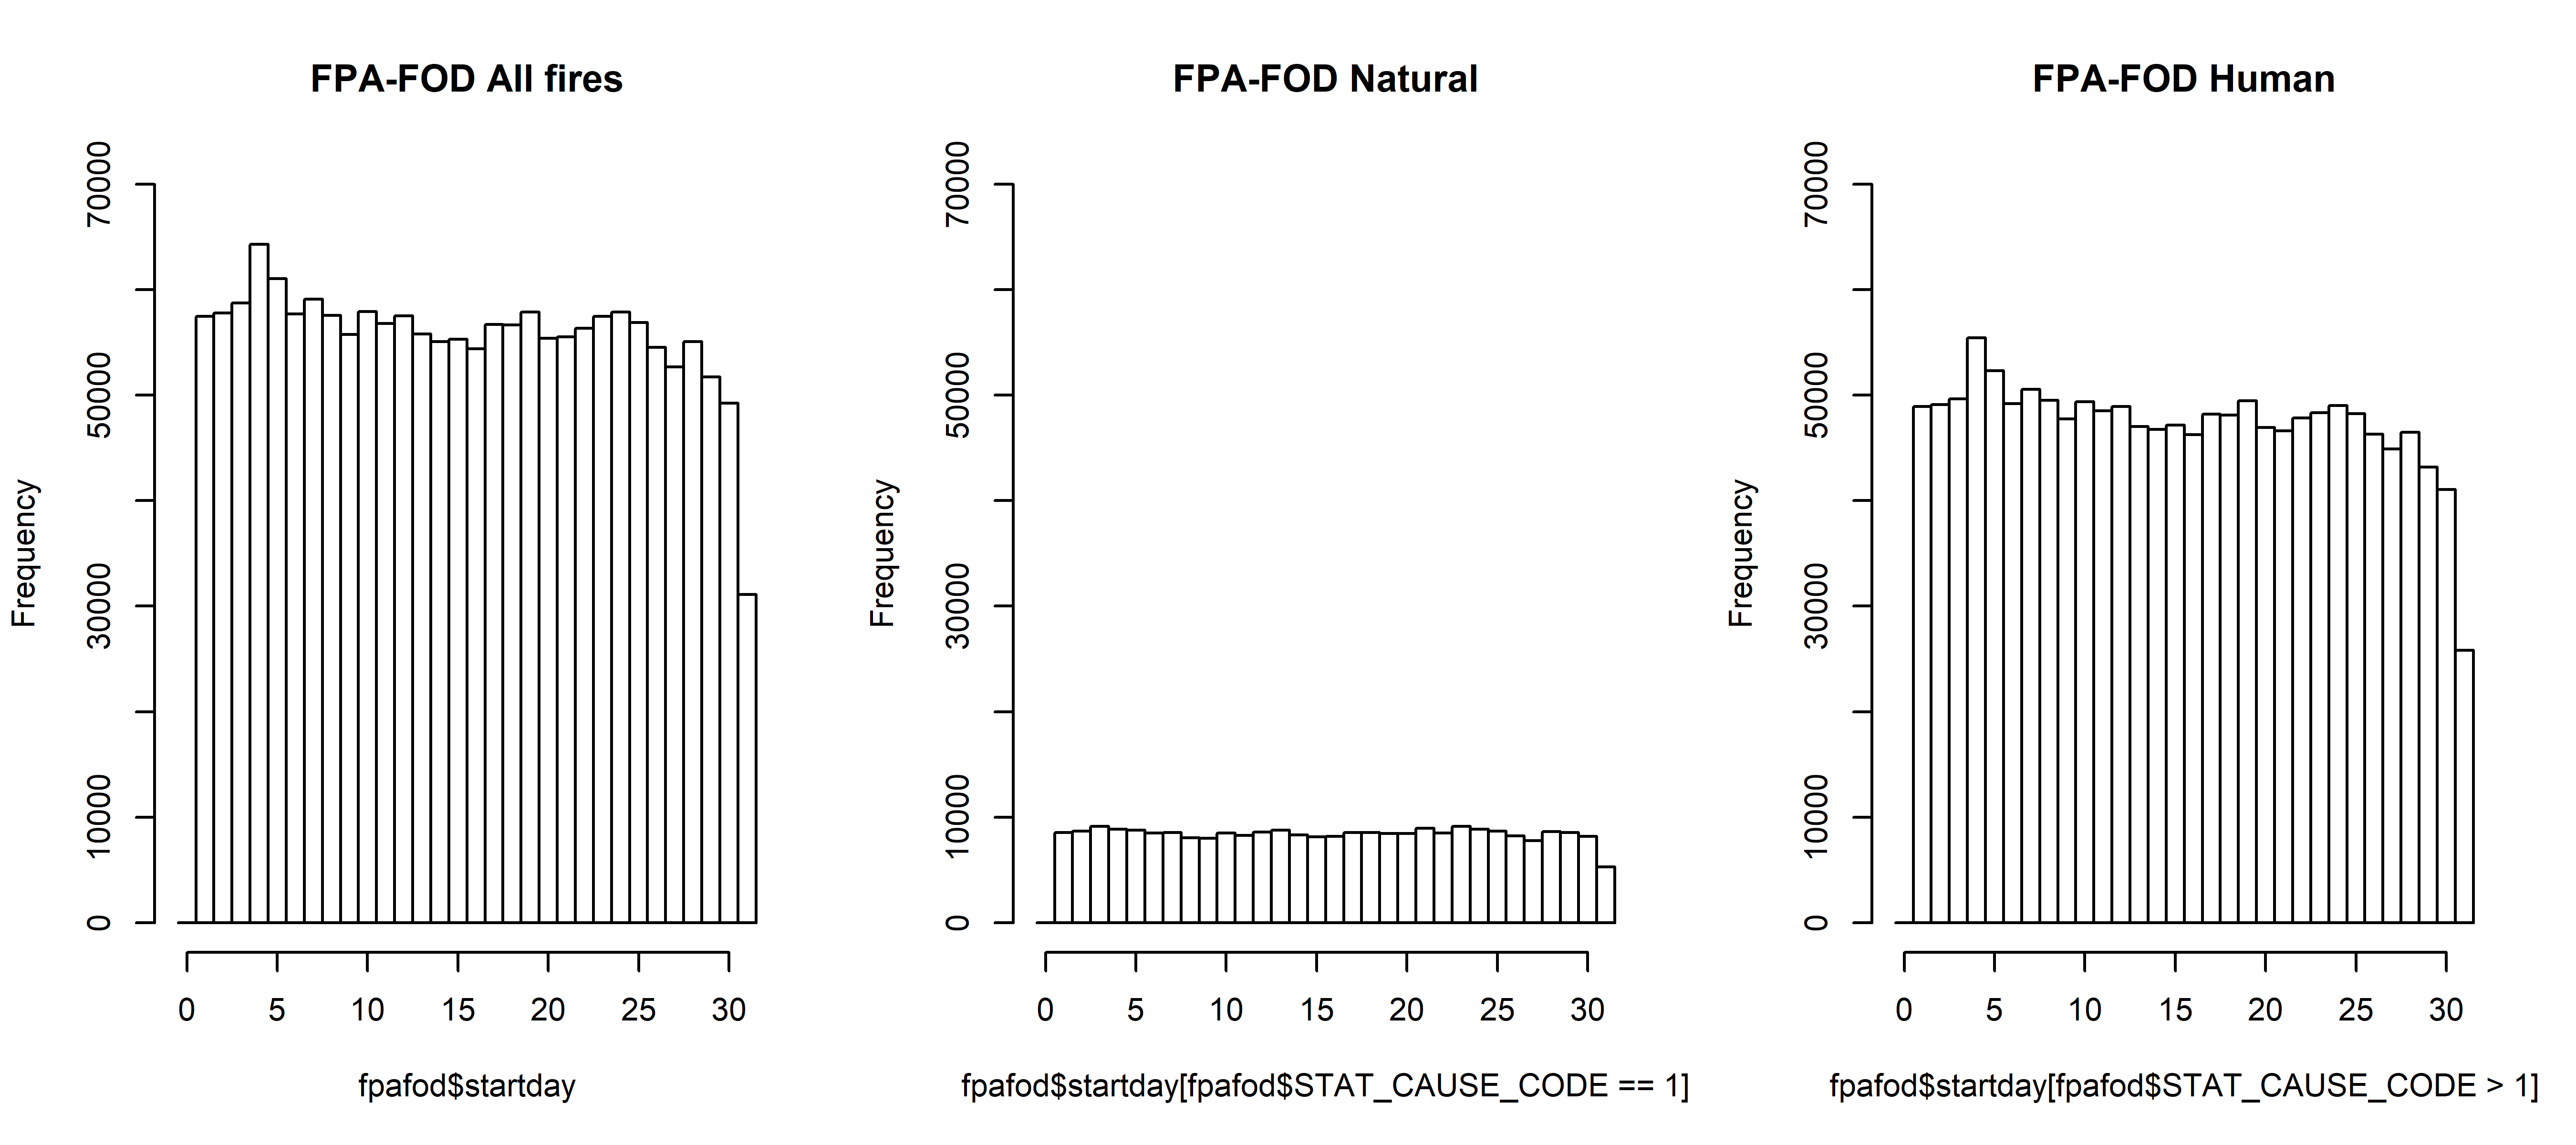
par(oldpar)Note that the distribution of start days over the month seems appropriate. (Note also that day 4 (across all months) stands out a little in all and human-started fires, see more on this below.) There are more fires in the FPA-FOD data than in the FWFOD set, with most of the additional fires being human-started fires.
Here are the histograms of startdaynum, the day of the year for each fire:
hist(fpafod$DISCOVERY_DOY, breaks=seq(-0.5,366.5,by=1), freq=-TRUE,
  ylim=c(0,12000), xlim=c(0,360), col="black", xaxp=c(0, 360, 12))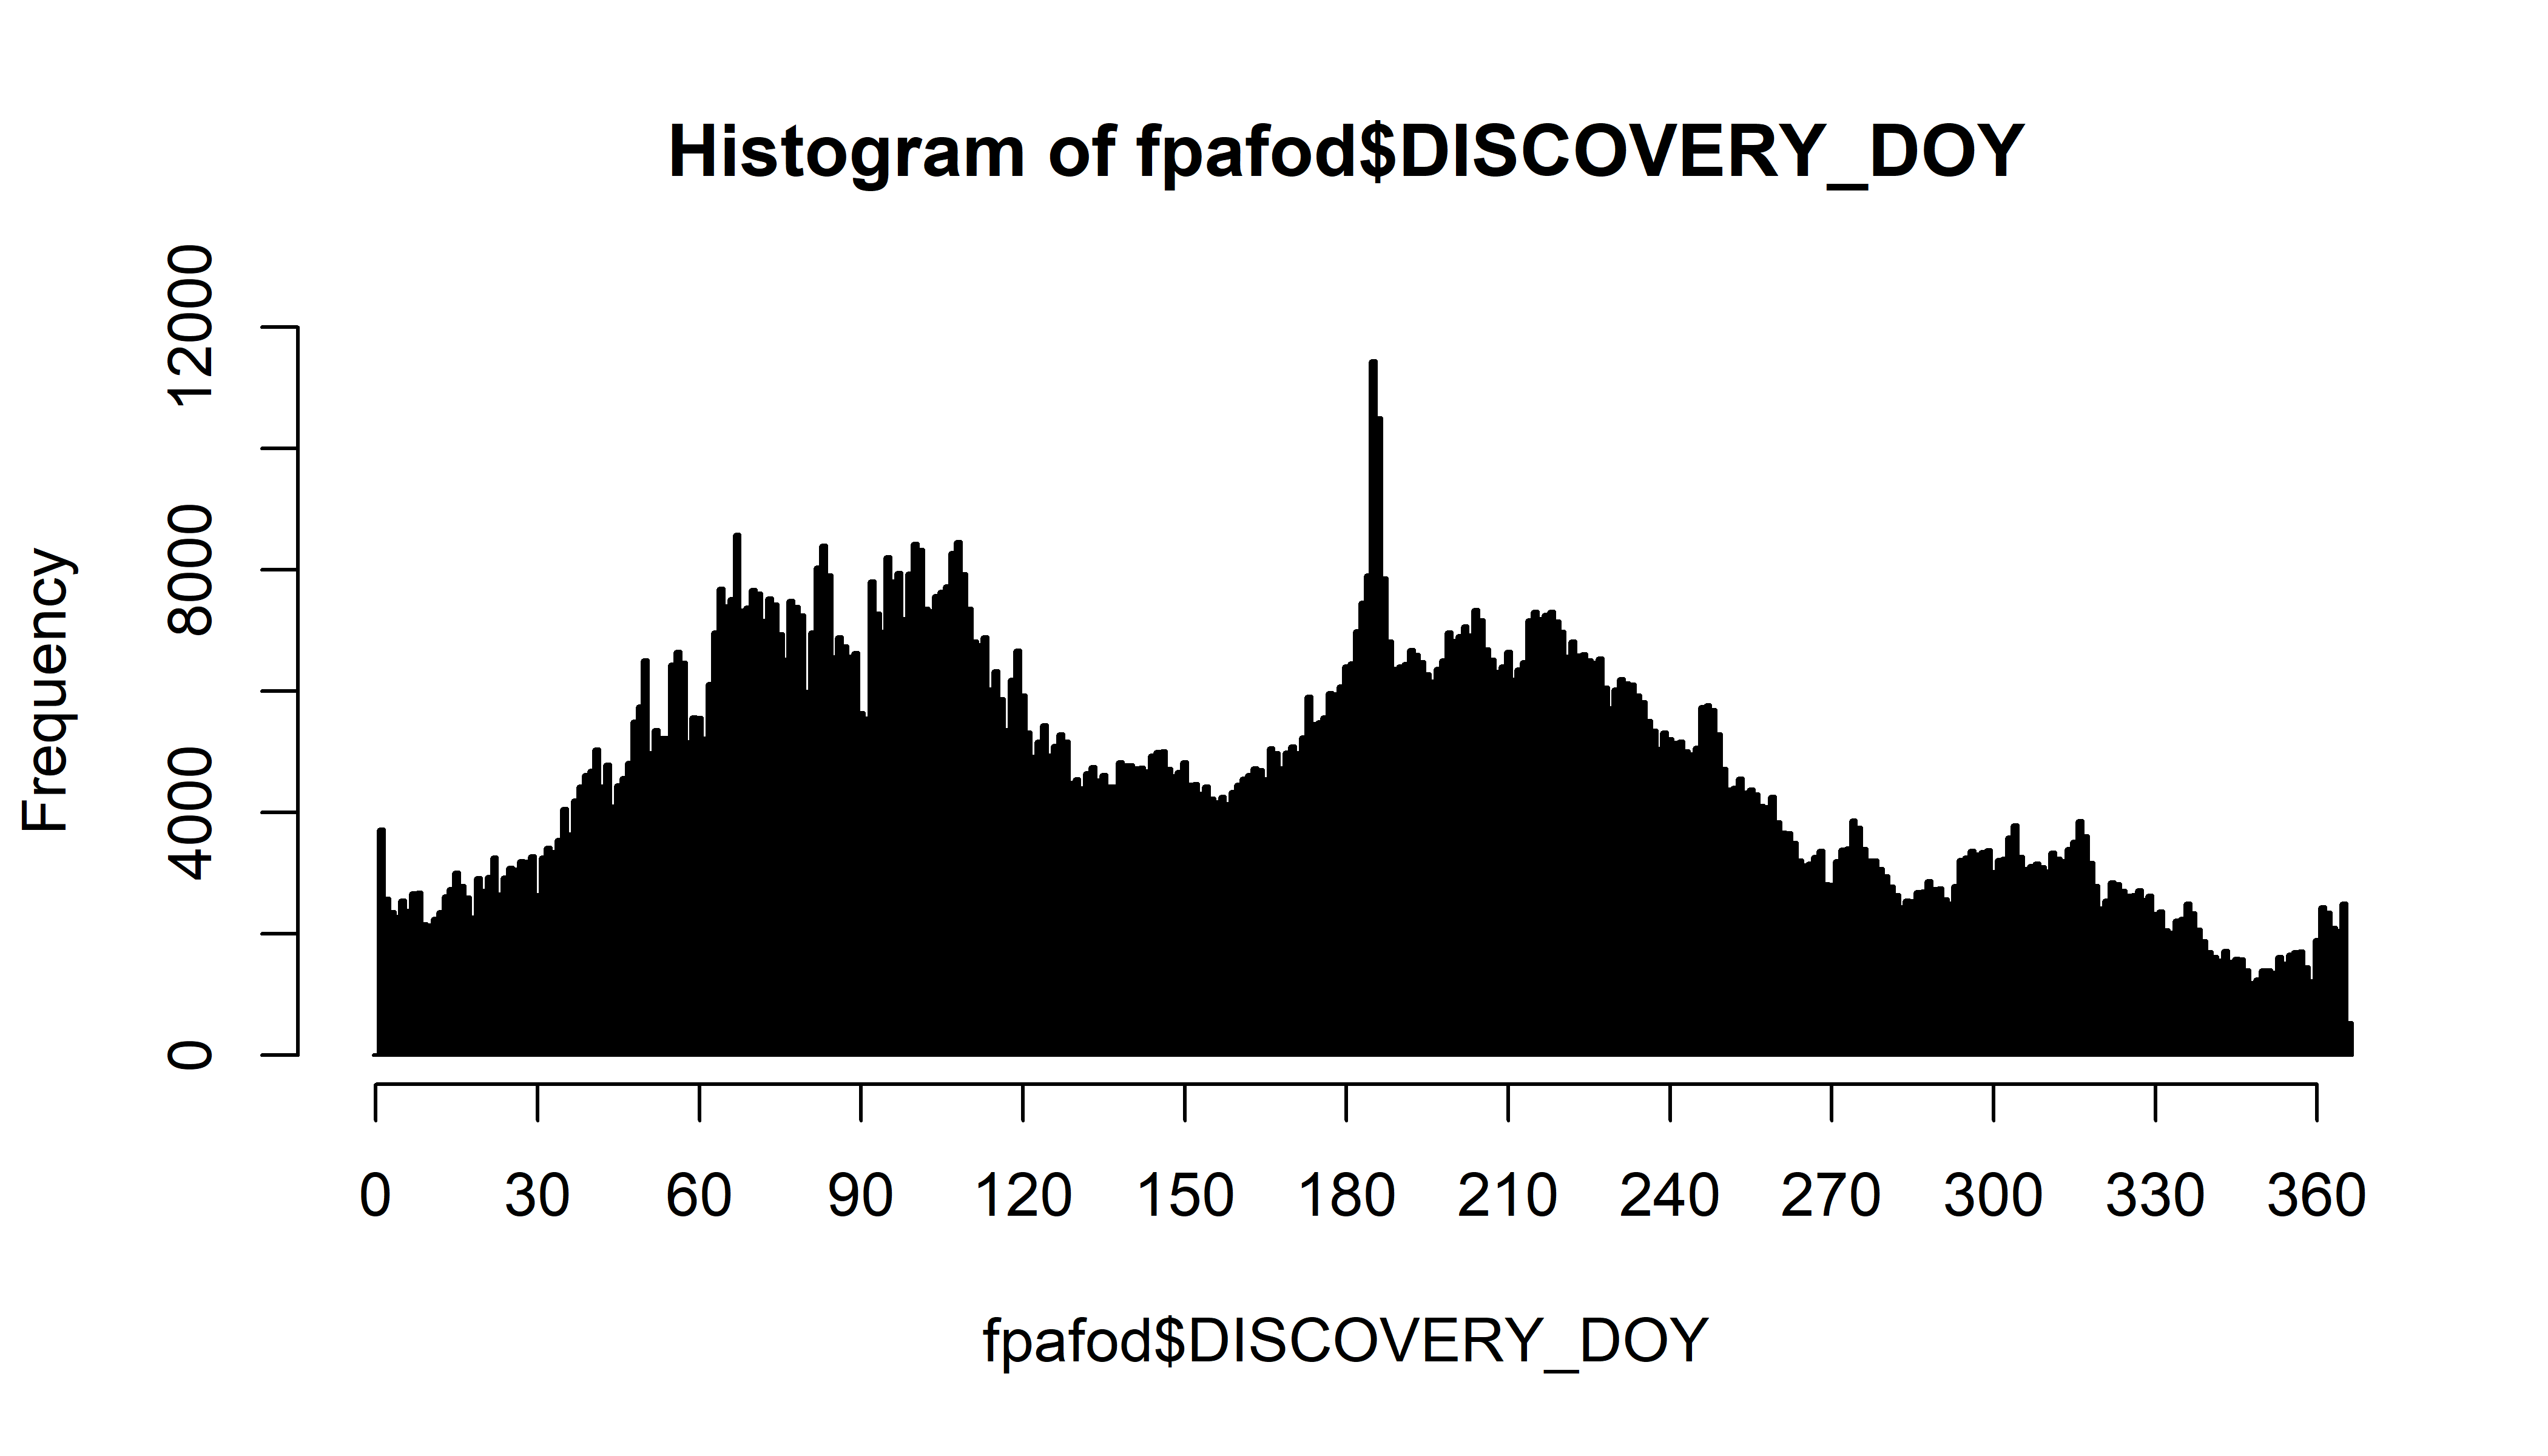
hist(fpafod$DISCOVERY_DOY[fpafod$STAT_CAUSE_CODE == 1], breaks=seq(-0.5,366.5,by=1), freq=-TRUE,
  ylim=c(0,12000), xlim=c(0,360), col="black", xaxp=c(0, 360, 12), main="DISCOVERY_DOY (Natural)")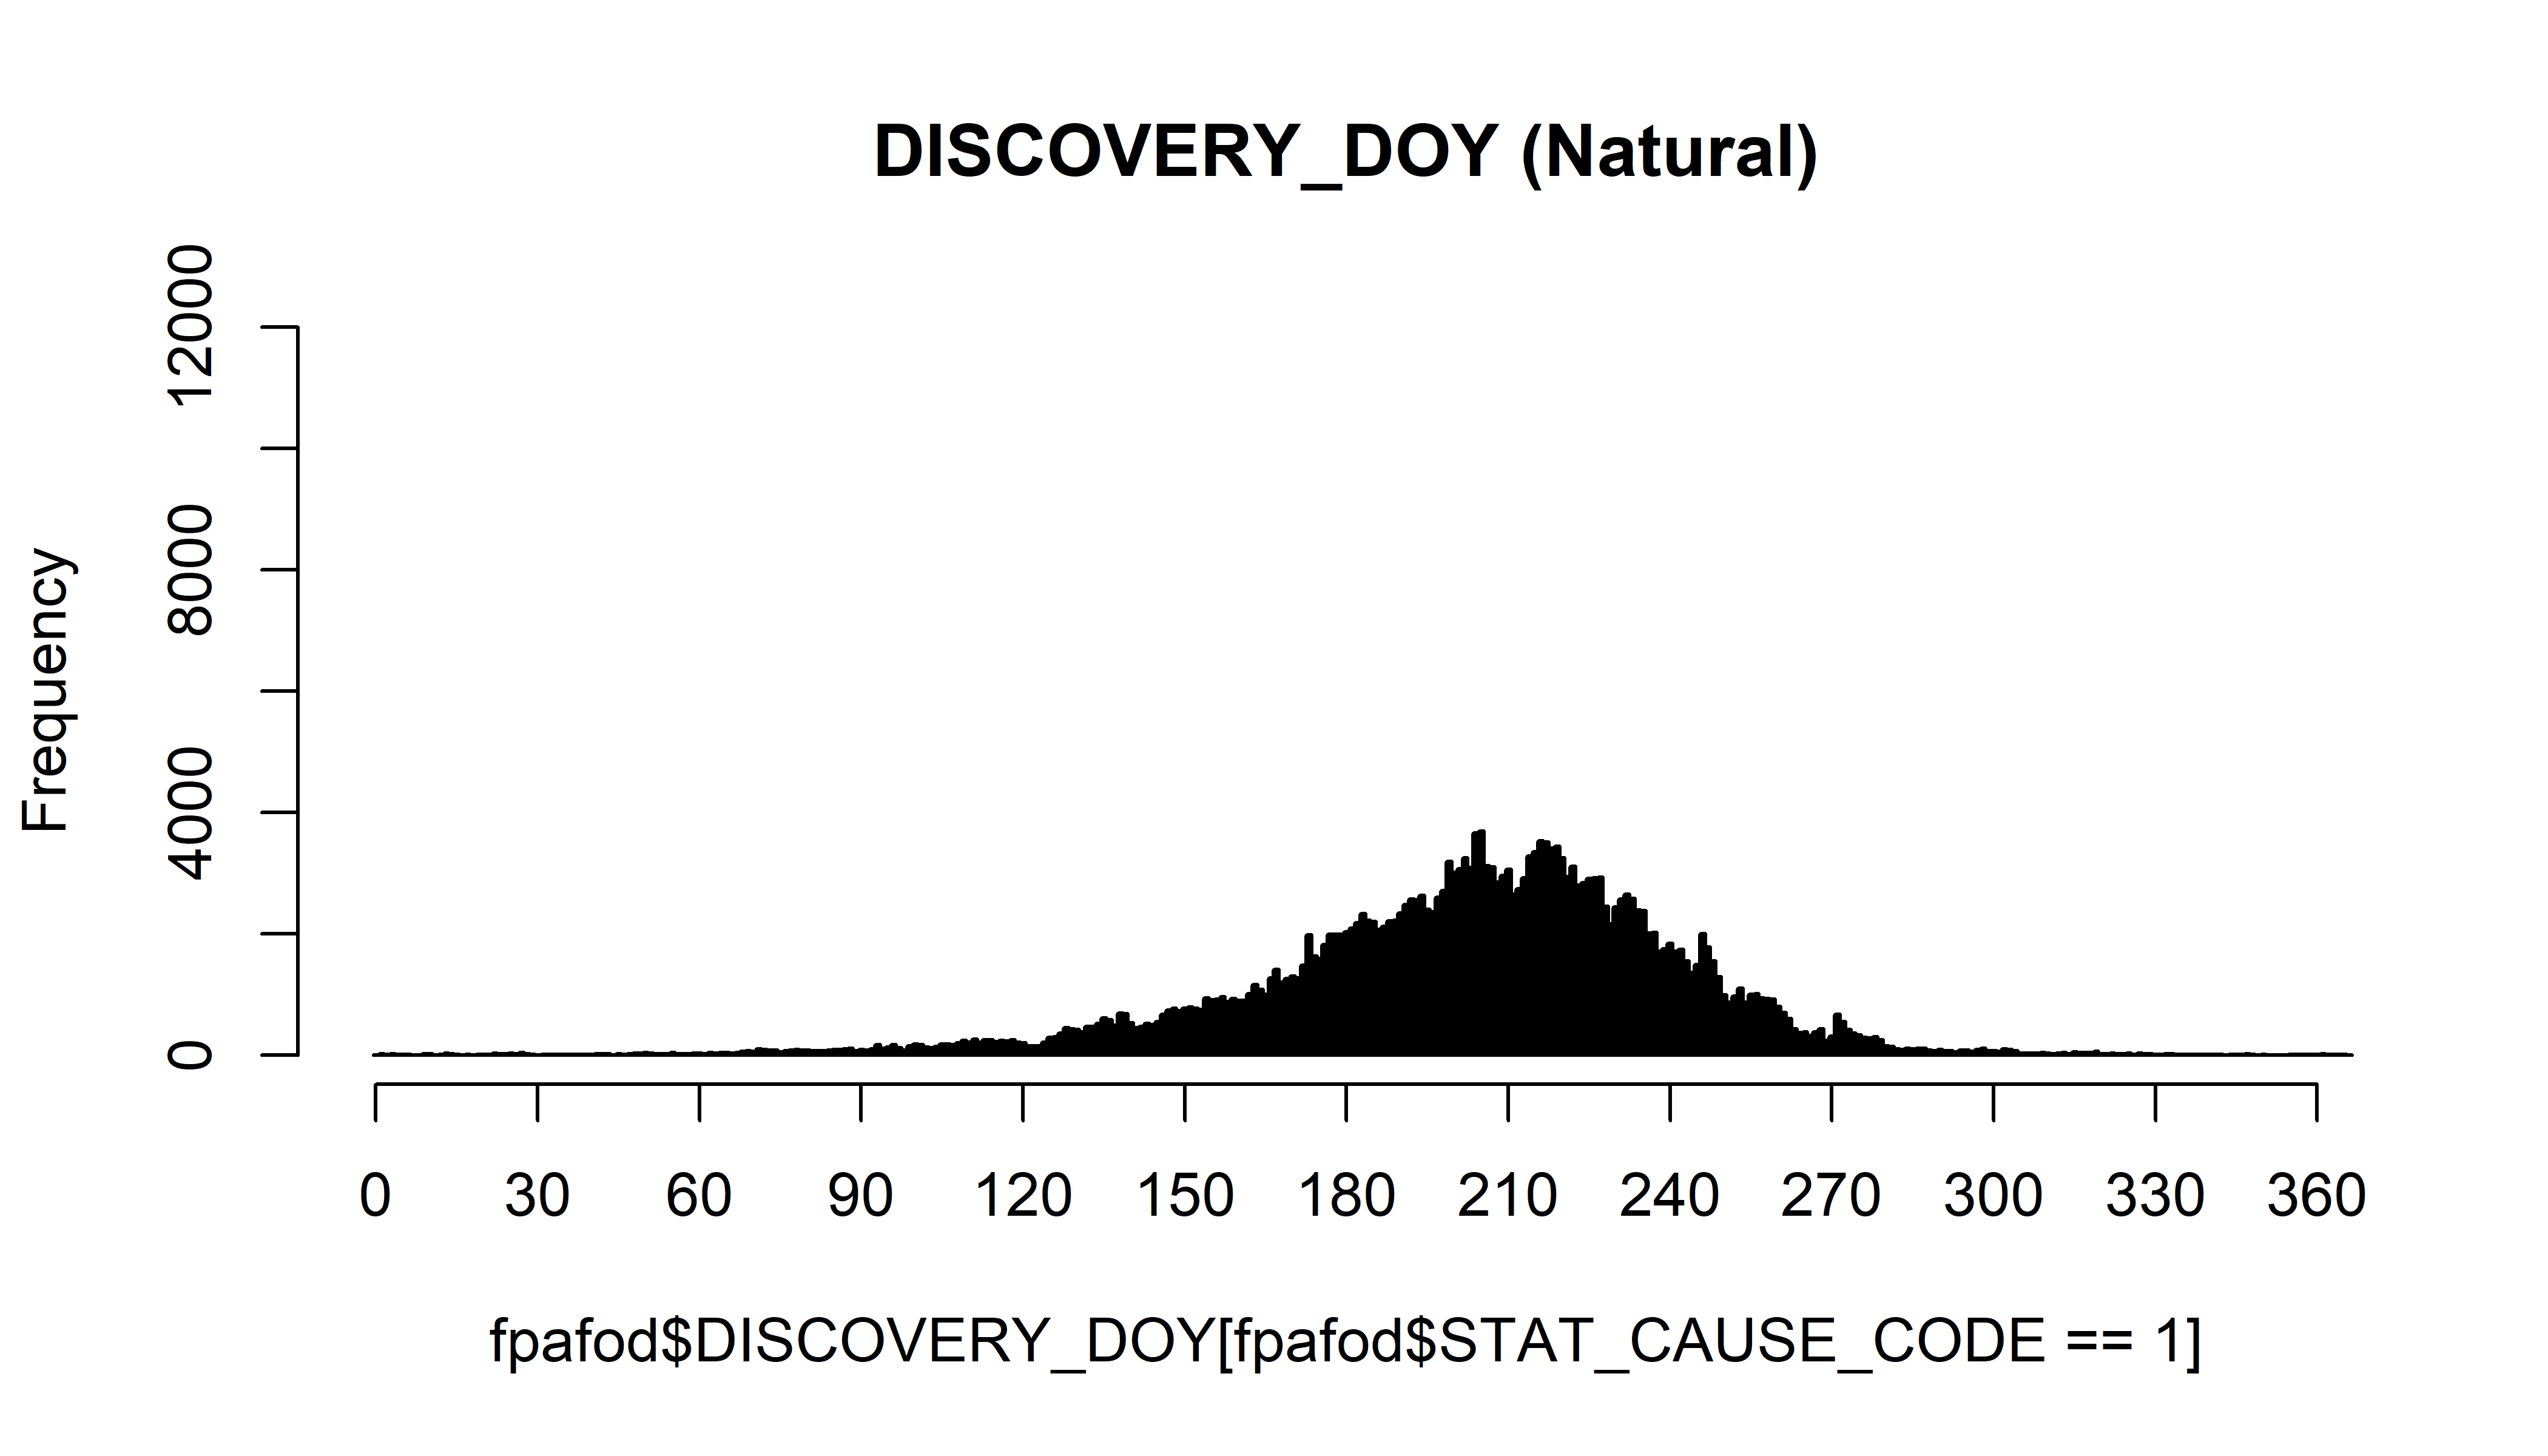
hist(fpafod$DISCOVERY_DOY[fpafod$STAT_CAUSE_CODE > 1], breaks=seq(-0.5,366.5,by=1), freq=-TRUE,
  ylim=c(0,12000), xlim=c(0,360), col="black", xaxp=c(0, 360, 12), main="DISCOVERY_DOY (Human)")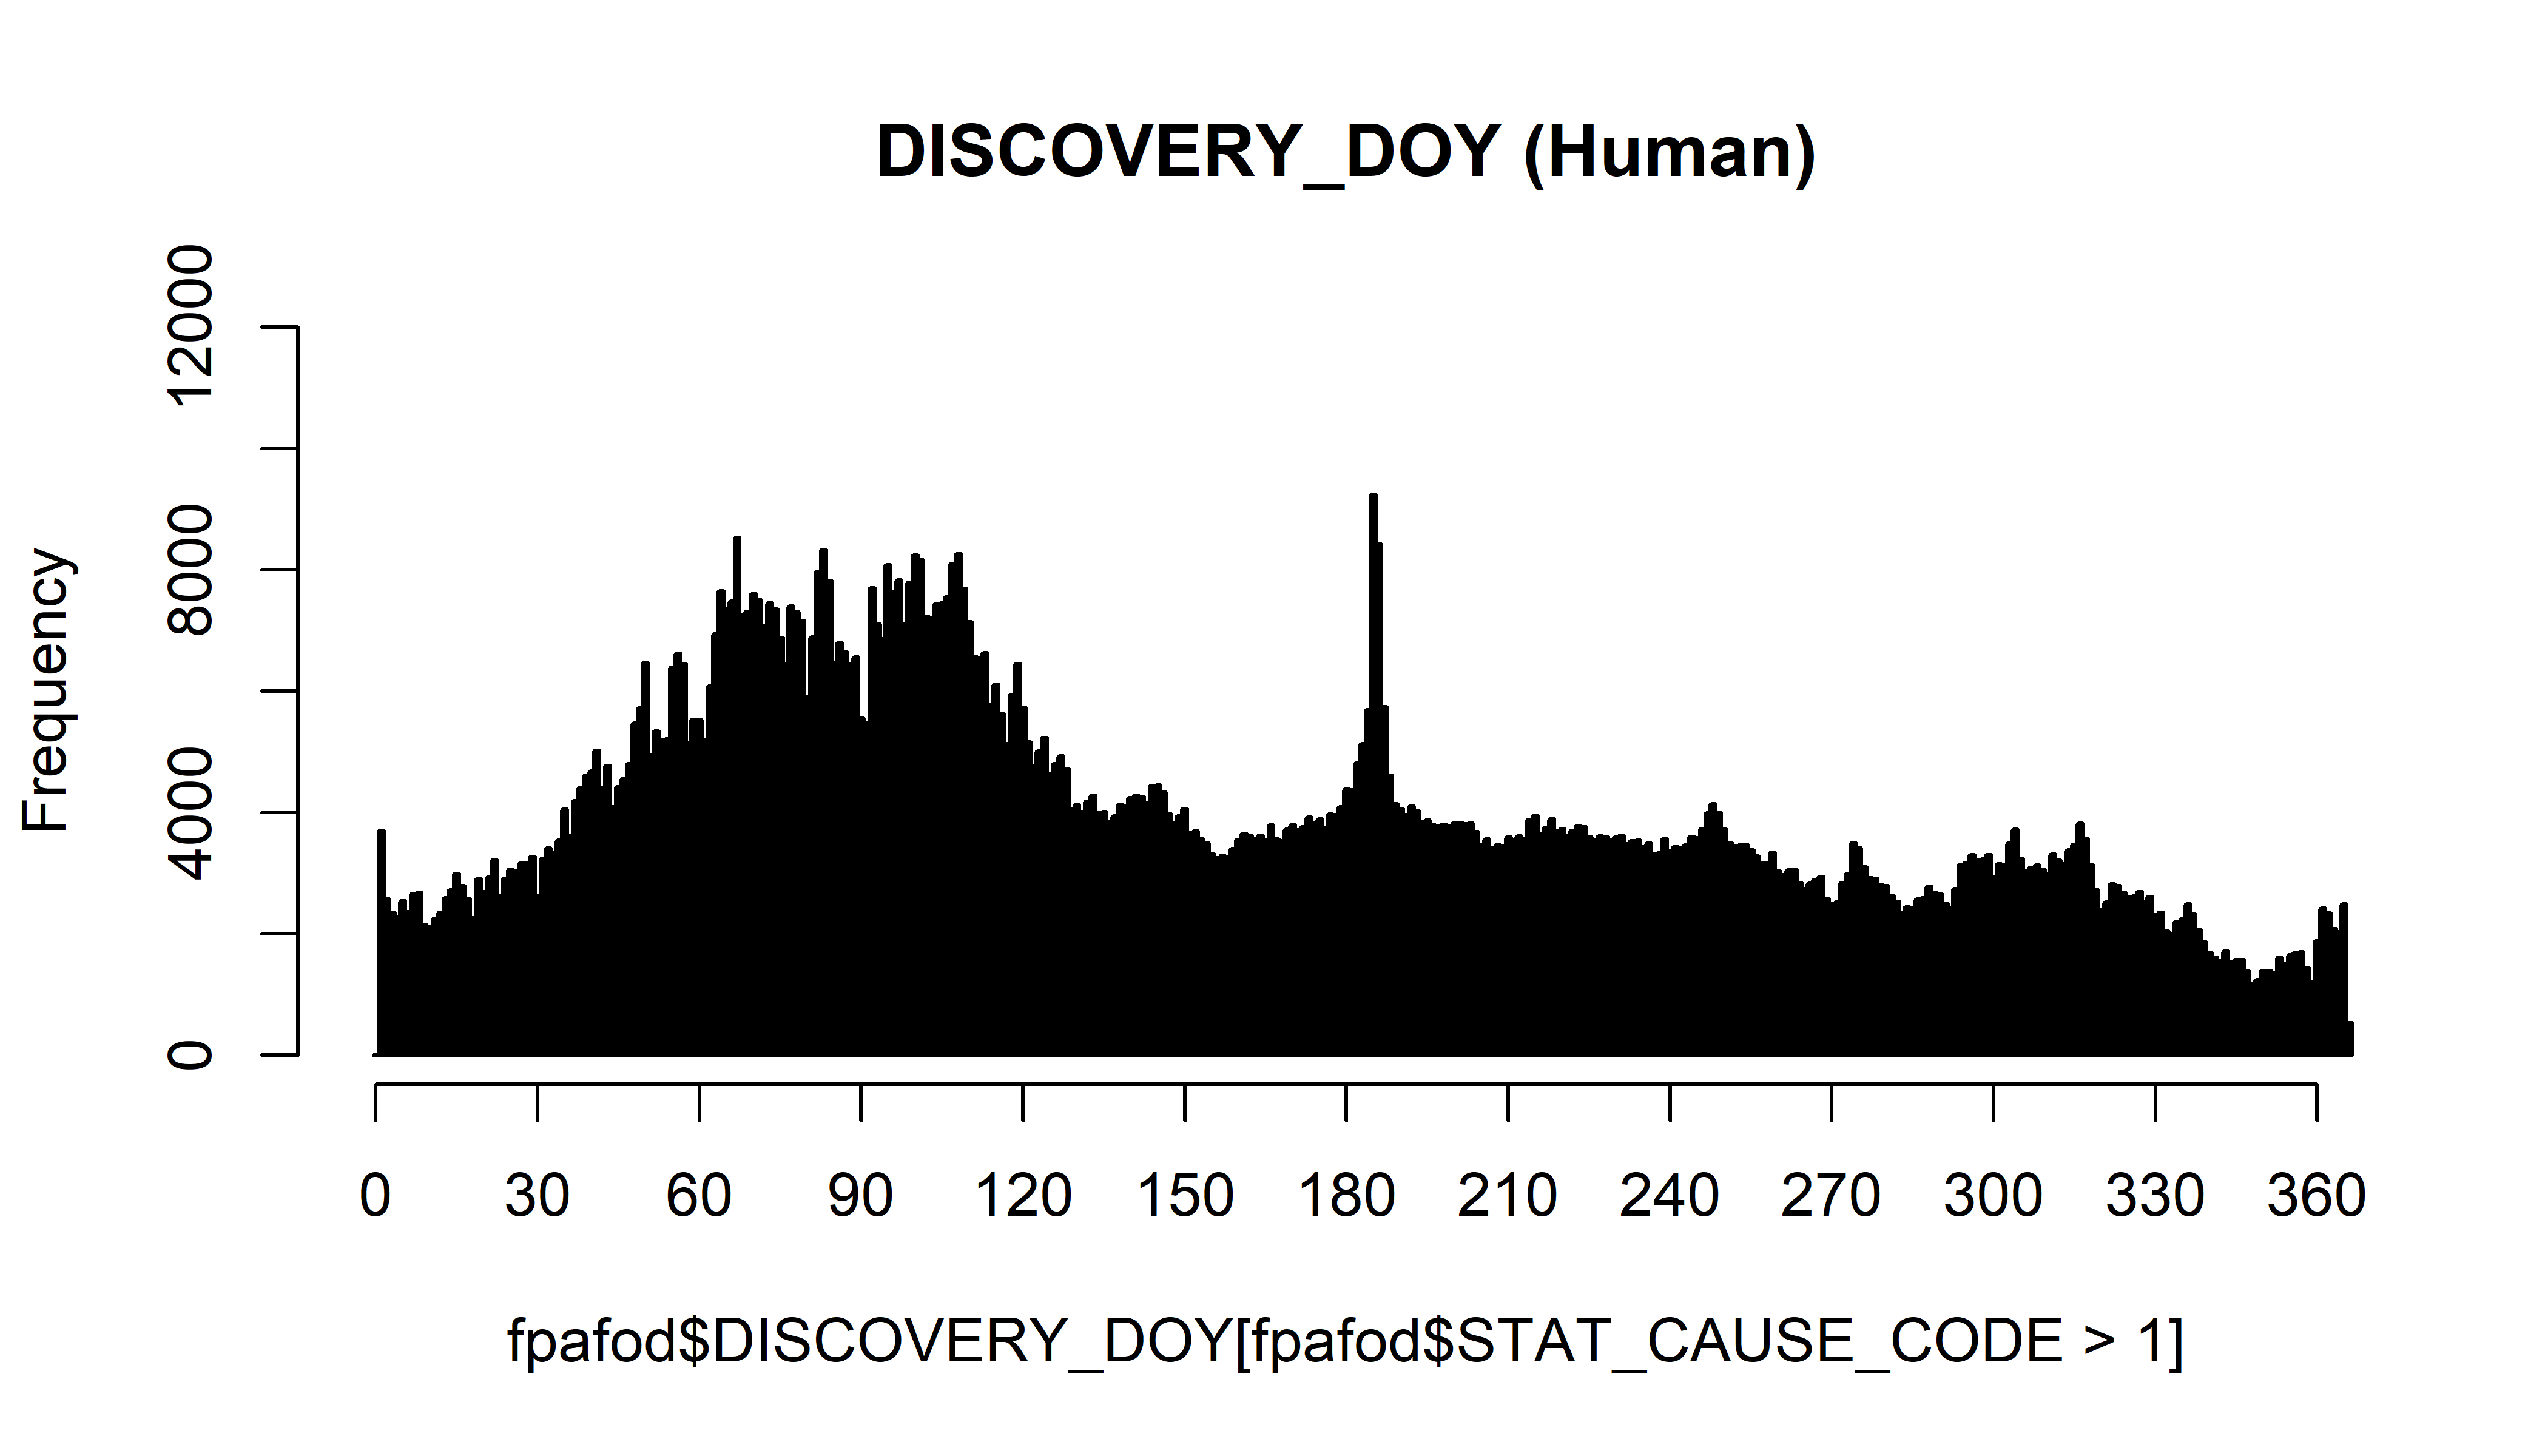
Note that relative to the FWFOD data, the FPA-FOD data include many more human-started fires in the first third of the year.
2.2 Comparison summary
The histograms and tables show that the unusually low incidence of fires in the first nine days of the month in the FWFOD data is not evident in the FPA-FOD data set. The histgrams of DISCOVERY_DOY also clearly show the “Fourth of July” anomaly in human fires noted by Bartlein et al. (2008), which is absent in the FWFOD data. The peak appears at days 185 and 186, with the spread likely related to “three-day-weekend” plus leap-year effects. Another smaller peak is evident at days 246 to 248, corresponding to the Labor Day weekend. These peaks do not appear in the FWFOD data.
The more regular distribution of fire-start days (1-31) in the FPA-FOD data set, and the absence of missing chunks in the histogram of DISCOVERY_DOY suggests that the features evident in the FWFOD data set are not general characteristics of fire-start data sets but are anomalies unique to the FWFOD data.
3 Further comparisons
3.1 Start-day distributions
Some additional comparisons can be made between the two data sets. First, create a pair of indicator variables that classify each fire as to whether it occurs on days 1-9, as opposed to 10-31, in each month:
# fwfod
fwfod_nonmissing$startday2 <- fwfod_nonmissing$startday
fwfod_nonmissing$startday2 <- ifelse(fwfod_nonmissing$startday2 <= 9,
  fwfod_nonmissing$startday2 <- "1-9", fwfod_nonmissing$startday2 <- "10-31")
table(fwfod_nonmissing$startday2)
##
## 1-9 10-31
## 120855 484894# fpafod
fpafod$startday2 <- fpafod$startday
fpafod$startday2 <- ifelse(fpafod$startday2 <= 9,
fpafod$startday2 <- "1-9", fpafod$startday2 <- "10-31")
table(fpafod$startday2)##
## 1-9 10-31
## 529546 1197930There is no straightforward way to discover the nature of the “missing” day 1-9 fires, owing to the basic difference in size of the two data sets, with the FWFOD data consisting of 709972 records and the FPAFOD data consisting of 1727476 records, a difference that becomes exaggerated when the records with missing STARTDATED values are removed.
3.2 Annual time series
3.2.1 Fire numbers
The main difference between the two is the greater number of fires overall in the FPA-FOD data set:
total_by_year_fwfod <- table(fwfod_nonmissing$startyear)
total_by_year_fwfod
##
## 1980 1981 1982 1983 1984 1985 1986 1987 1988 1989 1990 1991 1992 1993 1994 1995 1996
## 8954 10328 6278 6451 9147 10390 15489 19422 19908 17797 17830 17332 19320 14300 23666 16754 20189
## 1997 1998 1999 2000 2001 2002 2003 2004 2005 2006 2007 2008 2009 2010 2011 2012 2013
## 14309 18183 21657 23064 21303 20639 22155 19210 19508 24576 20414 15651 15742 14946 15801 16320 16378
## 2014 2015
## 15475 16863total_by_year_fpafod <- table(fpafod$startyear)
total_by_year_fpafod##
## 1992 1993 1994 1995 1996 1997 1998 1999 2000 2001 2002 2003 2004 2005 2006
## 67964 62019 75992 71496 75604 61472 68388 89398 96454 86069 75136 67380 68616 87391 113242
## 2007 2008 2009 2010 2011 2012 2013
## 94681 84654 77263 78484 89897 71768 64108total_by_year_fwfod_all <- table(fwfod_all$YEAR_)
total_by_year_fwfod_all##
## 1980 1981 1982 1983 1984 1985 1986 1987 1988 1989 1990 1991 1992 1993 1994 1995 1996
## 10407 12115 7717 8698 11511 13693 18551 22356 22743 20457 21348 20266 22926 17669 27877 20848 24915
## 1997 1998 1999 2000 2001 2002 2003 2004 2005 2006 2007 2008 2009 2010 2011 2012 2013
## 17851 22327 25616 27980 26535 25374 26257 23086 24483 31016 25293 19468 19668 18263 19466 20809 16706
## 2014 2015
## 15617 16976total_by_year_fwfod_missing <- table(fwfod_missing$YEAR_)
total_by_year_fwfod_missing##
## 1980 1981 1982 1983 1984 1985 1986 1987 1988 1989 1990 1991 1992 1993 1994 1995 1996 1997 1998 1999 2000
## 1453 1787 1439 2247 2364 3303 3062 2934 2835 2660 3518 2934 3606 3369 4211 4094 4726 3542 4144 3959 4916
## 2001 2002 2003 2004 2005 2006 2007 2008 2009 2010 2011 2012 2013 2014 2015
## 5232 4735 4102 3876 4975 6440 4879 3817 3926 3317 3667 4510 317 128 113Plot the individual data sets by year, with the FPA-FOD data in blue, the FWFOD data with nonmissing values of STARTDATED in red (fwfod), all fires (whith valid values of YEAR_) in the FWFOD data set in purple (fwfod_all), and the number of fires in the FWFOD data set with missing STARTDATED values in black (fwfod_missing):
plot(NULL, xlim=c(1980, 2014), ylim=c(0,120000), xlab="Year",
  ylab="Number of Fires", main="FPA-FOD & FWFOD, All Fires")
points(total_by_year_fpafod, pch=16, type="o", lwd=3, col="blue")
points(total_by_year_fwfod, pch=16, type="o", lwd=3, col="red")
points(total_by_year_fwfod_all, pch=16, type="o", lwd=3, col="purple")
points(total_by_year_fwfod_missing, pch=16, type="o", lwd=3, col="black")
legend("topleft", legend=c("FPA-FOD","FWFOD_nonmissing","FWFOD_all","FWFOD_missing"), cex=0.5,
  lwd=3, col=c("blue","red","purple","black"))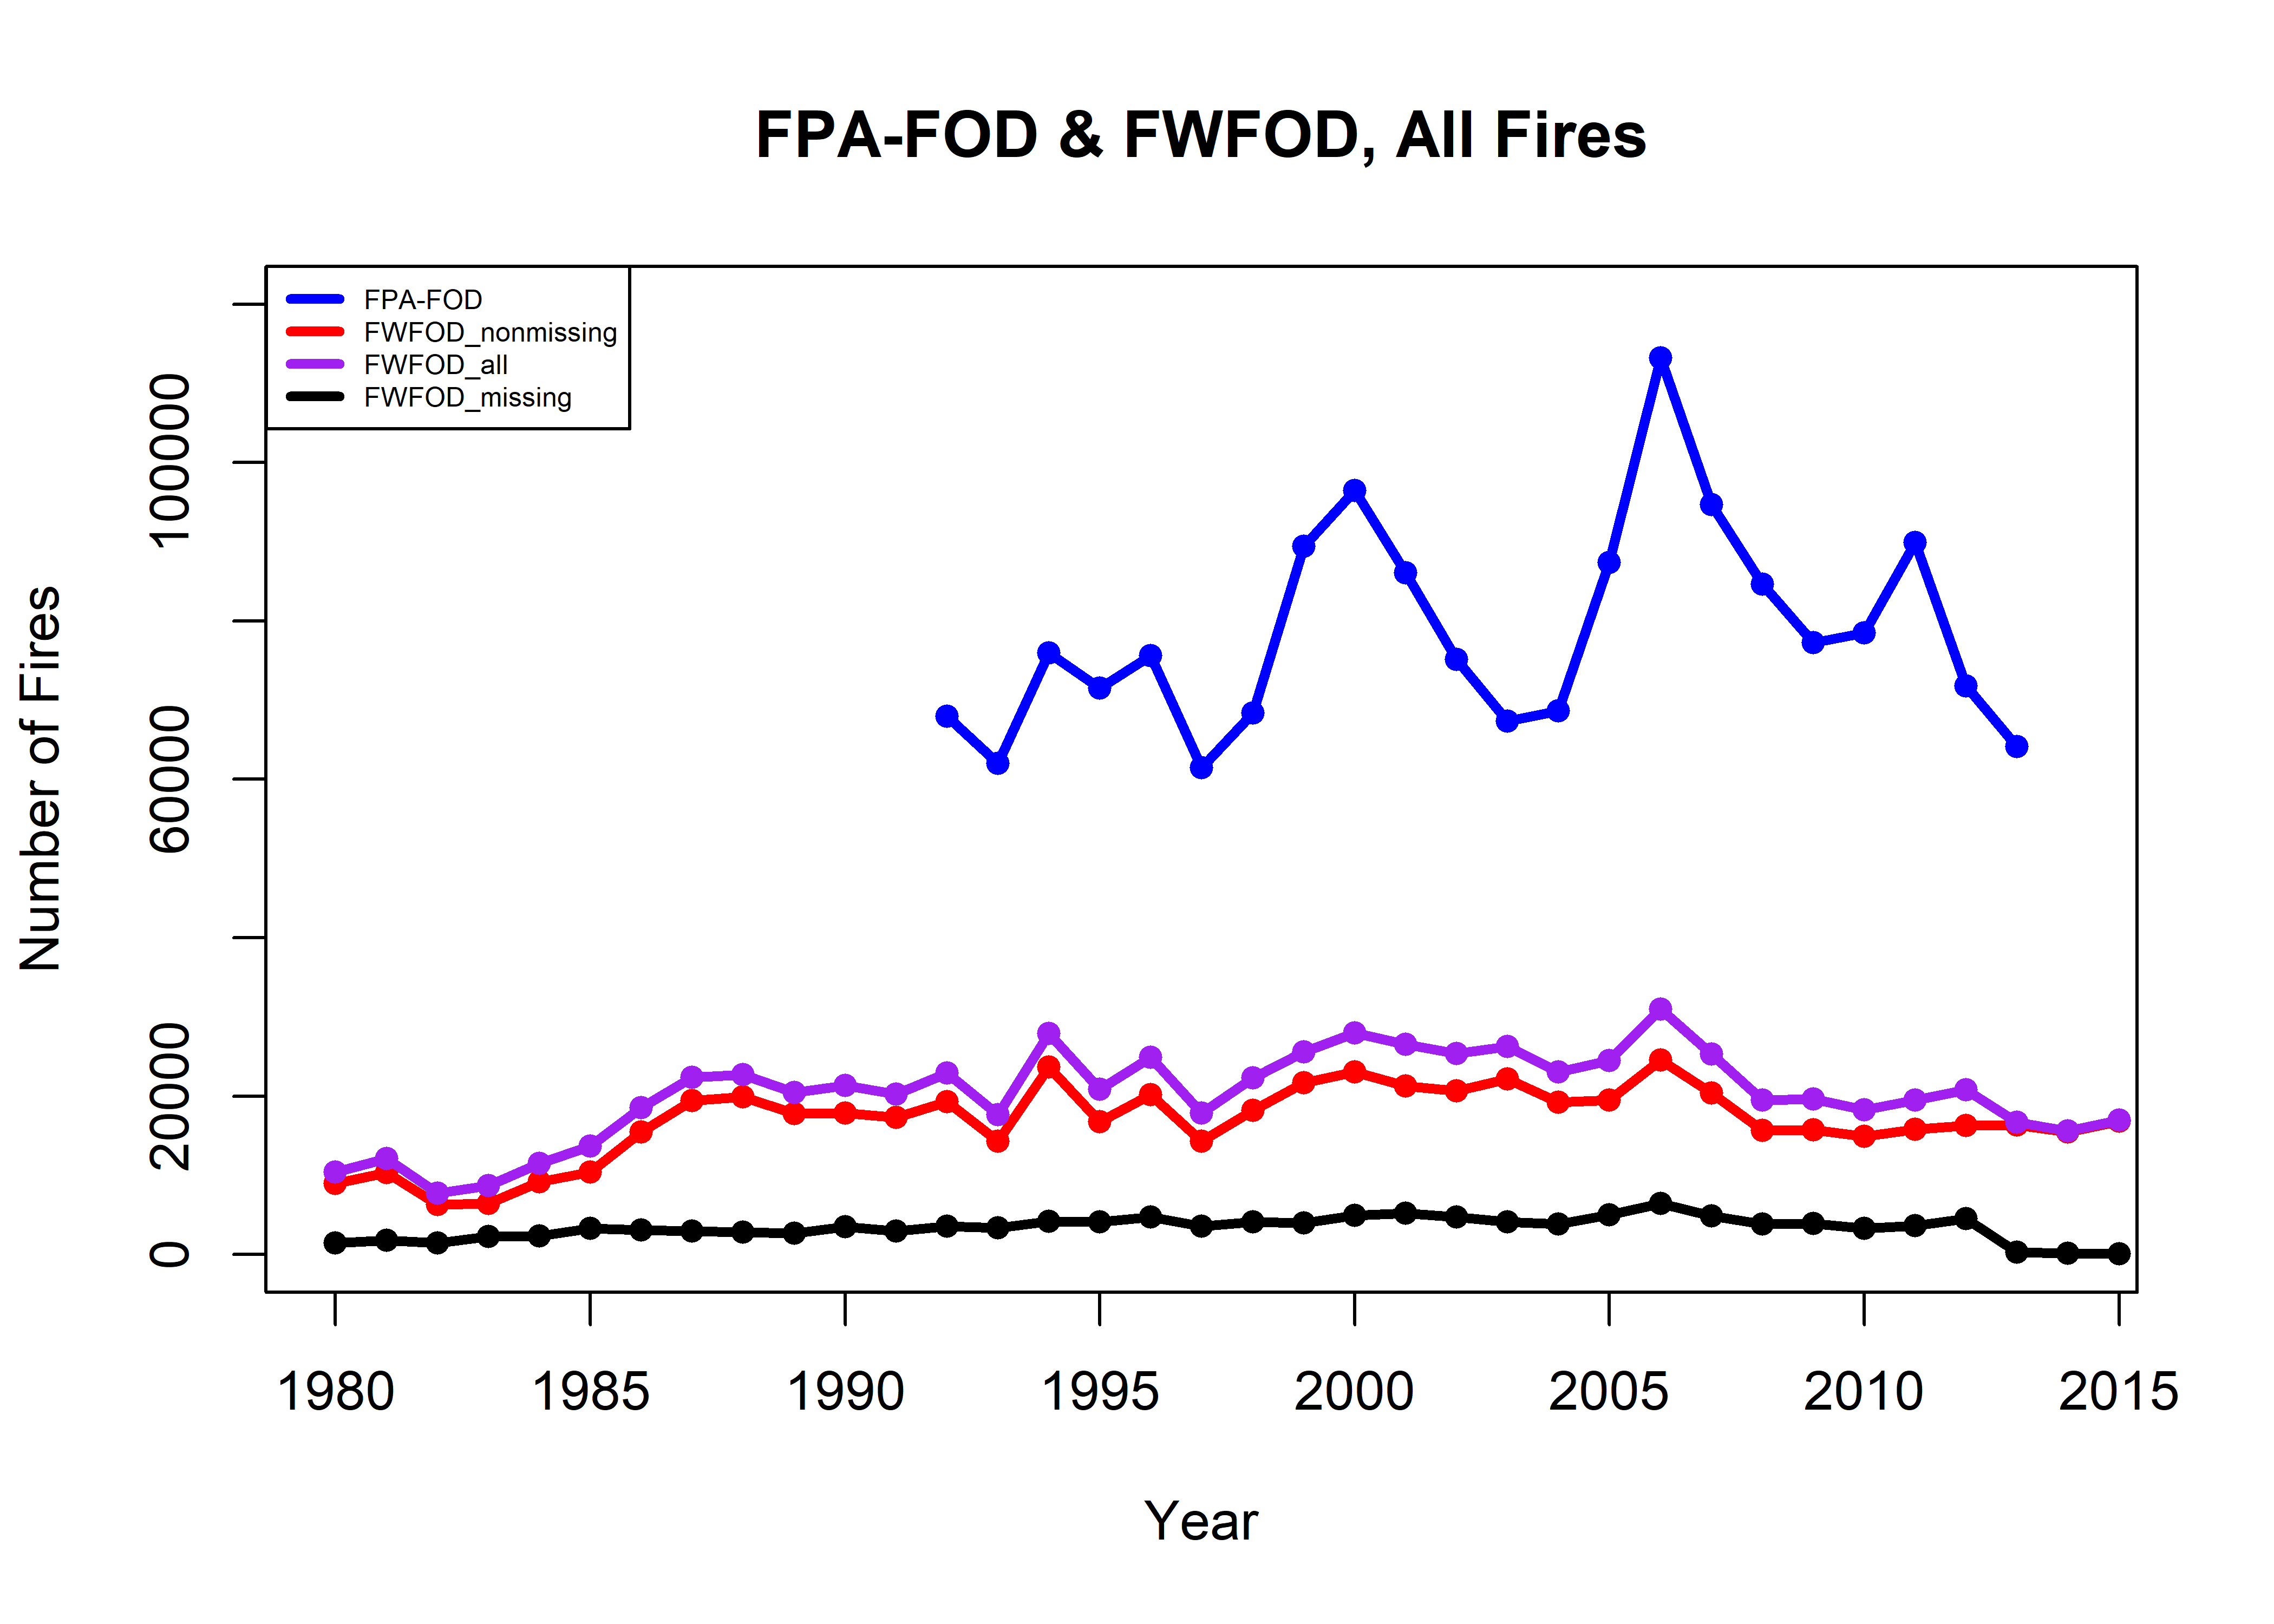
When the records with missing values of STARTDATED are included there are still many fewer fires in the FWFOD data set than in the FPA-FOD data.
This difference in number of fires is mainly attributable to more humuan-started fires in the FPA-FOD data. The difference in numbers of natural fires between data sets is much smaller:
total_by_year_fwfod_natural <- table(fwfod_nonmissing$startyear[fwfod_nonmissing$CAUSE=="Natural"])
total_by_year_fwfod_natural
##
## 1980 1981 1982 1983 1984 1985 1986 1987 1988 1989 1990 1991 1992 1993 1994 1995 1996
## 3069 3959 2598 2517 4115 4127 7003 8470 9490 8653 8332 9200 10207 4925 9624 7321 9989
## 1997 1998 1999 2000 2001 2002 2003 2004 2005 2006 2007 2008 2009 2010 2011 2012 2013
## 6185 7280 7985 11248 9632 8739 11392 9243 7209 11162 8055 5840 6656 5358 6391 6305 7959
## 2014 2015
## 6367 6731total_by_year_fpafod_natural <- table(fpafod$startyear[fpafod$STAT_CAUSE_CODE == 1])
total_by_year_fpafod_natural##
## 1992 1993 1994 1995 1996 1997 1998 1999 2000 2001 2002 2003 2004 2005 2006 2007 2008
## 12240 7544 16213 8078 12643 8456 10893 11810 16559 13842 12480 13849 11732 11104 16958 12719 9914
## 2009 2010 2011 2012 2013
## 10492 8980 12539 11130 10136total_by_year_fwfod_natural_all <- table(fwfod_all$YEAR_[fwfod_all$CAUSE=="Natural"])
total_by_year_fwfod_natural_all##
## 1980 1981 1982 1983 1984 1985 1986 1987 1988 1989 1990 1991 1992 1993 1994 1995 1996
## 3501 4428 2986 3336 4896 5251 8273 9465 10173 9518 9836 10001 11187 5740 10949 8361 11419
## 1997 1998 1999 2000 2001 2002 2003 2004 2005 2006 2007 2008 2009 2010 2011 2012 2013
## 7093 8093 9070 13004 11736 10047 12797 10357 8461 13357 9489 6923 8055 6295 7470 7890 8217
## 2014 2015
## 6379 6738total_by_year_fwfod_natural_missing <- table(fwfod_missing$YEAR_[fwfod_missing$CAUSE=="Natural"])
total_by_year_fwfod_natural_missing##
## 1980 1981 1982 1983 1984 1985 1986 1987 1988 1989 1990 1991 1992 1993 1994 1995 1996 1997 1998 1999 2000
## 432 469 388 819 781 1124 1270 995 683 865 1504 801 980 815 1325 1040 1430 908 813 1085 1756
## 2001 2002 2003 2004 2005 2006 2007 2008 2009 2010 2011 2012 2013 2014 2015
## 2104 1308 1405 1114 1252 2195 1434 1083 1399 937 1080 1596 249 7 7Plot the numbers of natural fires in the two data sets by year:
plot(NULL, xlim=c(1980, 2014), ylim=c(0,20000), xlab="Year",
  ylab="Number of Fires", main="FPA-FOD & FWFOD, Natural Fires")
points(total_by_year_fpafod_natural, pch=16, type="o", lwd=3, col="blue")
points(total_by_year_fwfod_natural, pch=16, type="o", lwd=3, col="red")
points(total_by_year_fwfod_natural_all, pch=16, type="o", lwd=3, col="purple")
points(total_by_year_fwfod_natural_missing, pch=16, type="o", lwd=3, col="black")
legend("topleft", legend=c("FPA-FOD","FWFOD_nonmissing","FWFOD_all","FWFOD_missing"), lwd=3, cex=0.5,
  col=c("blue","red","purple","black"))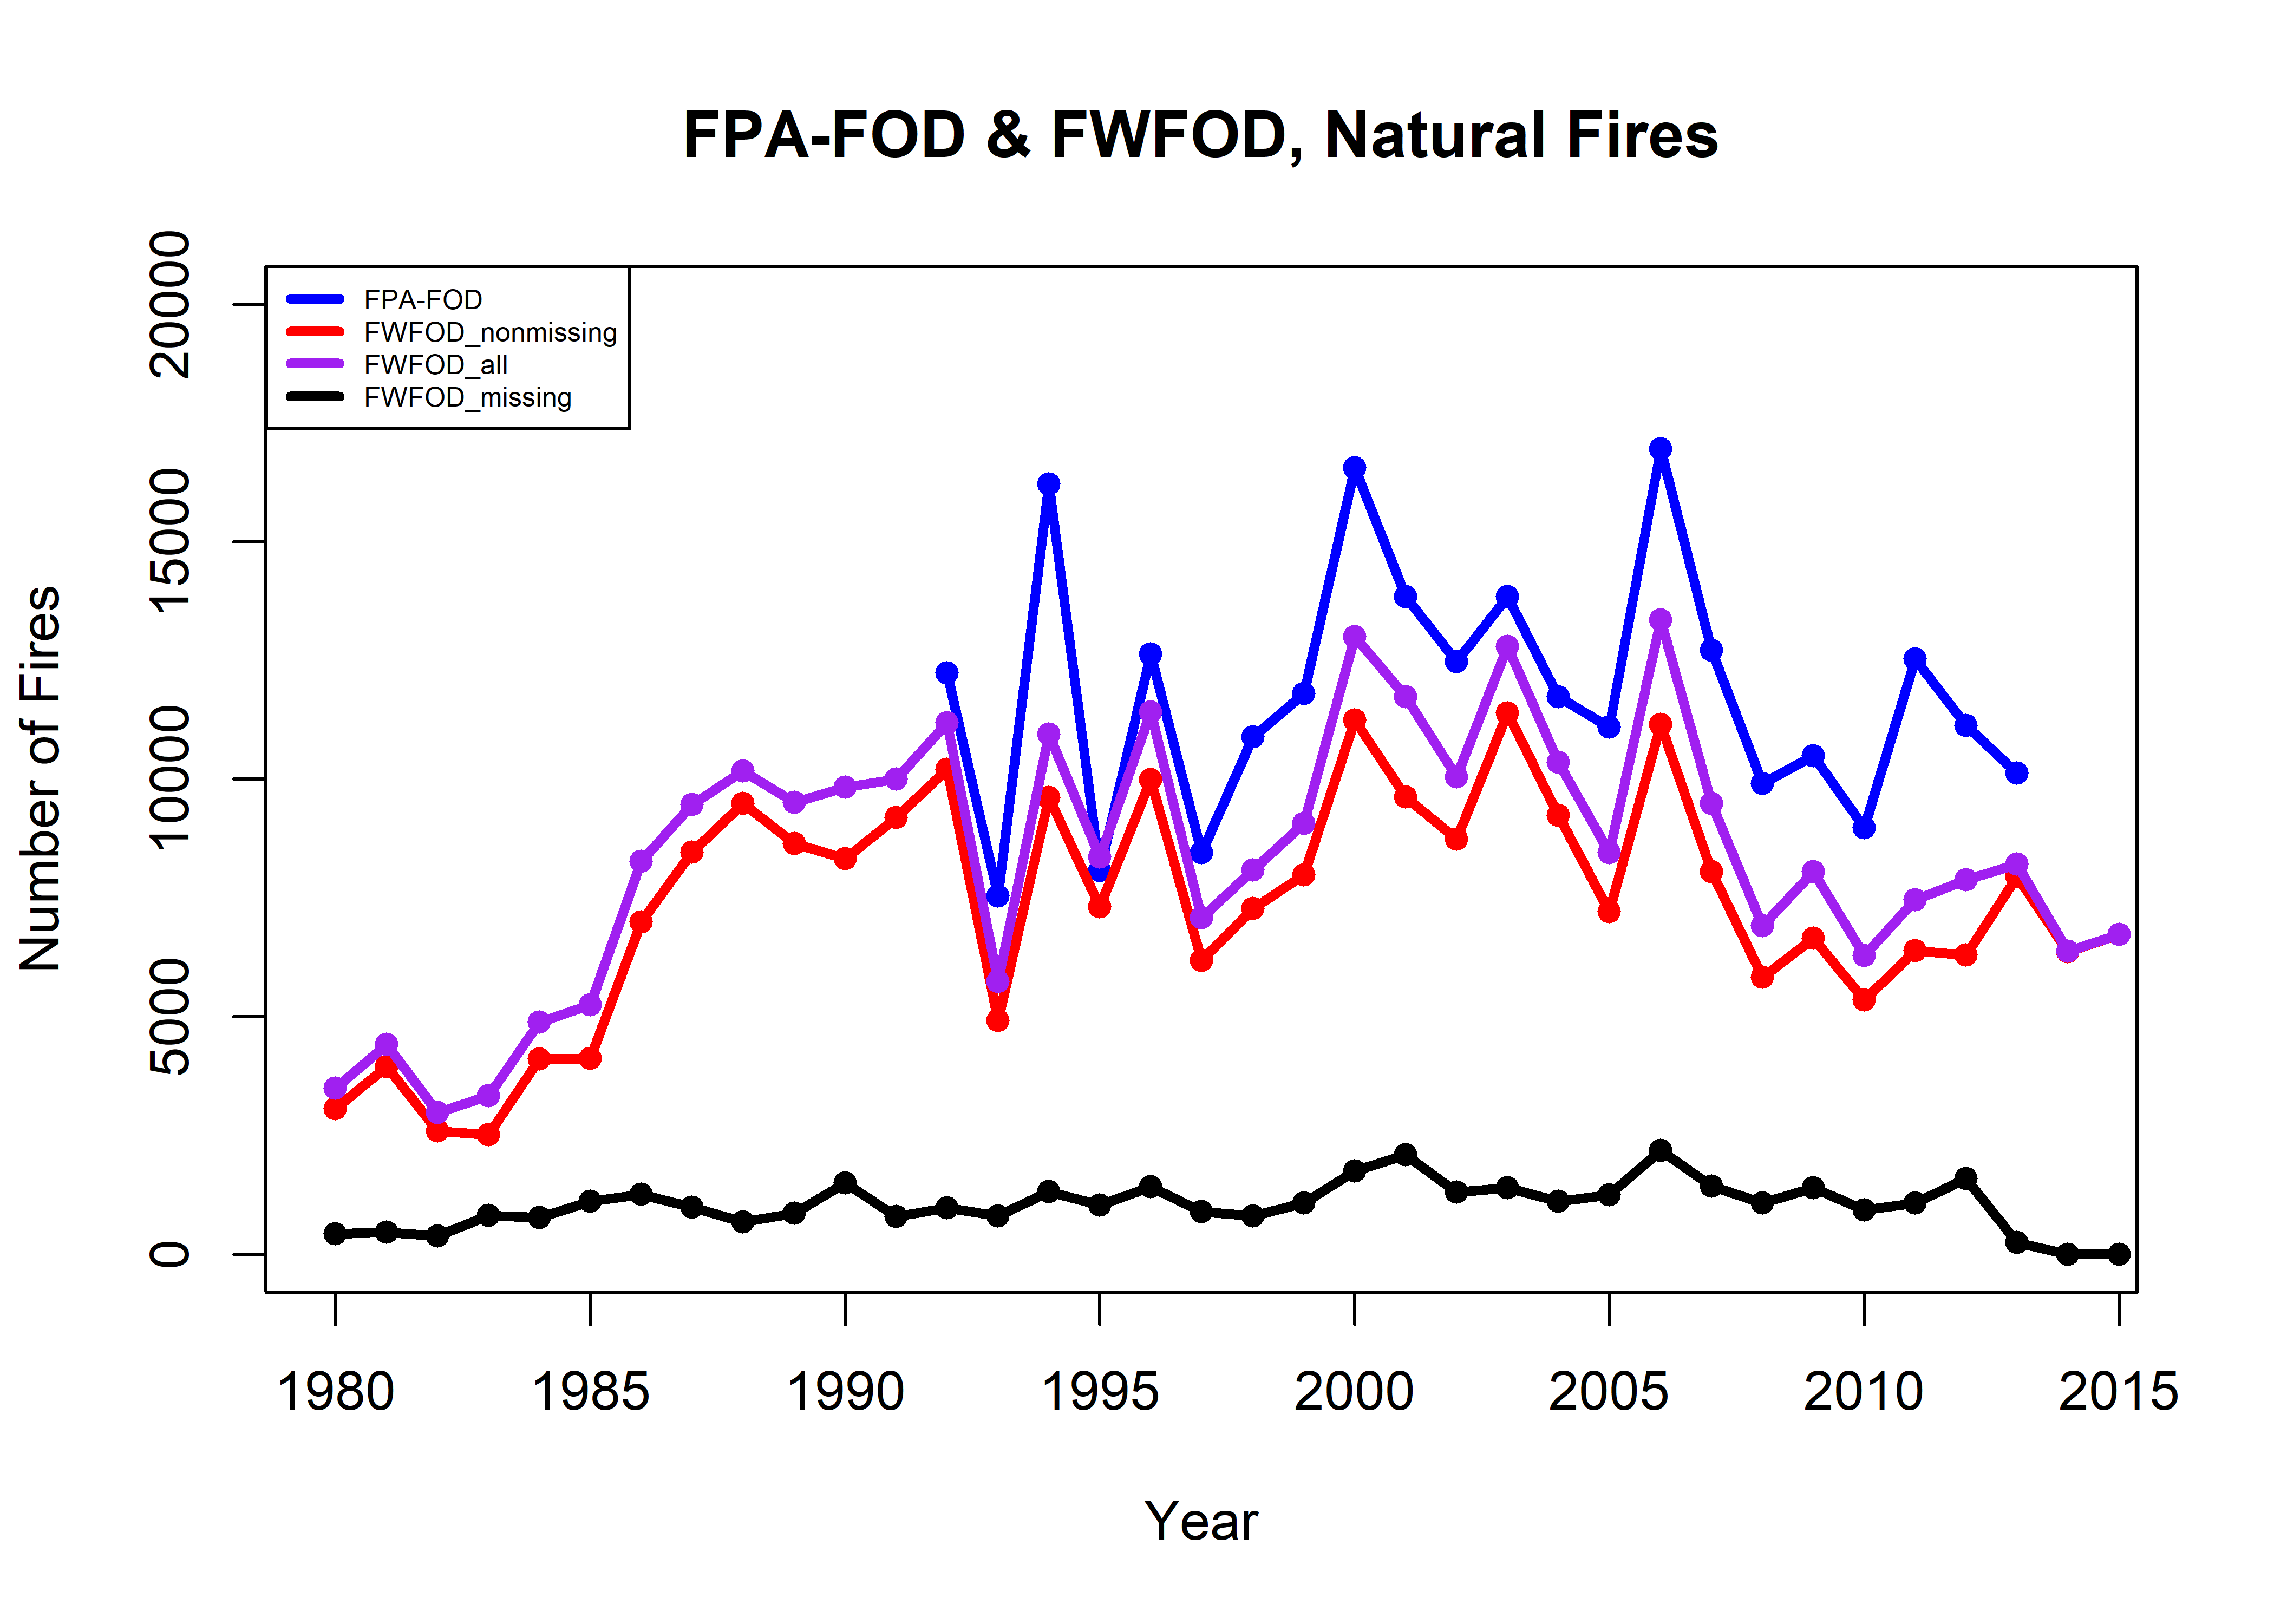
When only natural fires are considered, the two data sets are quite similar over the time interval in which they overlap.
3.2.2 Area burned
Compare the data sets by area burned:
area_by_year_fwfod <- tapply(fwfod_nonmissing$TOTALACRES, fwfod_nonmissing$startyear, sum)
area_by_year_fwfod
## 1980 1981 1982 1983 1984 1985 1986 1987 1988
## 931432.6 1909878.5 431603.7 674330.6 1227326.9 2195640.3 1531809.1 2350410.9 9318866.2
## 1989 1990 1991 1992 1993 1994 1995 1996 1997
## 1508011.6 3979282.5 2822925.1 1497696.4 1877752.4 3270012.7 1195350.0 4859594.3 2661678.2
## 1998 1999 2000 2001 2002 2003 2004 2005 2006
## 1081625.7 4901843.8 8131283.3 2217285.5 9312744.2 4673114.0 9810219.5 12675625.2 7407883.0
## 2007 2008 2009 2010 2011 2012 2013 2014 2015
## 7785438.1 3344755.3 5984267.2 2998561.1 4650865.5 6965254.5 4355250.3 3382318.0 9367625.2area_by_year_fpafod <- tapply(fpafod$FIRE_SIZE, fpafod$startyear, sum)
area_by_year_fpafod## 1992 1993 1994 1995 1996 1997 1998 1999 2000 2001 2002
## 2199155 2190573 4117695 2049724 6006249 3215305 1991693 6068631 7637345 3722202 6801327
## 2003 2004 2005 2006 2007 2008 2009 2010 2011 2012 2013
## 4472769 8231818 9640999 10039315 9263460 5404557 6053240 3486975 9615953 9439844 4489107area_by_year_fwfod_all <- tapply(fwfod_all$TOTALACRES, fwfod_all$YEAR_, sum)
area_by_year_fwfod_all## 1980 1981 1982 1983 1984 1985 1986 1987 1988
## 1021614.1 2226794.9 541845.1 1296013.1 1658072.7 3522536.6 2448316.8 2531699.0 9919140.0
## 1989 1990 1991 1992 1993 1994 1995 1996 1997
## 1789685.6 6480643.6 3358993.2 2022102.3 2294679.2 3995578.2 1590739.5 6017307.4 3557767.5
## 1998 1999 2000 2001 2002 2003 2004 2005 2006
## 1533760.3 7216652.9 9247188.8 3286506.8 11062875.4 5339074.3 11643353.9 13943756.9 8615977.6
## 2007 2008 2009 2010 2011 2012 2013 2014 2015
## 9543089.2 3863763.0 7253877.4 3898328.0 5889831.0 10358378.6 4451557.2 3382379.9 9368096.8area_by_year_fwfod_missing <- tapply(fwfod_missing$TOTALACRES, fwfod_missing$YEAR_, sum)
area_by_year_fwfod_missing## 1980 1981 1982 1983 1984 1985 1986 1987 1988
## 90181.50 316916.40 110241.40 621682.50 430745.80 1326896.30 916507.70 181288.10 600273.80
## 1989 1990 1991 1992 1993 1994 1995 1996 1997
## 281674.00 2501361.10 536068.20 524405.90 416926.90 725565.50 395389.50 1157713.10 896089.30
## 1998 1999 2000 2001 2002 2003 2004 2005 2006
## 452134.60 2314809.10 1115905.50 1069221.30 1750131.20 665960.30 1833134.45 1268131.72 1208094.61
## 2007 2008 2009 2010 2011 2012 2013 2014 2015
## 1757651.05 519007.68 1269610.15 899766.93 1238965.72 3393231.08 96212.49 46.70 471.60Plot the annual area-burned totals in the two data sets:
plot(NULL, xlim=c(1980, 2014), ylim=c(0,15000000), xlab="Year",
  ylab="Total Area", main="FPA-FOD & FWFOD, Total Area of All Fires")
fwfod_year <- as.numeric(unlist(dimnames(area_by_year_fwfod)))
fwfod_area <- as.numeric(area_by_year_fwfod)
points(fwfod_year,fwfod_area, pch=16, type="o", lwd=3, col="red")
fpafod_year <- as.numeric(unlist(dimnames(area_by_year_fpafod)))
fpafod_area <- as.numeric(area_by_year_fpafod)
points(fpafod_year,fpafod_area, pch=16, type="o", lwd=3, col="blue")
fwfod_year_all <- as.numeric(unlist(dimnames(area_by_year_fwfod_all)))
fwfod_area_all <- as.numeric(area_by_year_fwfod_all)
points(fwfod_year_all,fwfod_area_all, pch=16, type="o", lwd=3, col="purple")
fwfod_year_missing <- as.numeric(unlist(dimnames(area_by_year_fwfod_missing)))
fwfod_area_missing <- as.numeric(area_by_year_fwfod_missing)
points(fwfod_year_missing,fwfod_area_missing, pch=16, type="o", lwd=3, col="black")
legend("topleft", legend=c("FPA-FOD","FWFOD_nonmissing","FWFOD_all","FWFOD_missing"), lwd=3, cex=0.5,
  col=c("blue","red","purple","black"))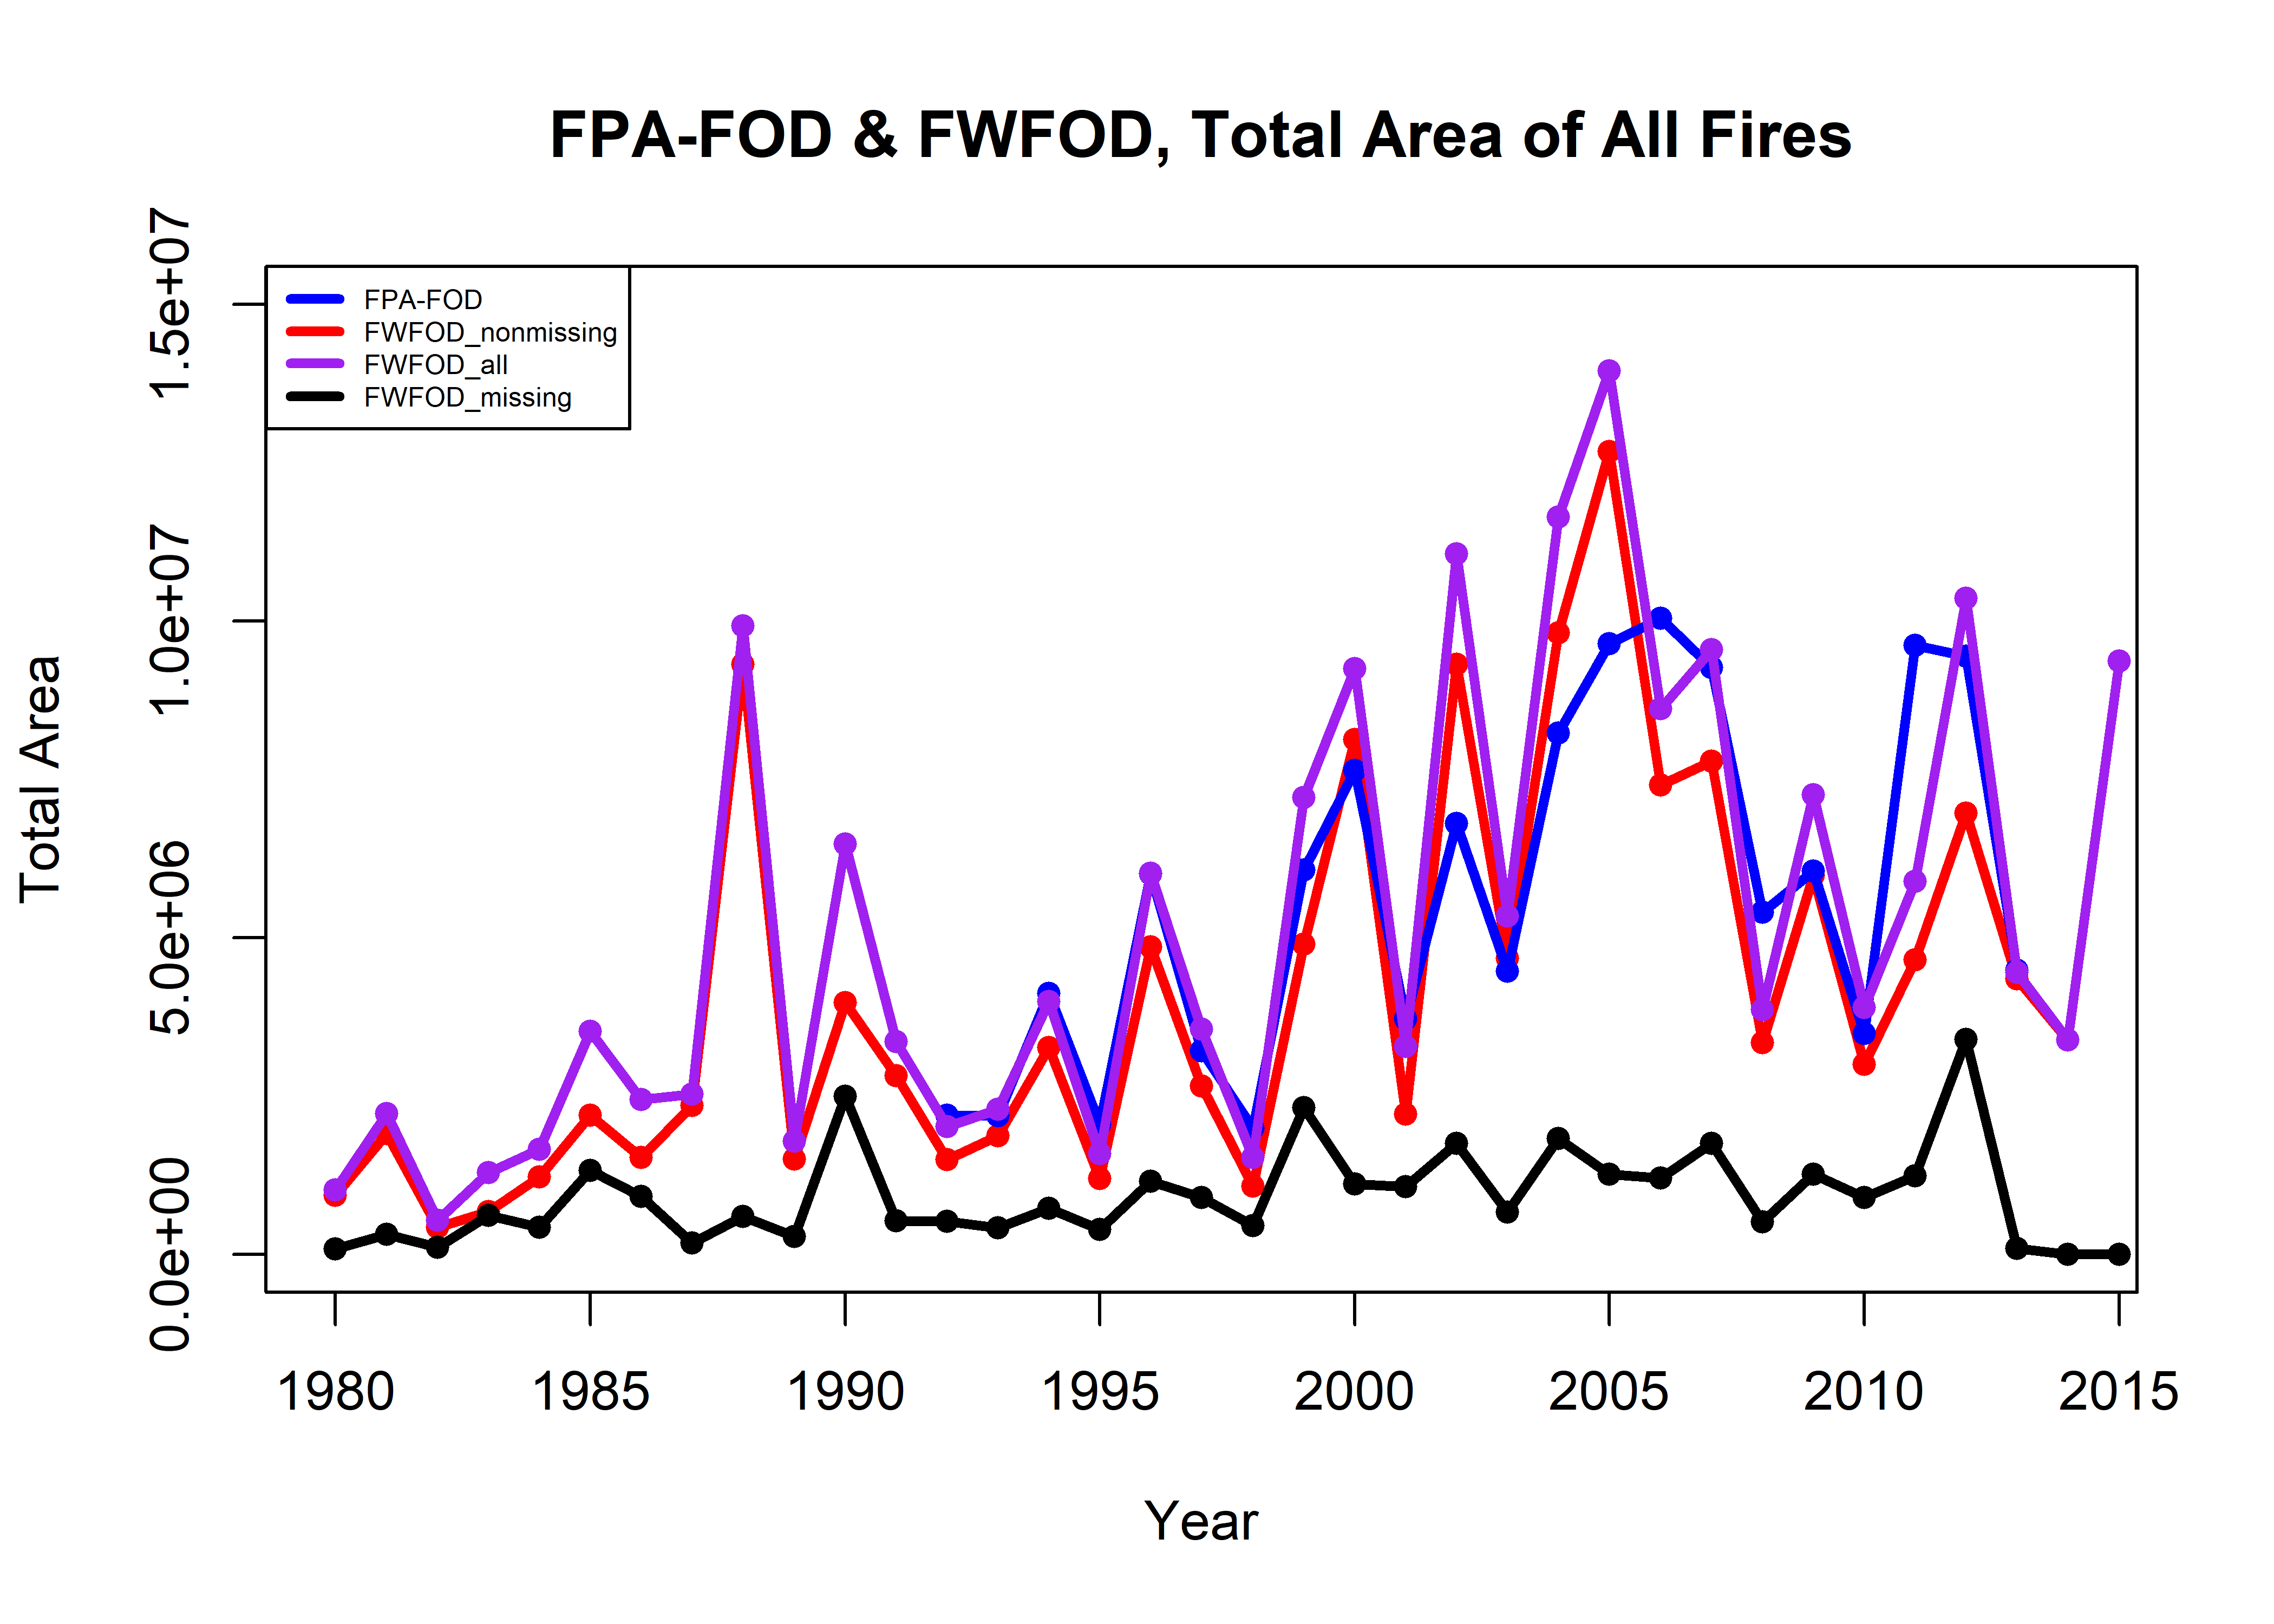
The extent of agreement between the FPA-FOD and FWFOD data sets when only the year of occurrence of the fires is considered, and not the month or day of occurrence, suggests that the FWFOD data set could still be used to represent annual area burned in years prior to the beginning of the FPA-FOD data (i.e. before 1992).
3.3 Fire-start locations
Map the data:
oldpar <- par(mfrow=c(2,2))
plot(NULL, ylim=c(24,50), xlim=c(-125,-65), xlab="Longitude", ylab="Latitude", main="Natural")
map("world", add=TRUE, lwd=2, col="gray"); map("state", add=TRUE, lwd=2, col="gray")
points(fpafod$LATITUDE[fpafod$STAT_CAUSE_CODE == 1]
  ~ fpafod$LONGITUDE[fpafod$STAT_CAUSE_CODE == 1], pch=16, cex=0.3, col="blue")
points(fwfod_nonmissing$DLATITUDE[fwfod_nonmissing$CAUSE=="Natural"]
  ~ fwfod_nonmissing$DLONGITUDE[fwfod_nonmissing$CAUSE=="Natural"], pch=16, cex=0.3, col="red")
legend("bottomleft", legend=c("FPA-FOD","FWFOD"), lwd=3, col=c("blue","red"))

plot(NULL, ylim=c(24,50), xlim=c(-125,-65), xlab="Longitude", ylab="Latitude", main="Human")
map("world", add=TRUE, lwd=2, col="gray"); map("state", add=TRUE, lwd=2, col="gray")
points(fpafod$LATITUDE[fpafod$STAT_CAUSE_CODE > 1]
  ~ fpafod$LONGITUDE[fpafod$STAT_CAUSE_CODE > 1], pch=16, cex=0.3, col="blue")
points(fwfod_nonmissing$DLATITUDE[fwfod_nonmissing$CAUSE=="Human"] ~ fwfod_nonmissing$DLONGITUDE[fwfod_nonmissing$CAUSE=="Human"],
  pch=16, cex=0.3, col="red")
legend("bottomleft", legend=c("FPA-FOD","FWFOD"), lwd=3, col=c("blue","red"))

plot(NULL, ylim=c(50,75), xlim=c(-180,-125), xlab="Longitude", ylab="Latitude", main="Natural")
map("world", add=TRUE, lwd=2, col="gray"); map("state", add=TRUE, lwd=2, col="gray")
points(fpafod$LATITUDE[fpafod$STAT_CAUSE_CODE == 1]
  ~ fpafod$LONGITUDE[fpafod$STAT_CAUSE_CODE == 1], pch=16, cex=0.3, col="blue")
points(fwfod_nonmissing$DLATITUDE[fwfod_nonmissing$CAUSE=="Natural"] ~ fwfod_nonmissing$DLONGITUDE[fwfod_nonmissing$CAUSE=="Natural"],
  pch=16, cex=0.3, col="red")
legend("bottomleft", legend=c("FPA-FOD","FWFOD"), lwd=3, col=c("blue","red"))

plot(NULL, ylim=c(50,75), xlim=c(-180,-125), xlab="Longitude", ylab="Latitude", main="Human")
map("world", add=TRUE, lwd=2, col="gray"); map("state", add=TRUE, lwd=2, col="gray")
points(fpafod$LATITUDE[fpafod$STAT_CAUSE_CODE > 1]
  ~ fpafod$LONGITUDE[fpafod$STAT_CAUSE_CODE > 1], pch=16, cex=0.3, col="blue")
points(fwfod_nonmissing$DLATITUDE[fwfod_nonmissing$CAUSE=="Human"] ~ fwfod_nonmissing$DLONGITUDE[fwfod_nonmissing$CAUSE=="Human"],
  pch=16, cex=0.3, col="red")
legend("bottomleft", legend=c("FPA-FOD","FWFOD"), lwd=3, col=c("blue","red"))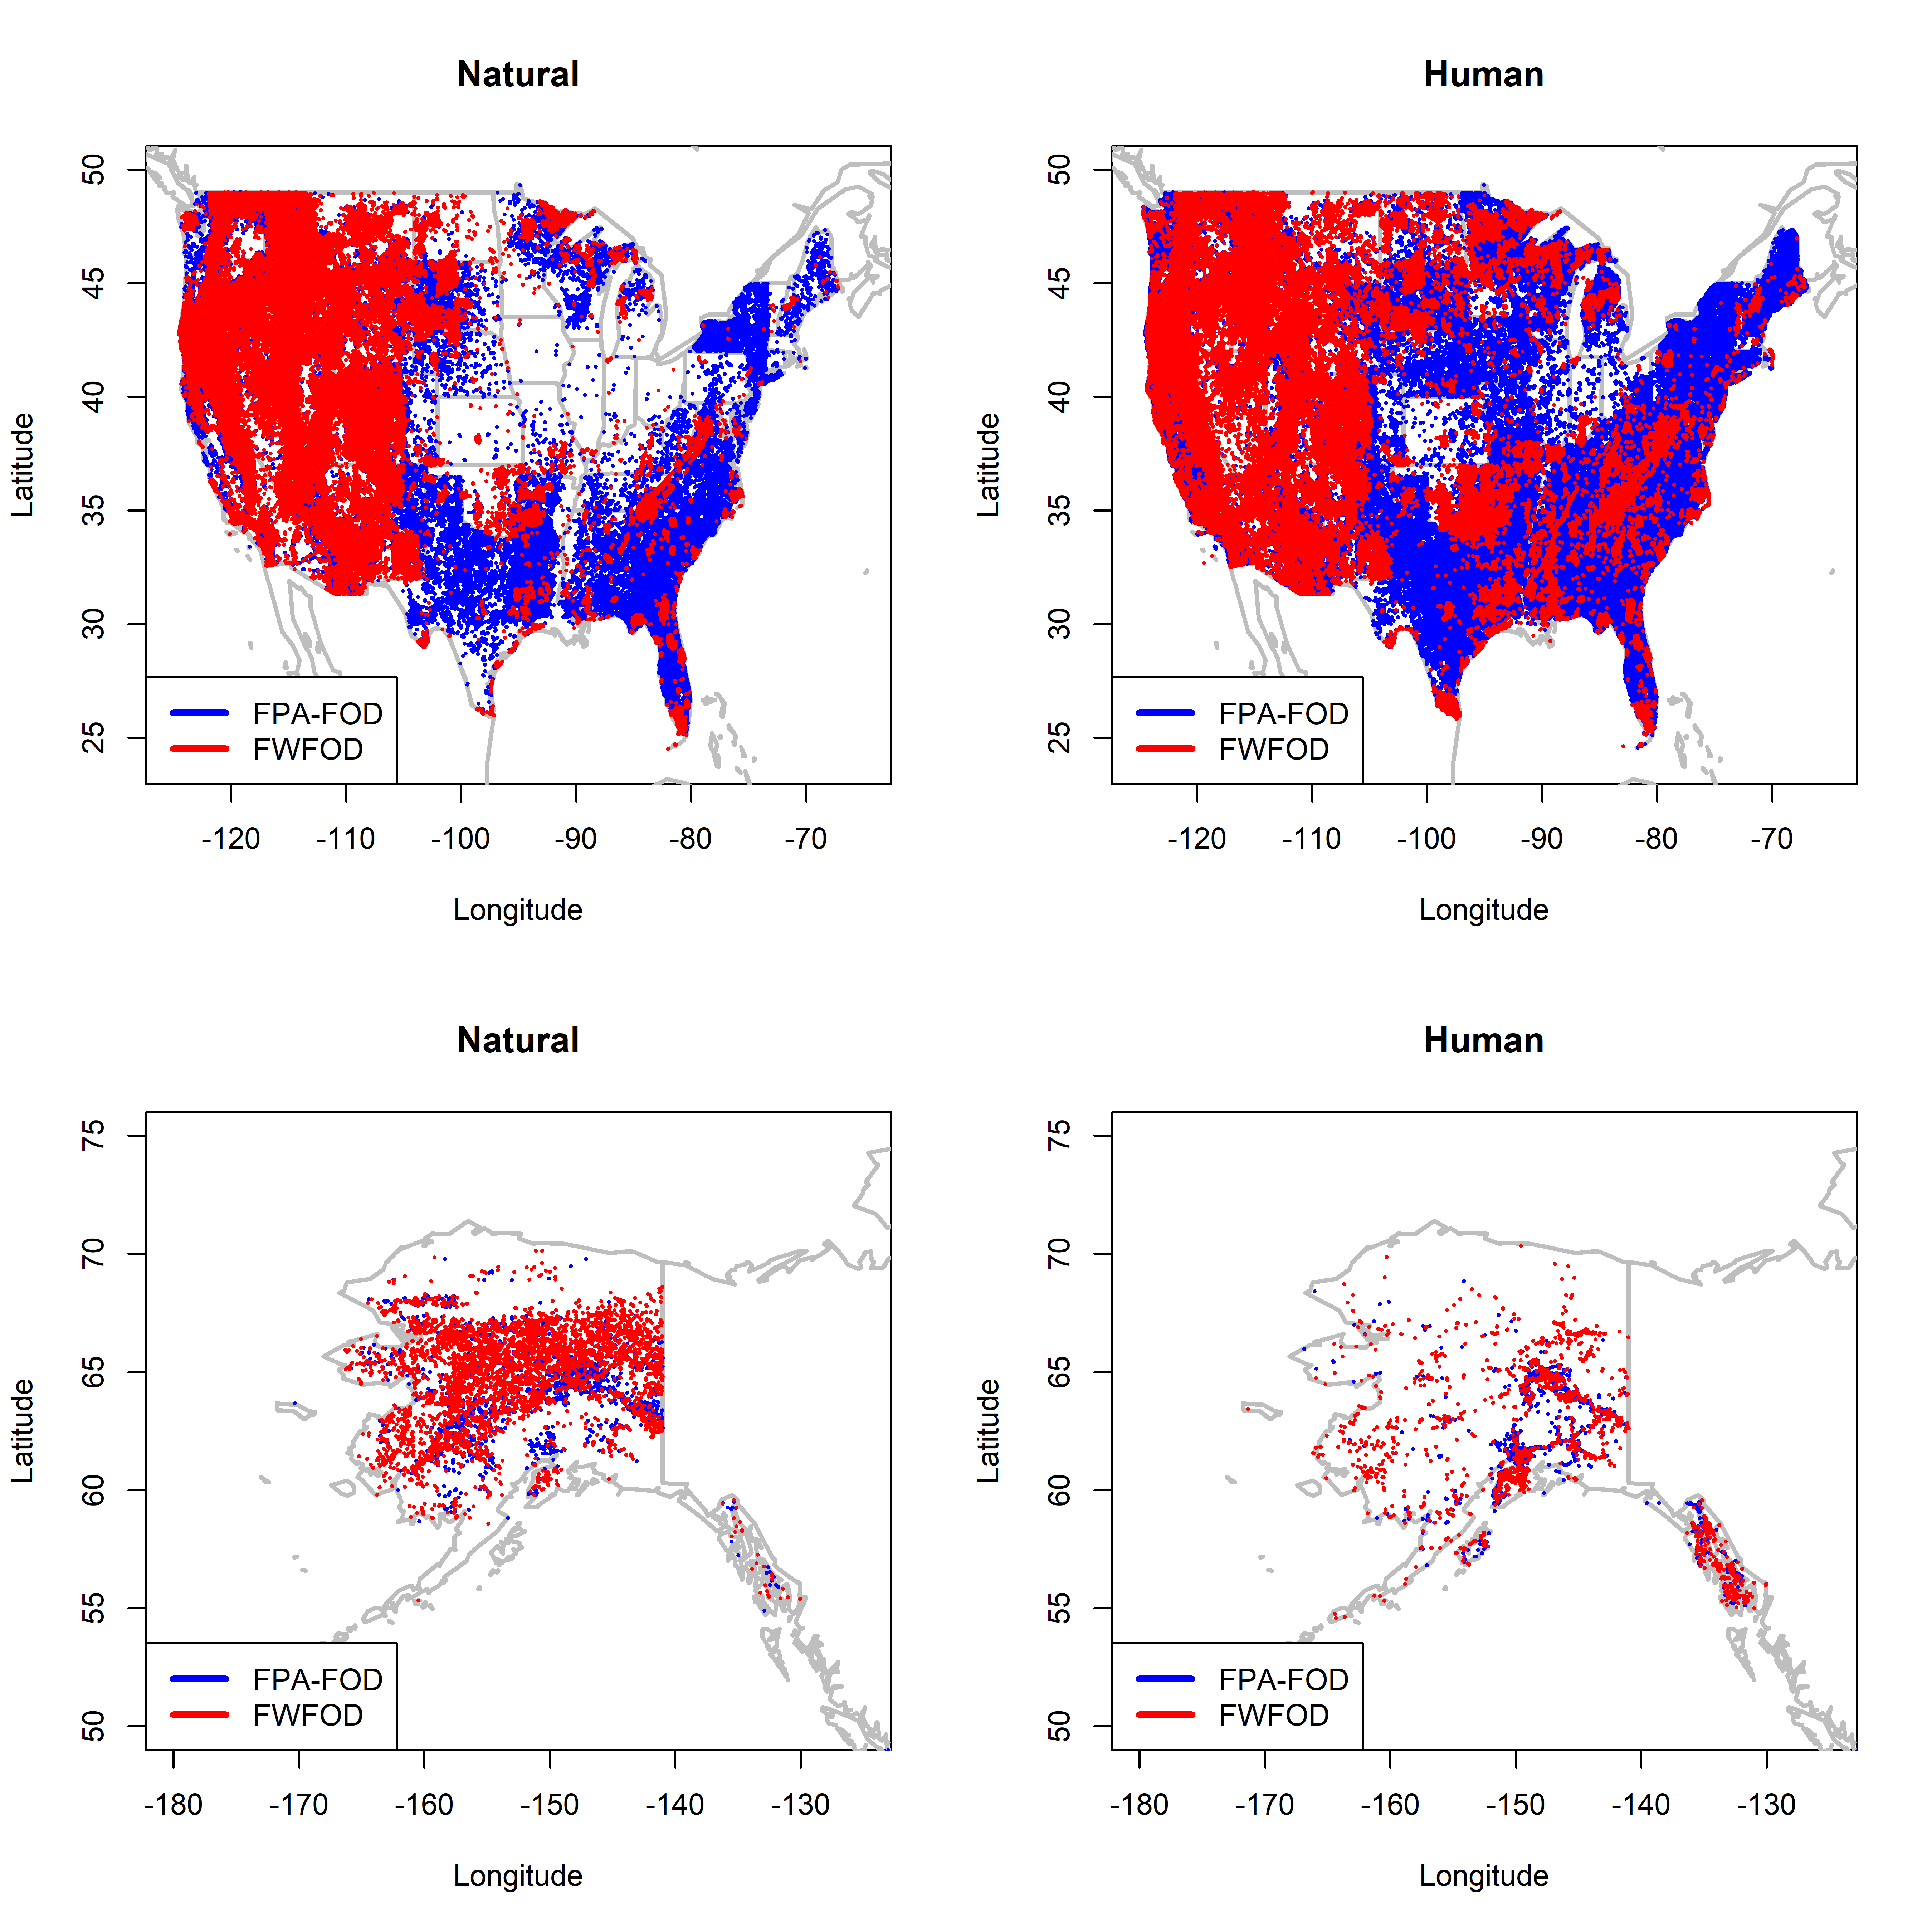
par(oldpar)3.3.1 Map comparisons
By plotting the FWFOD data (in blue) over the FPA-FOD data (in red) in the above maps, the location of the additional fires in the FPA-FOD data set becomes apparent. The additional fires in the FPA-FOD data set relative to FWFOD are found mainly in the lower-48 states east of 105 W.
Next, plot the fire-start data for natural fires for days 1-9 from the two data sets, and overlay these with the locations of points in the FWFOD data set with missing STARTDATED values in black (i.e. values in fwfod_missing). (Recall that these points can not be plotted by day, only by year, so all points are plotted.)
oldpar <- par(mfrow=c(2,2))
plot(NULL, ylim=c(24,50), xlim=c(-125,-65), xlab="Longitude", ylab="Latitude", main="Natural, startday 1-9")
map("world", add=TRUE, lwd=2, col="gray"); map("state", add=TRUE, lwd=2, col="gray")
points(fpafod$LATITUDE[fpafod$STAT_CAUSE_CODE == 1 & fpafod$startday2 == "1-9"]
  ~ fpafod$LONGITUDE[fpafod$STAT_CAUSE_CODE == 1 & fpafod$startday2 == "1-9"], pch=16, cex=0.3, col="blue")
points(fwfod_nonmissing$DLATITUDE[fwfod_nonmissing$CAUSE=="Natural" & fwfod_nonmissing$startday2 == "1-9"]
  ~ fwfod_nonmissing$DLONGITUDE[fwfod_nonmissing$CAUSE=="Natural" & fwfod_nonmissing$startday2 == "1-9"], pch=16, cex=0.3, col="red")
legend("bottomleft", legend=c("FPA-FOD","FWFOD"), lwd=3, cex=0.5, col=c("blue","red"))

plot(NULL, ylim=c(24,50), xlim=c(-125,-65), xlab="Longitude", ylab="Latitude", main="Natural, startday 1-9")
map("world", add=TRUE, lwd=2, col="gray"); map("state", add=TRUE, lwd=2, col="gray")
points(fpafod$LATITUDE[fpafod$STAT_CAUSE_CODE == 1 & fpafod$startday2 == "1-9"]
  ~ fpafod$LONGITUDE[fpafod$STAT_CAUSE_CODE == 1 & fpafod$startday2 == "1-9"], pch=16, cex=0.3, col="blue")
points(fwfod_nonmissing$DLATITUDE[fwfod_nonmissing$CAUSE=="Natural" & fwfod_nonmissing$startday2 == "1-9"]
  ~ fwfod_nonmissing$DLONGITUDE[fwfod_nonmissing$CAUSE=="Natural" & fwfod_nonmissing$startday2 == "1-9"], pch=16, cex=0.3, col="red")
points(fwfod_missing$DLATITUDE[fwfod_nonmissing$CAUSE=="Natural"]
  ~ fwfod_missing$DLONGITUDE[fwfod_nonmissing$CAUSE=="Natural"], pch=16, cex=0.3, col="black")
legend("bottomleft", legend=c("FPA-FOD","FWFOD", "FWFOD_missing"), lwd=3, cex=0.5, col=c("blue","red","black"))

plot(NULL, ylim=c(50,75), xlim=c(-180,-125), xlab="Longitude", ylab="Latitude", main="Natural, startday 1-9")
map("world", add=TRUE, lwd=2, col="gray"); map("state", add=TRUE, lwd=2, col="gray")
points(fpafod$LATITUDE[fpafod$STAT_CAUSE_CODE == 1 & fpafod$startday2 == "1-9"]
  ~ fpafod$LONGITUDE[fpafod$STAT_CAUSE_CODE == 1 & fpafod$startday2 == "1-9"], pch=16, cex=0.3, col="blue")
points(fwfod_nonmissing$DLATITUDE[fwfod_nonmissing$CAUSE=="Natural" & fwfod_nonmissing$startday2 == "1-9"]
  ~ fwfod_nonmissing$DLONGITUDE[fwfod_nonmissing$CAUSE=="Natural" & fwfod_nonmissing$startday2 == "1-9"], pch=16, cex=0.3, col="red")
legend("bottomleft", legend=c("FPA-FOD","FWFOD"), lwd=3, cex=0.5, col=c("blue","red"))

plot(NULL, ylim=c(50,75), xlim=c(-180,-125), xlab="Longitude", ylab="Latitude", main="Natural, startday 1-9")
map("world", add=TRUE, lwd=2, col="gray"); map("state", add=TRUE, lwd=2, col="gray")
points(fpafod$LATITUDE[fpafod$STAT_CAUSE_CODE == 1 & fpafod$startday2 == "1-9"]
  ~ fpafod$LONGITUDE[fpafod$STAT_CAUSE_CODE == 1 & fpafod$startday2 == "1-9"], pch=16, cex=0.3, col="blue")
points(fwfod_nonmissing$DLATITUDE[fwfod_nonmissing$CAUSE=="Natural" & fwfod_nonmissing$startday2 == "1-9"]
  ~ fwfod_nonmissing$DLONGITUDE[fwfod_nonmissing$CAUSE=="Natural" & fwfod_nonmissing$startday2 == "1-9"], pch=16, cex=0.3, col="red")
points(fwfod_missing$DLATITUDE[fwfod_nonmissing$CAUSE=="Natural"]
  ~ fwfod_missing$DLONGITUDE[fwfod_nonmissing$CAUSE=="Natural"], pch=16, cex=0.3, col="black")
legend("bottomleft", legend=c("FPA-FOD","FWFOD", "FWFOD_missing"), lwd=3, cex=0.5, col=c("blue","red","black"))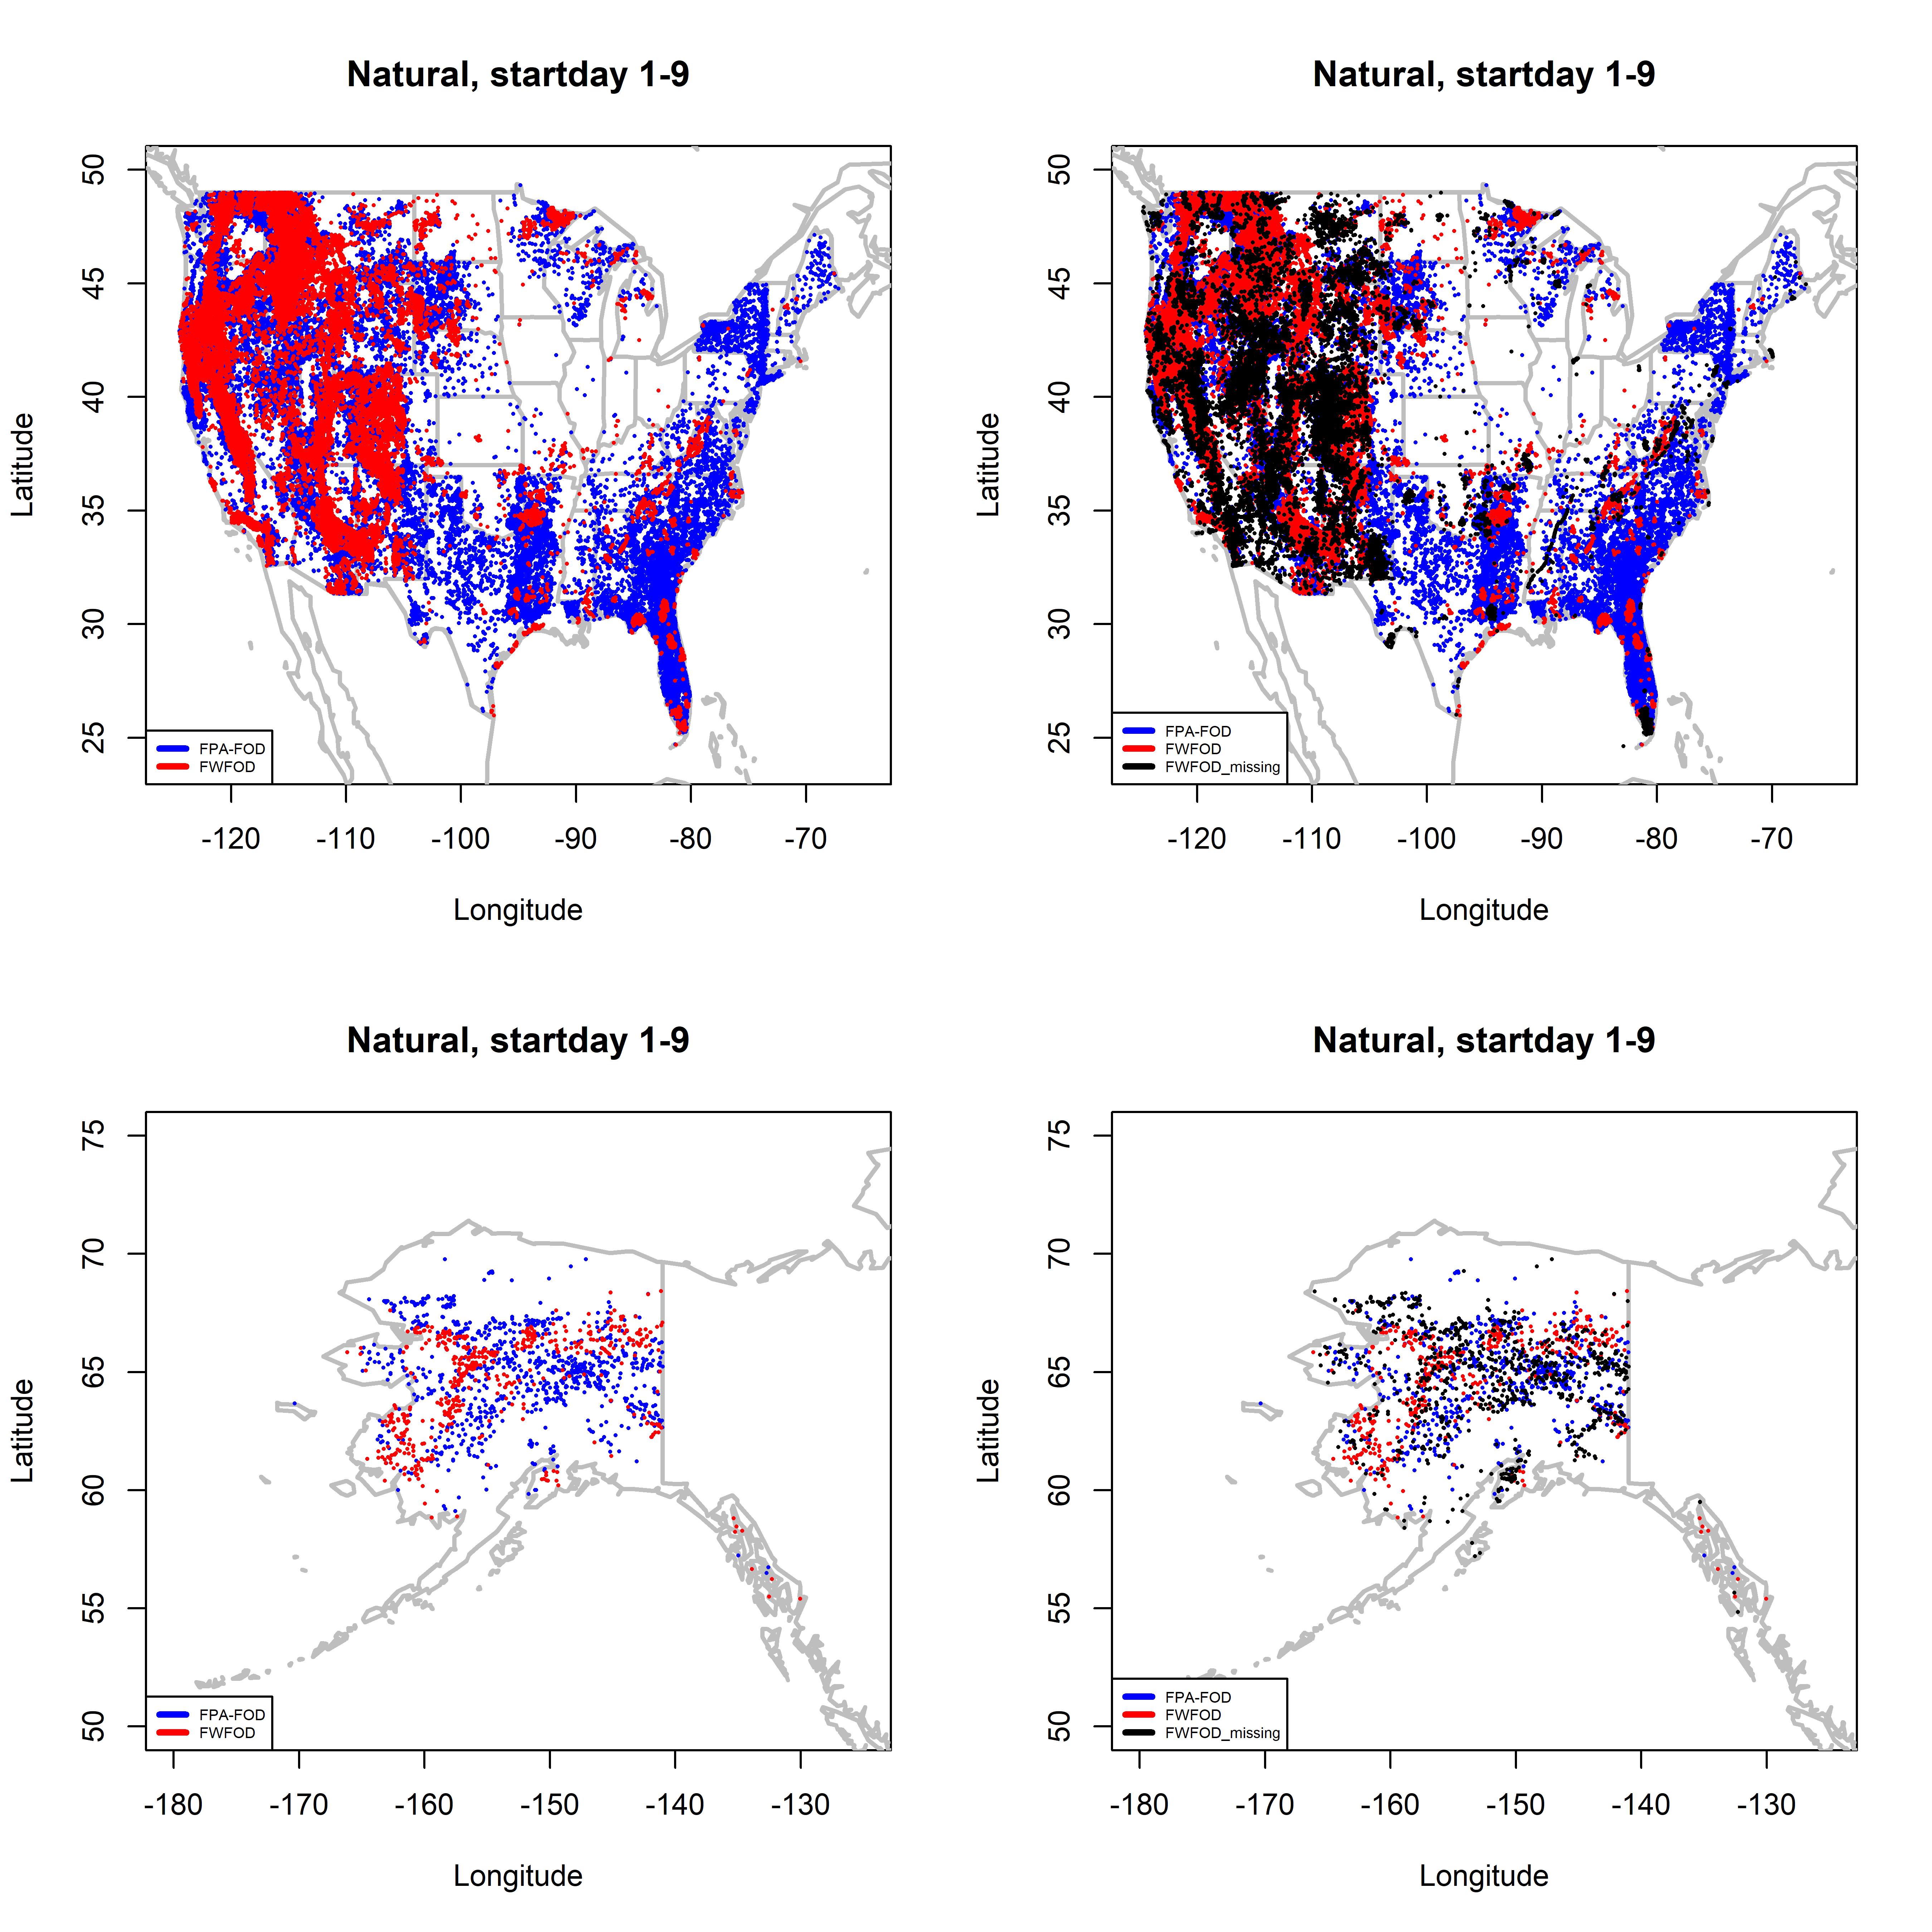
par(oldpar)In the above maps, locations were the FPA-FOD data set includes fires with startdays 1-9, but the FWFOD does not, show through in blue in left-hand maps. In the right-haNd maps, particularly for the western U.S., the black missing STARTDATED points fill in many of the areas where the FPA-FOD data show through. This suggests that the “missing” fires on days 1-9 in the FWFOD data may be found among the points with missing STARTDATED values.
4 FWFOD start day by agency
Plot the startday values in the fwfod data set as a function of agency.
oldpar <- par(mfrow=c(2,3))
hist(fwfod_nonmissing$startday[fwfod_nonmissing$ORGANIZATI=="BIA"], breaks=seq(-0.5,31.5,by=1), freq=-TRUE, main="BIA")
hist(fwfod_nonmissing$startday[fwfod_nonmissing$ORGANIZATI=="BLM"], breaks=seq(-0.5,31.5,by=1), freq=-TRUE, main="BLM")
hist(fwfod_nonmissing$startday[fwfod_nonmissing$ORGANIZATI=="BOR"], breaks=seq(-0.5,31.5,by=1), freq=-TRUE, main="BOR")
hist(fwfod_nonmissing$startday[fwfod_nonmissing$ORGANIZATI=="FS"], breaks=seq(-0.5,31.5,by=1), freq=-TRUE, main="FS")
hist(fwfod_nonmissing$startday[fwfod_nonmissing$ORGANIZATI=="FWS"], breaks=seq(-0.5,31.5,by=1), freq=-TRUE, main="FWS")
hist(fwfod_nonmissing$startday[fwfod_nonmissing$ORGANIZATI=="NPS"], breaks=seq(-0.5,31.5,by=1), freq=-TRUE, main="NPS")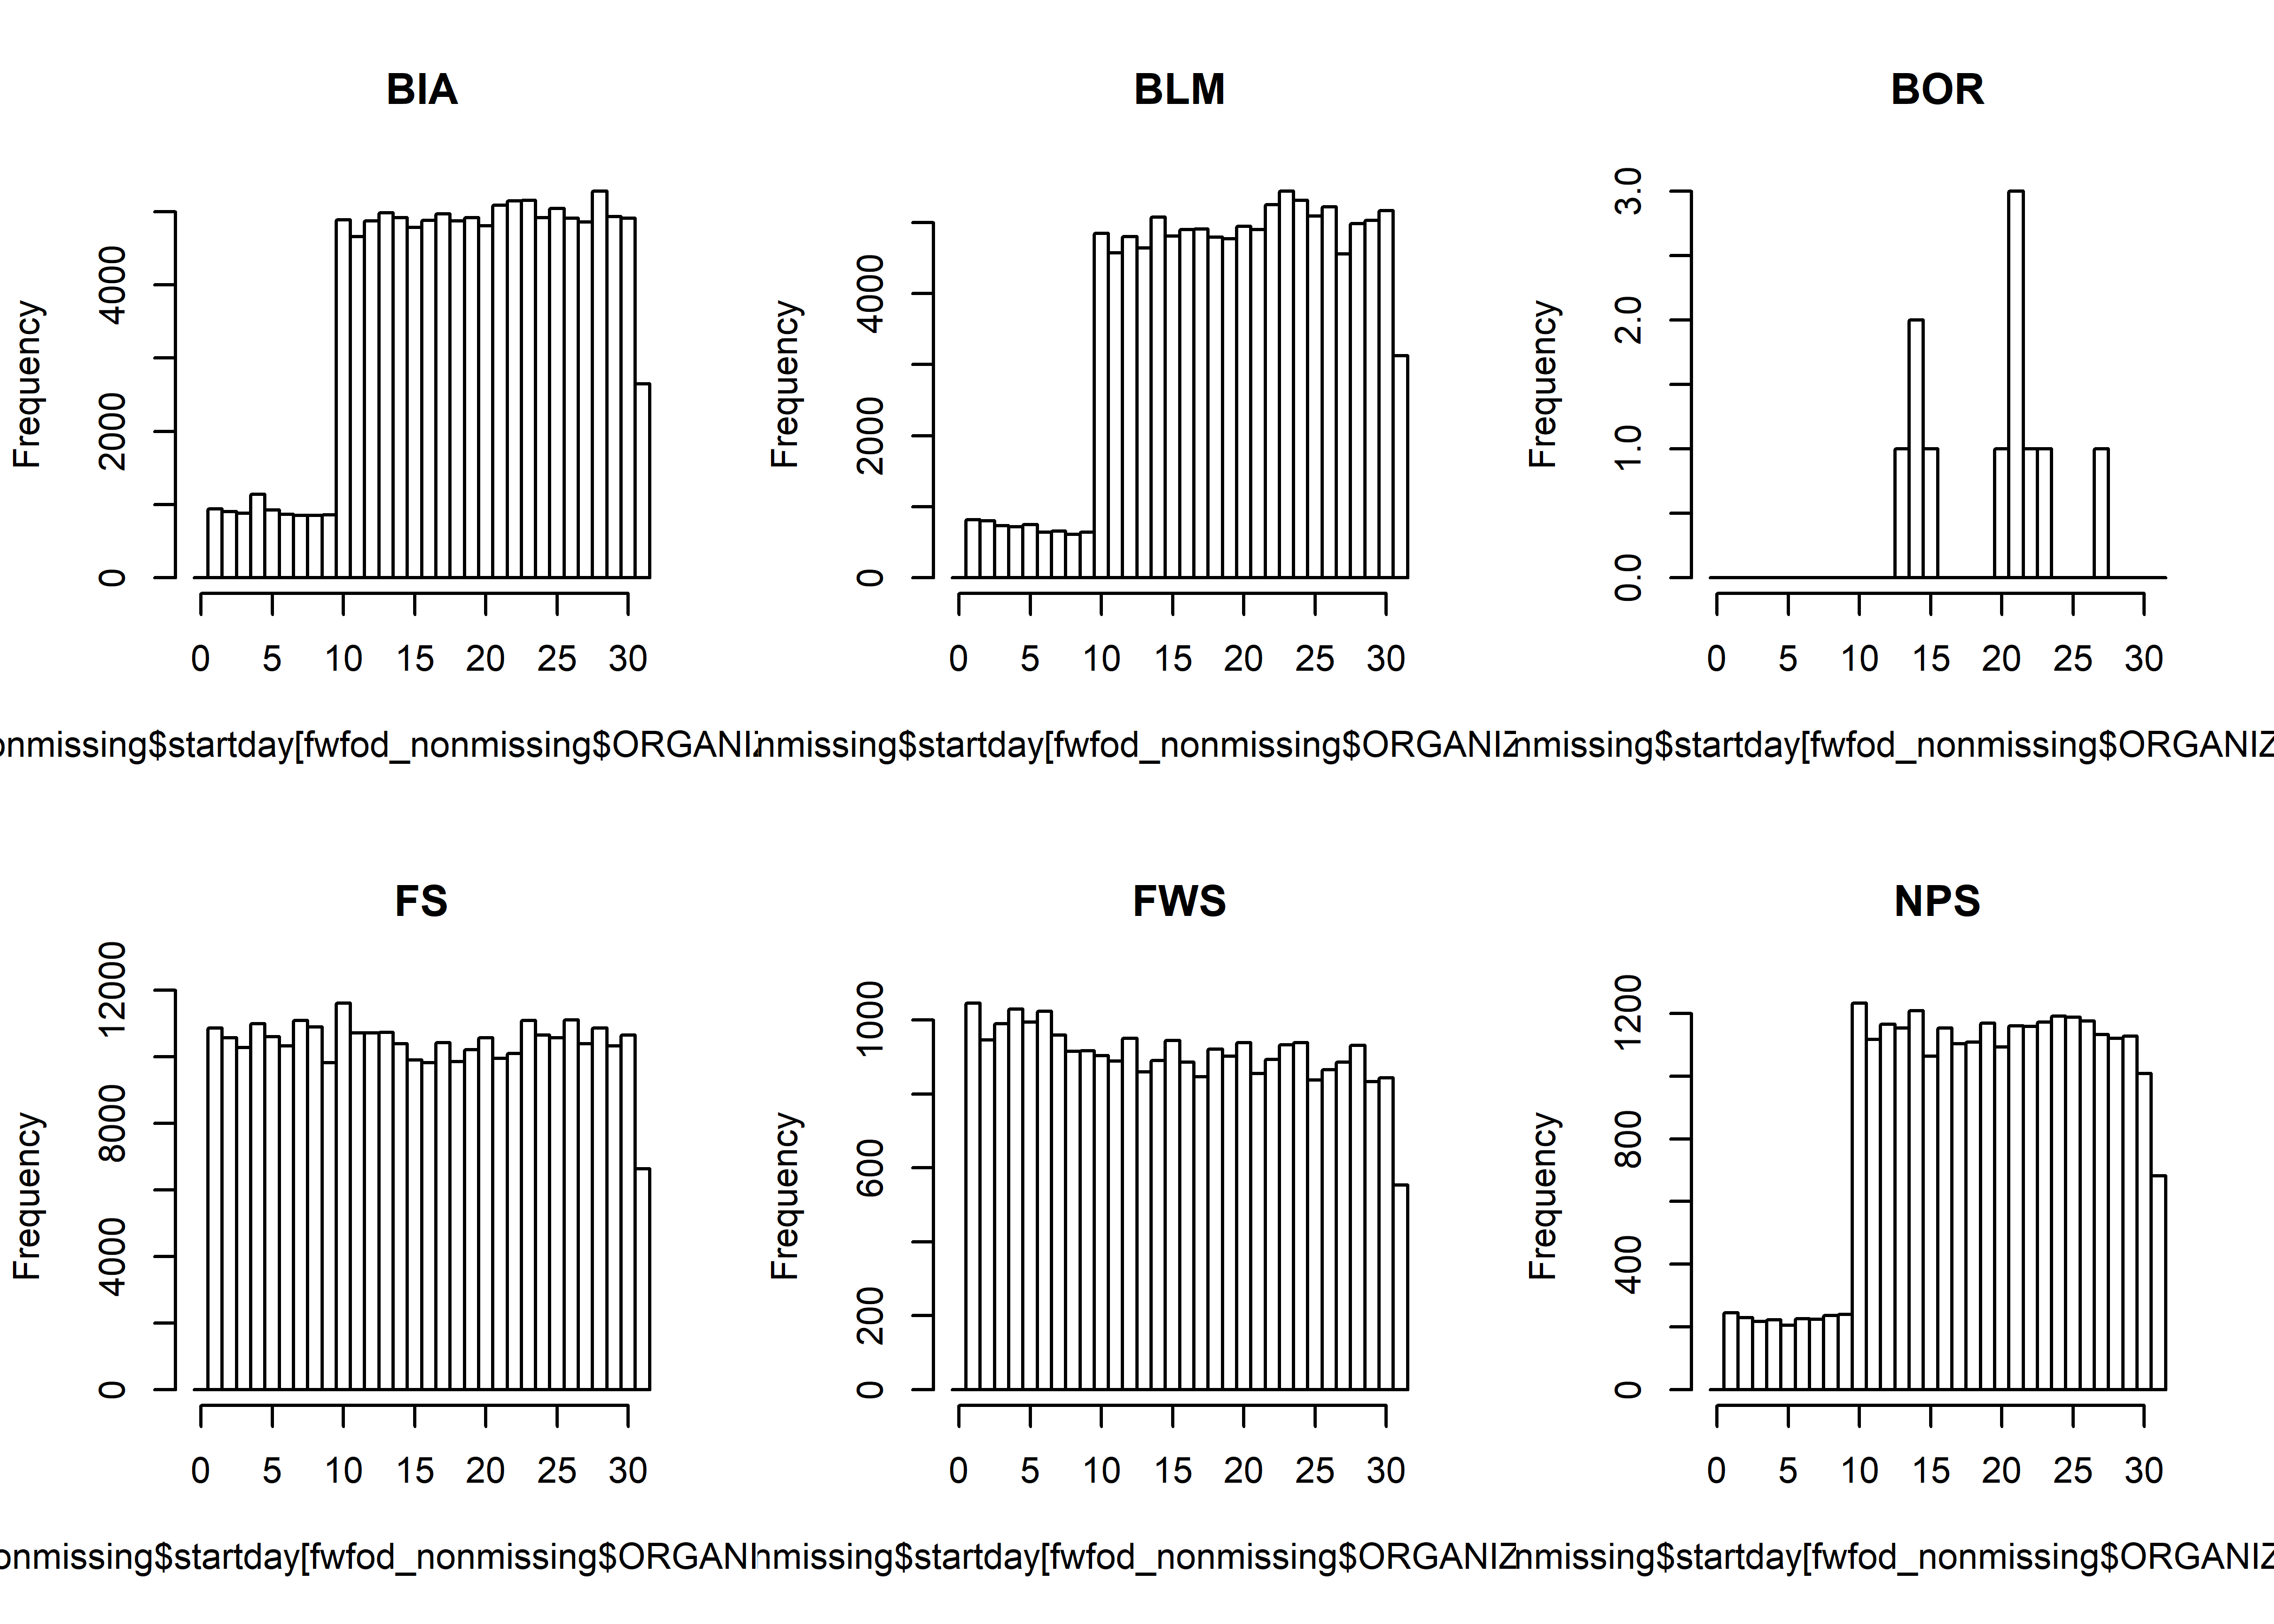
par(oldpar)These plots clearly show that the Forest Service (FS) and Fish and Wildlife Service (FWS) records are complete, and that the missing fires must lie in the BIA, BLM and NPS data sets (and likely also in the BOR data).
5 Conclusions
There are several observations that can be drawn from the analysis:
- the FWFOD data has a severe underrepresentation of fires with start days in the first nine days of each month, for the first nine months of the year;
- the “missing” or underrepresented fires are probably those with missing
STARTDATEDvalues, and are likely concentrated in theBIA,BLMandNPSdata sets; - It seems likely that there was a month/day-in-month transposition at some point in those data sets;
- although the missing start-day values preclude using the FWFOD data set to examine daily, monthly “within year” values the total annual number and area of fires in the FWFOD might be used to extend the FPA-FOD over the years 1986-1991.