NIFC Fire History Data 1980-2003 (NIFC)
1 NIFC Fire History Data (1980-2003)
“NIFC Fire History Data 1980-2003” – ftp://ftp.nifc.gov/pub/FireHistoryData/
1.1 Overview
This is the not-too-well documented “NIFC” database availble via ftp from the URL above.
Read the data, and list the first few lines. The data are read directly from the file firehistory_1980_2003.dbf (2004-09-21, accessed 2014-07-06).
library(foreign)
filename <- "e:/Projects/fire/DailyFireStarts/data/NIFC/firehistory_1980_2003.dbf"
nifc <- read.dbf(filename)
Summarize
head(nifc)## AGENCY_COD UNIT_ID FIRE_TYPE FIRE_NUMBE FIRE_NAME STATE DATE_DISCO DATE_CONTR GENERAL_CA SPECIFIC_C
## 1 FWS 74500 11 7177 <NA> AK 20010527 20010531 4 30
## 2 FWS 74500 12 7057 704001 AK 19870423 19870423 5 30
## 3 FWS 74540 21 7046 704017 AK 19870830 19870830 2 30
## 4 FWS 74540 12 7192 <NA> AK 20010621 20010000 4 30
## 5 FWS 74540 51 7169 804015 AK 19880630 19880000 0 30
## 6 FWS 74540 12 7295 832095 AK 19880724 19880728 0 30
## YEAR_DISCO LATITUDE LONGITUDE ACRES_CONT SIZE_CLASS GEOGRAPHIC
## 1 0 51.80000 -178.8167 800 E Alaska
## 2 0 51.93333 -176.6667 80 C Alaska
## 3 0 61.56667 -166.1667 2 B Alaska
## 4 0 61.83333 -165.5333 1 B Alaska
## 5 0 61.83333 -164.1667 NA <NA> Alaska
## 6 0 62.45000 -163.7833 20 C Alaskasummary(nifc)## AGENCY_COD UNIT_ID FIRE_TYPE FIRE_NUMBE FIRE_NAME STATE
## BIA : 91615 304 : 8421 11 :131428 1 : 1932 FA 1 : 594 CA : 65941
## BLM : 91039 H50H58 : 6958 13 : 15356 2 : 1744 FA 2 : 549 AZ : 56218
## FWS : 21217 H50H52 : 6385 16 : 15267 3 : 1603 FA 3 : 508 OR : 40158
## NPS : 27764 AKAFS : 6042 41 : 13012 4 : 1494 FA 4 : 462 ID : 29556
## USFS:198539 312 : 5388 51 : 10917 5 : 1409 FA 5 : 442 MT : 29031
## F50F52 : 5282 (Other): 45655 (Other):223453 (Other):305934 NM : 22716
## (Other):391698 NA's :198539 NA's :198539 NA's :121685 (Other):186554
## DATE_DISCO DATE_CONTR GENERAL_CA SPECIFIC_C YEAR_DISCO LATITUDE
## 19890726: 1079 19940000: 1626 1 :186613 30 :165887 Min. : 0 Min. :19.27
## 19860810: 866 19920000: 1487 9 : 45411 1 : 76624 1st Qu.:1988 1st Qu.:35.23
## 19870830: 855 19960000: 1466 5 : 43835 0 : 74888 Median :1994 Median :39.87
## 19890808: 700 19930000: 1412 0 : 37214 19 : 15116 Mean :1895 Mean :40.18
## 19940723: 666 19950000: 1349 4 : 35550 27 : 11536 3rd Qu.:1999 3rd Qu.:44.45
## (Other) :425917 (Other) :422057 2 : 32564 8 : 11349 Max. :2003 Max. :69.85
## NA's : 91 NA's : 777 (Other): 48987 (Other): 74774 NA's :91
## LONGITUDE ACRES_CONT SIZE_CLASS GEOGRAPHIC
## Min. :-178.82 Min. : 0.0 A :222664 Southwest : 79916
## 1st Qu.:-118.38 1st Qu.: 0.1 B :136174 Northwest : 54394
## Median :-111.80 Median : 0.2 C : 42737 Northern Rockies : 49492
## Mean :-110.05 Mean : 187.0 D : 12175 Rocky Mountain : 43729
## 3rd Qu.:-105.72 3rd Qu.: 2.5 E : 8603 Southern : 43412
## Max. : -67.06 Max. :606945.0 (Other): 7658 Eastern Great Basin: 42197
## NA's :163 NA's : 163 (Other) :117034length(nifc[,1])## [1] 430174str(nifc, strict.width="cut")## 'data.frame': 430174 obs. of 16 variables:
## $ AGENCY_COD: Factor w/ 5 levels "BIA","BLM","FWS",..: 3 3 3 3 3 3 3 3 3 3 ...
## $ UNIT_ID : Factor w/ 881 levels "1002","1003",..: 446 446 450 450 450 450 450 450 450 450 ...
## $ FIRE_TYPE : Factor w/ 27 levels "0","1","11","12",..: 3 4 10 4 22 4 4 4 10 4 ...
## $ FIRE_NUMBE: Factor w/ 31568 levels "0","1","10","100",..: 6671 6538 6526 6688 6662 6802 7056 6525 65..
## $ FIRE_NAME : Factor w/ 151091 levels "''67''","''67'' 2",..: NA 7020 7032 NA 7546 7728 13185 73706 70..
## $ STATE : Factor w/ 51 levels "AK","AL","AR",..: 1 1 1 1 1 1 1 1 1 1 ...
## $ DATE_DISCO: Factor w/ 8553 levels "19140716","19150424",..: 7604 2463 2592 7629 2895 2919 5417 2591 ..
## $ DATE_CONTR: Factor w/ 8577 levels "02031231","19800000",..: 7595 2445 2574 7444 2698 2907 5402 2574 ..
## $ GENERAL_CA: Factor w/ 10 levels "0","1","2","3",..: 5 6 3 5 1 1 3 3 2 2 ...
## $ SPECIFIC_C: Factor w/ 33 levels "0","1","10","11",..: 25 25 25 25 25 25 25 25 25 25 ...
## $ YEAR_DISCO: int 0 0 0 0 0 0 0 0 0 0 ...
## $ LATITUDE : num 51.8 51.9 61.6 61.8 61.8 ...
## $ LONGITUDE : num -179 -177 -166 -166 -164 ...
## $ ACRES_CONT: num 800 80 2 1 NA 20 30 10 5 0.5 ...
## $ SIZE_CLASS: Factor w/ 7 levels "A","B","C","D",..: 5 3 2 2 NA 3 3 3 2 2 ...
## $ GEOGRAPHIC: Factor w/ 11 levels "Alaska","Eastern",..: 1 1 1 1 1 1 1 1 1 1 ...
## - attr(*, "data_types")= chr "C" "C" "C" "C" ...Remove pre-1980 data (identified in a preliminary analysis).
length(nifc[,1])## [1] 430174nifc <- nifc[nifc$YEAR > 1980,]
length(nifc[,1])## [1] 405124Transform date information
library(lubridate)
nifc$STARTDATED <- (paste(substr(as.character(nifc$DATE_DISCO), 1,4),
  substr(as.character(nifc$DATE_DISCO), 5,6), substr(as.character(nifc$DATE_DISCO), 7,8), sep="-"))
nifc$STARTDATED <- as.Date(nifc$STARTDATED)
nifc$YEAR <- as.numeric(format(nifc$STARTDATED, format="%Y"))
nifc$startday <- as.numeric(format(nifc$STARTDATED, format="%d"))
nifc$startmon <- as.numeric(format(nifc$STARTDATED, format="%m"))
nifc$startdaynum <- yday((strptime(nifc$STARTDATED, "%Y-%m-%d")))
Convert acres to hectares
nifc$AREA <- nifc$ACRES_CONT * 0.404686Map the data
library(maps)
plot(nifc$LATITUDE ~ nifc$LONGITUDE, ylim=c(17,80), xlim=c(-180,-55), type="n",
  xlab="Longitude", ylab="Latitude")
map("world", add=TRUE, lwd=2, col="gray")
points(nifc$LATITUDE ~ nifc$LONGITUDE, pch=16, cex=0.2, col="red")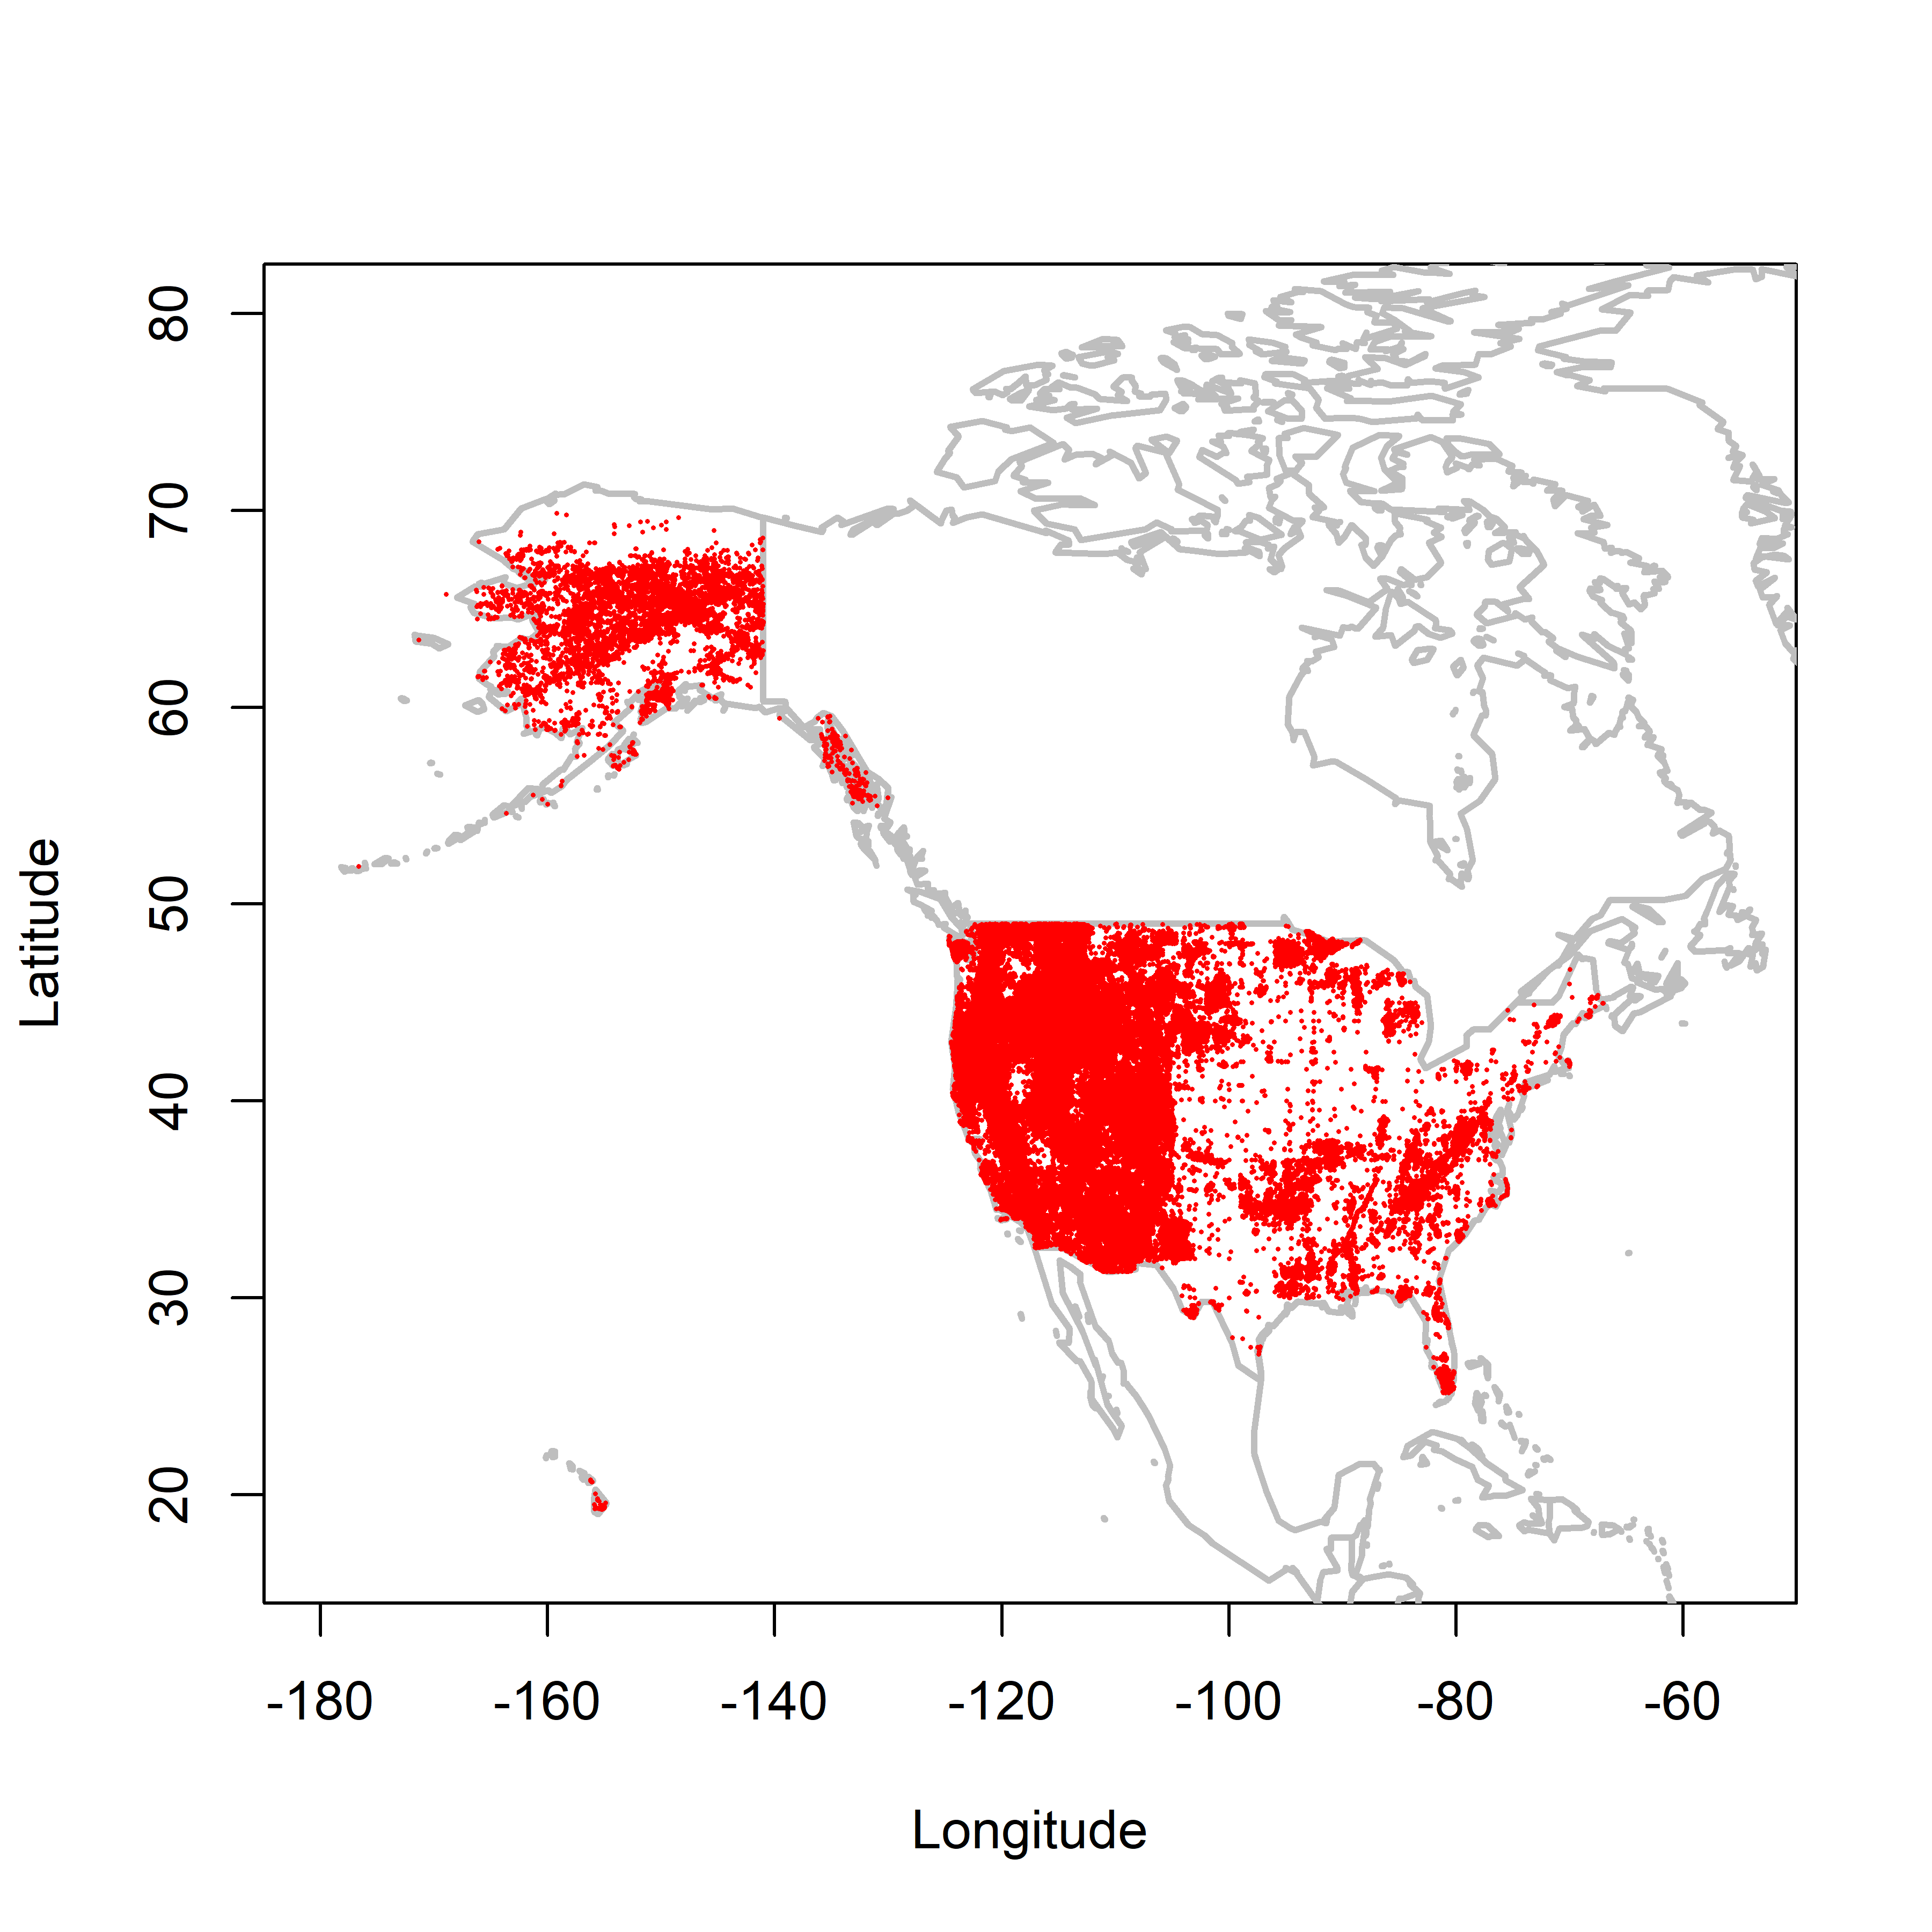
Number of fires by different causes.
# reorder SPECIFIC_C levels
table(nifc$SPECIFIC_C)
##
## 0 1 10 11 12 13 14 15 16 17 18 19 2 20 21
## 72892 76258 7883 11083 2183 5205 4391 3111 443 4044 3680 15034 268 208 72
## 22 23 24 25 26 27 28 29 3 30 31 32 4 5 6
## 203 146 1448 2843 4859 11503 123 403 6325 144501 23 2069 2181 1040 76
## 7 8 9
## 1461 11138 7936nifc$specific_cause <- ordered(nifc$SPECIFIC_C, levels=as.character(seq(0:32)))
table(nifc$specific_cause)##
## 1 2 3 4 5 6 7 8 9 10 11 12 13 14 15
## 76258 268 6325 2181 1040 76 1461 11138 7936 7883 11083 2183 5205 4391 3111
## 16 17 18 19 20 21 22 23 24 25 26 27 28 29 30
## 443 4044 3680 15034 208 72 203 146 1448 2843 4859 11503 123 403 144501
## 31 32 33
## 23 2069 0# 1 Natural; 2 Campfire; 3 Smoking; 4 Fire use; 5 Incendiary; 6 Equipment
# 7 Railroads; 8 Juveniles; 9 Miscellaneous; 0 Unknown
table(nifc$GENERAL_CA)##
## 0 1 2 3 4 5 6 7 8 9
## 22246 182663 31932 11672 33951 42126 15596 3357 16936 44554table(nifc$GENERAL_CA, nifc$AGENCY_COD)##
## BIA BLM FWS NPS USFS
## 0 5257 15531 0 1458 0
## 1 16254 48213 0 9926 108270
## 2 2181 3026 0 2573 24152
## 3 3013 1440 0 842 6377
## 4 18675 3651 0 3308 8317
## 5 15474 2246 0 2466 21940
## 6 3641 4436 0 1332 6187
## 7 585 1165 0 393 1214
## 8 13210 779 0 375 2572
## 9 13190 7820 0 4136 19408#
# 1 Lightning; 2 Aircraft; 3 Vehicle; 4 Exhaust; 5 Exhaust-other; 6 Logging Line; 7 Brakes; 8 Cooking/Warming;
# 9 Warming Fire; 10 Smoking; 11 Trash Burning; 12 Burning Dump; 13 Field Burning; 14 Land Clearing;
# 15 Slash Burning; 16 Right-of-way Burn; 17 Resource Management Burning; 18 Grudge Fire; 19 Recurrent;
# 20 Smoke Bees/Game; 21 Insect/Snake Control; 22 Employment; 23 Blasting; 24 Burning Building; 25 Power-line;
# 26 Fireworks; 27 Ignition Devices; 28 Repel Predators; 29 House/Stove Spark; 30 Other-Unknown;
# 31 Volcanic; 32 Other-Unknown
table(nifc$specific_cause)##
## 1 2 3 4 5 6 7 8 9 10 11 12 13 14 15
## 76258 268 6325 2181 1040 76 1461 11138 7936 7883 11083 2183 5205 4391 3111
## 16 17 18 19 20 21 22 23 24 25 26 27 28 29 30
## 443 4044 3680 15034 208 72 203 146 1448 2843 4859 11503 123 403 144501
## 31 32 33
## 23 2069 0table(as.integer(nifc$specific_cause), nifc$AGENCY_COD)##
## BIA BLM FWS NPS USFS
## 1 16192 0 0 9842 50224
## 2 39 99 0 35 95
## 3 1947 1724 0 579 2075
## 4 745 981 0 185 270
## 5 102 0 0 168 770
## 6 20 0 0 3 53
## 7 402 588 0 196 275
## 8 2041 2755 0 2478 3864
## 9 90 0 0 21 7825
## 10 3090 1440 0 841 2512
## 11 7985 924 0 530 1644
## 12 1368 552 0 106 157
## 13 3933 663 0 208 401
## 14 3120 546 0 204 521
## 15 1242 498 0 150 1221
## 16 256 58 0 26 103
## 17 234 177 0 3406 227
## 18 1340 120 0 477 1743
## 19 10250 1178 0 716 2890
## 20 46 0 0 37 125
## 21 31 0 0 5 36
## 22 74 9 0 10 110
## 23 9 66 0 12 59
## 24 809 140 0 85 414
## 25 543 686 0 383 1231
## 26 3180 745 0 346 588
## 27 10043 453 0 241 766
## 28 77 0 0 0 46
## 29 173 0 0 21 209
## 30 15861 6639 0 4018 117983
## 31 0 0 0 23 0
## 32 981 1088 0 0 0# 0 Unknown; 1 Lightning; 2 Human
nifc$CAUSE <- as.numeric(levels(nifc$GENERAL_CA))[nifc$GENERAL_CA]
nifc$CAUSE[nifc$CAUSE >= 2] <- 2
table(nifc$CAUSE)##
## 0 1 2
## 22246 182663 200124table(nifc$CAUSE, nifc$AGENCY_COD)##
## BIA BLM FWS NPS USFS
## 0 5257 15531 0 1458 0
## 1 16254 48213 0 9926 108270
## 2 69969 24563 0 15425 90167Number of fires per year
hist(nifc$YEAR, xlim=c(1980,2015), ylim=c(0,150000),breaks=seq(1979.5,2014.5,by=1))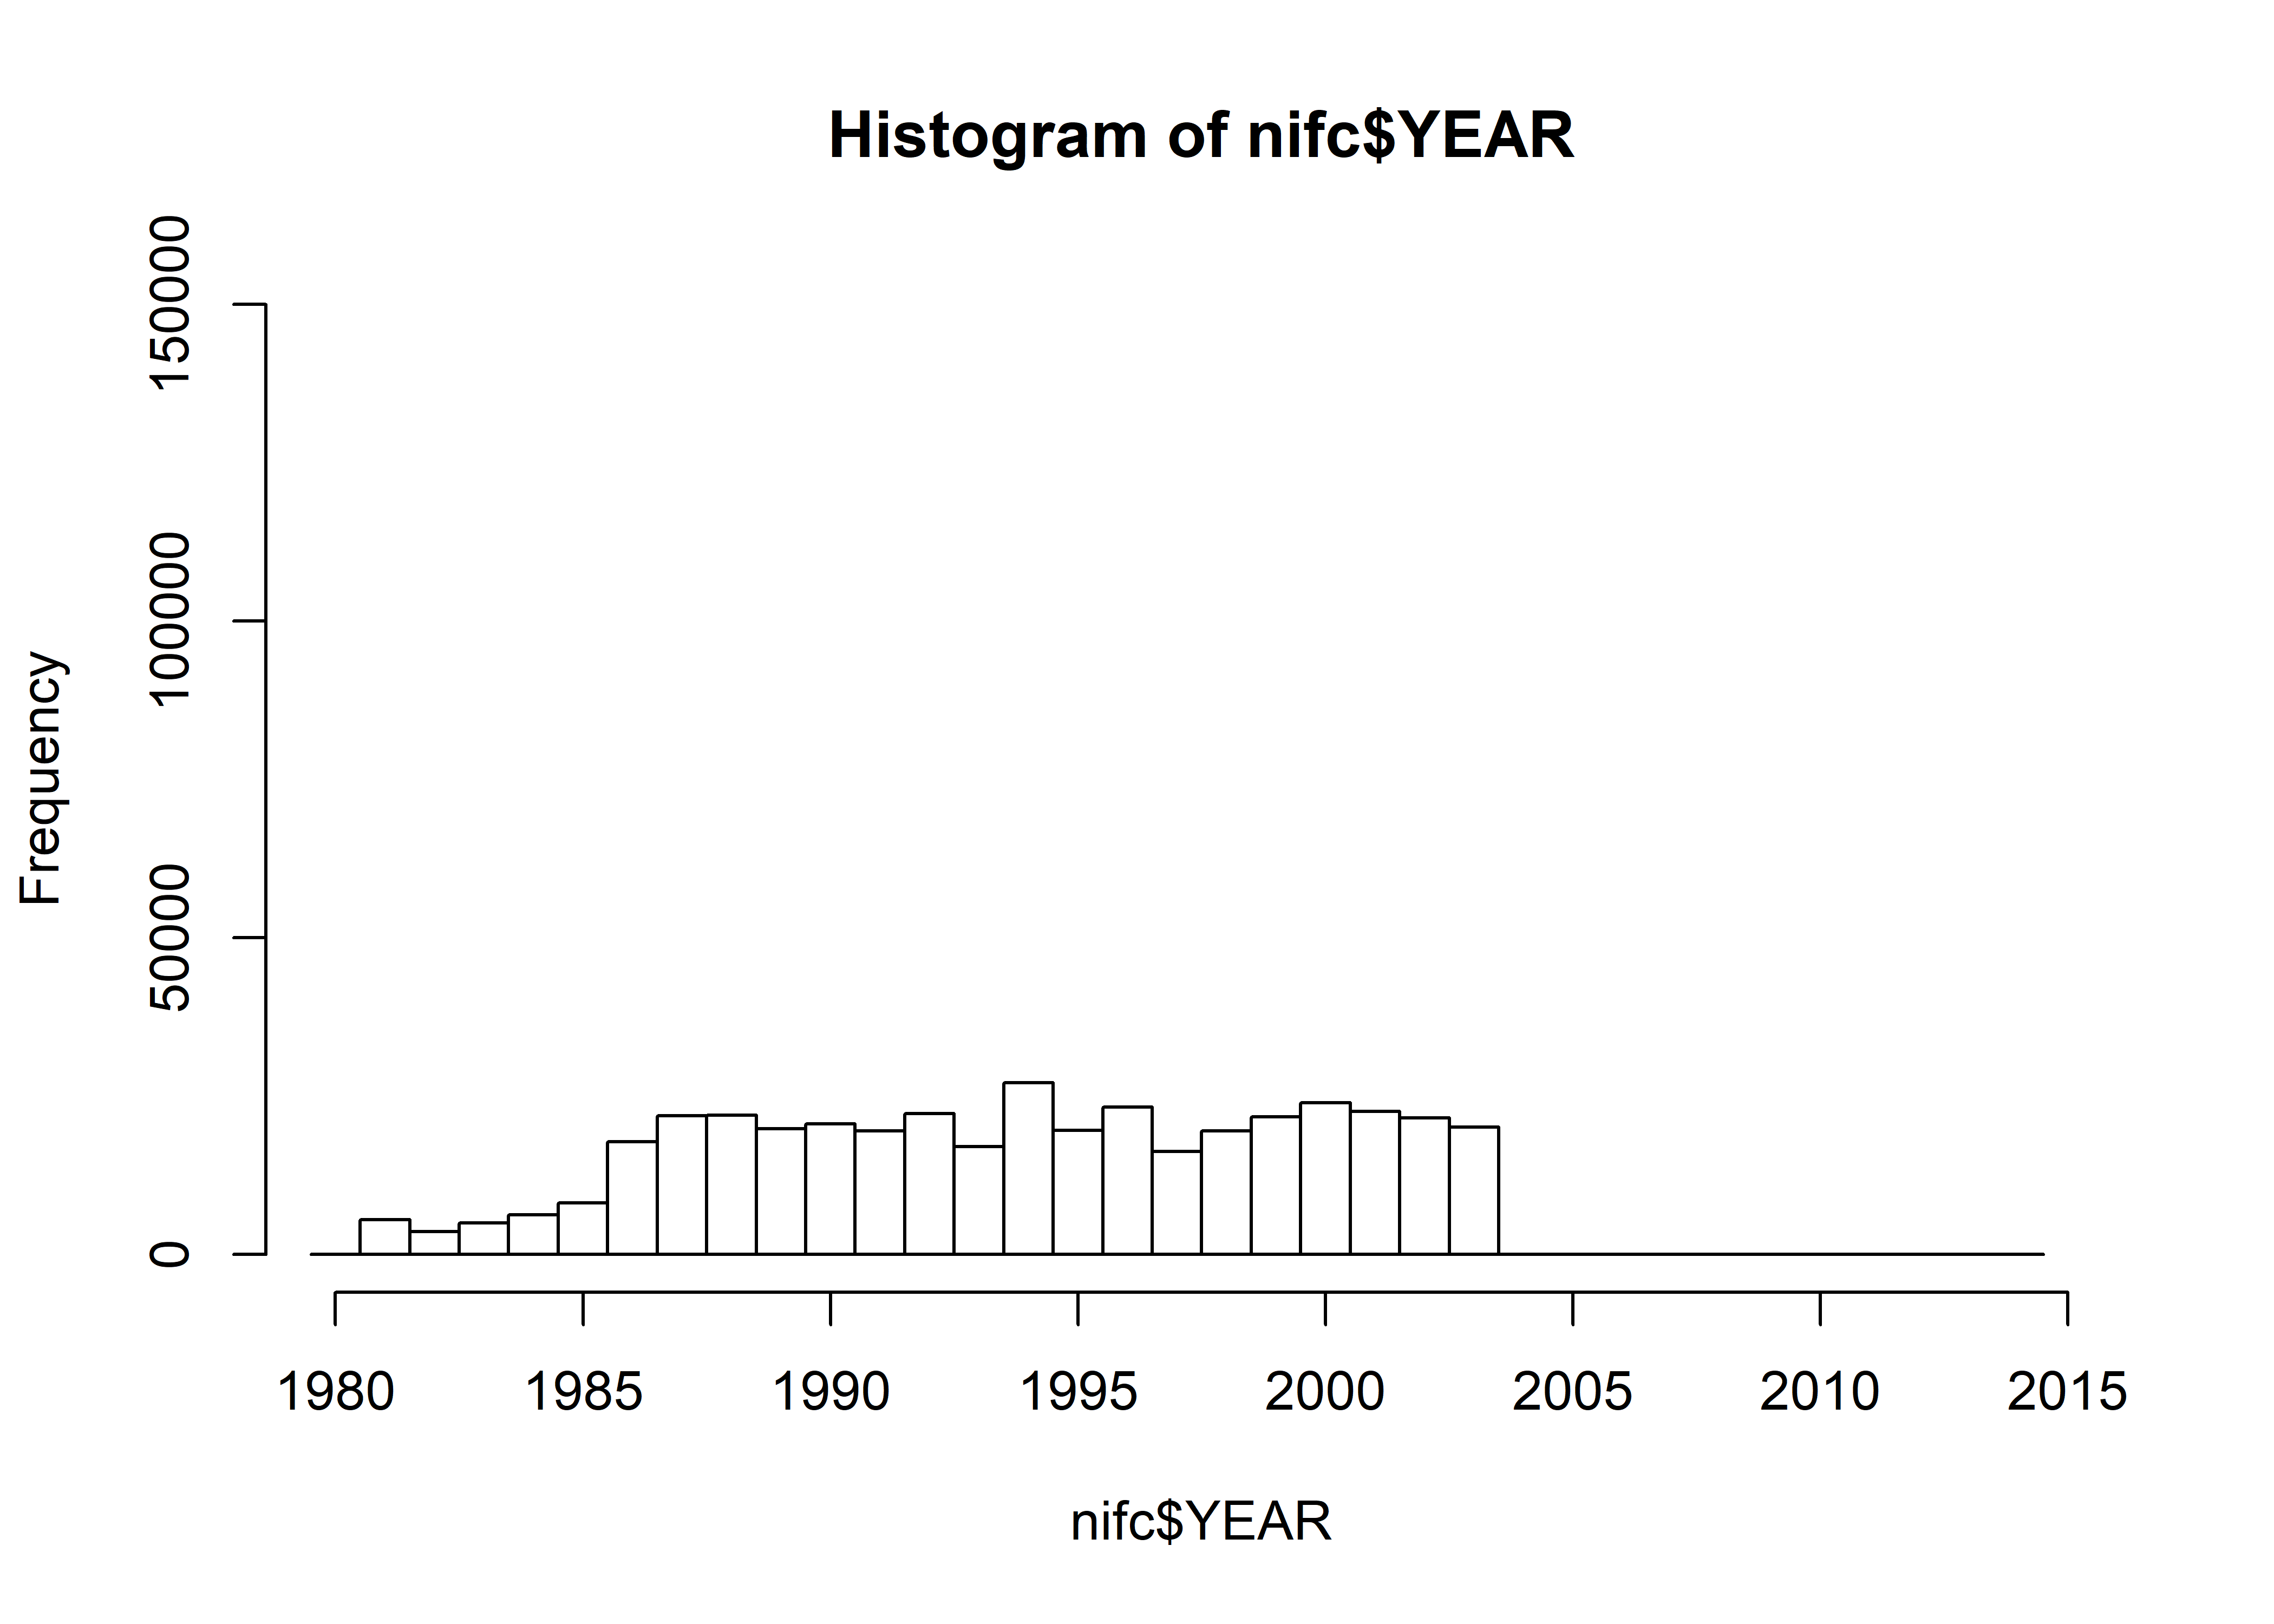
table(nifc$YEAR)##
## 1981 1982 1983 1984 1985 1986 1987 1988 1989 1990 1991 1992 1993 1994 1995 1996 1997
## 5470 3622 4962 6223 8172 17760 21873 21950 19857 20606 19530 22266 17025 27081 19560 23273 16280
## 1998 1999 2000 2001 2002 2003
## 19524 21726 23975 22581 21545 20075hist(nifc$YEAR[nifc$CAUSE == 1], xlim=c(1980,2015), ylim=c(0,150000),
breaks=seq(1979.5,2014.5,by=1), main="nifc Natural")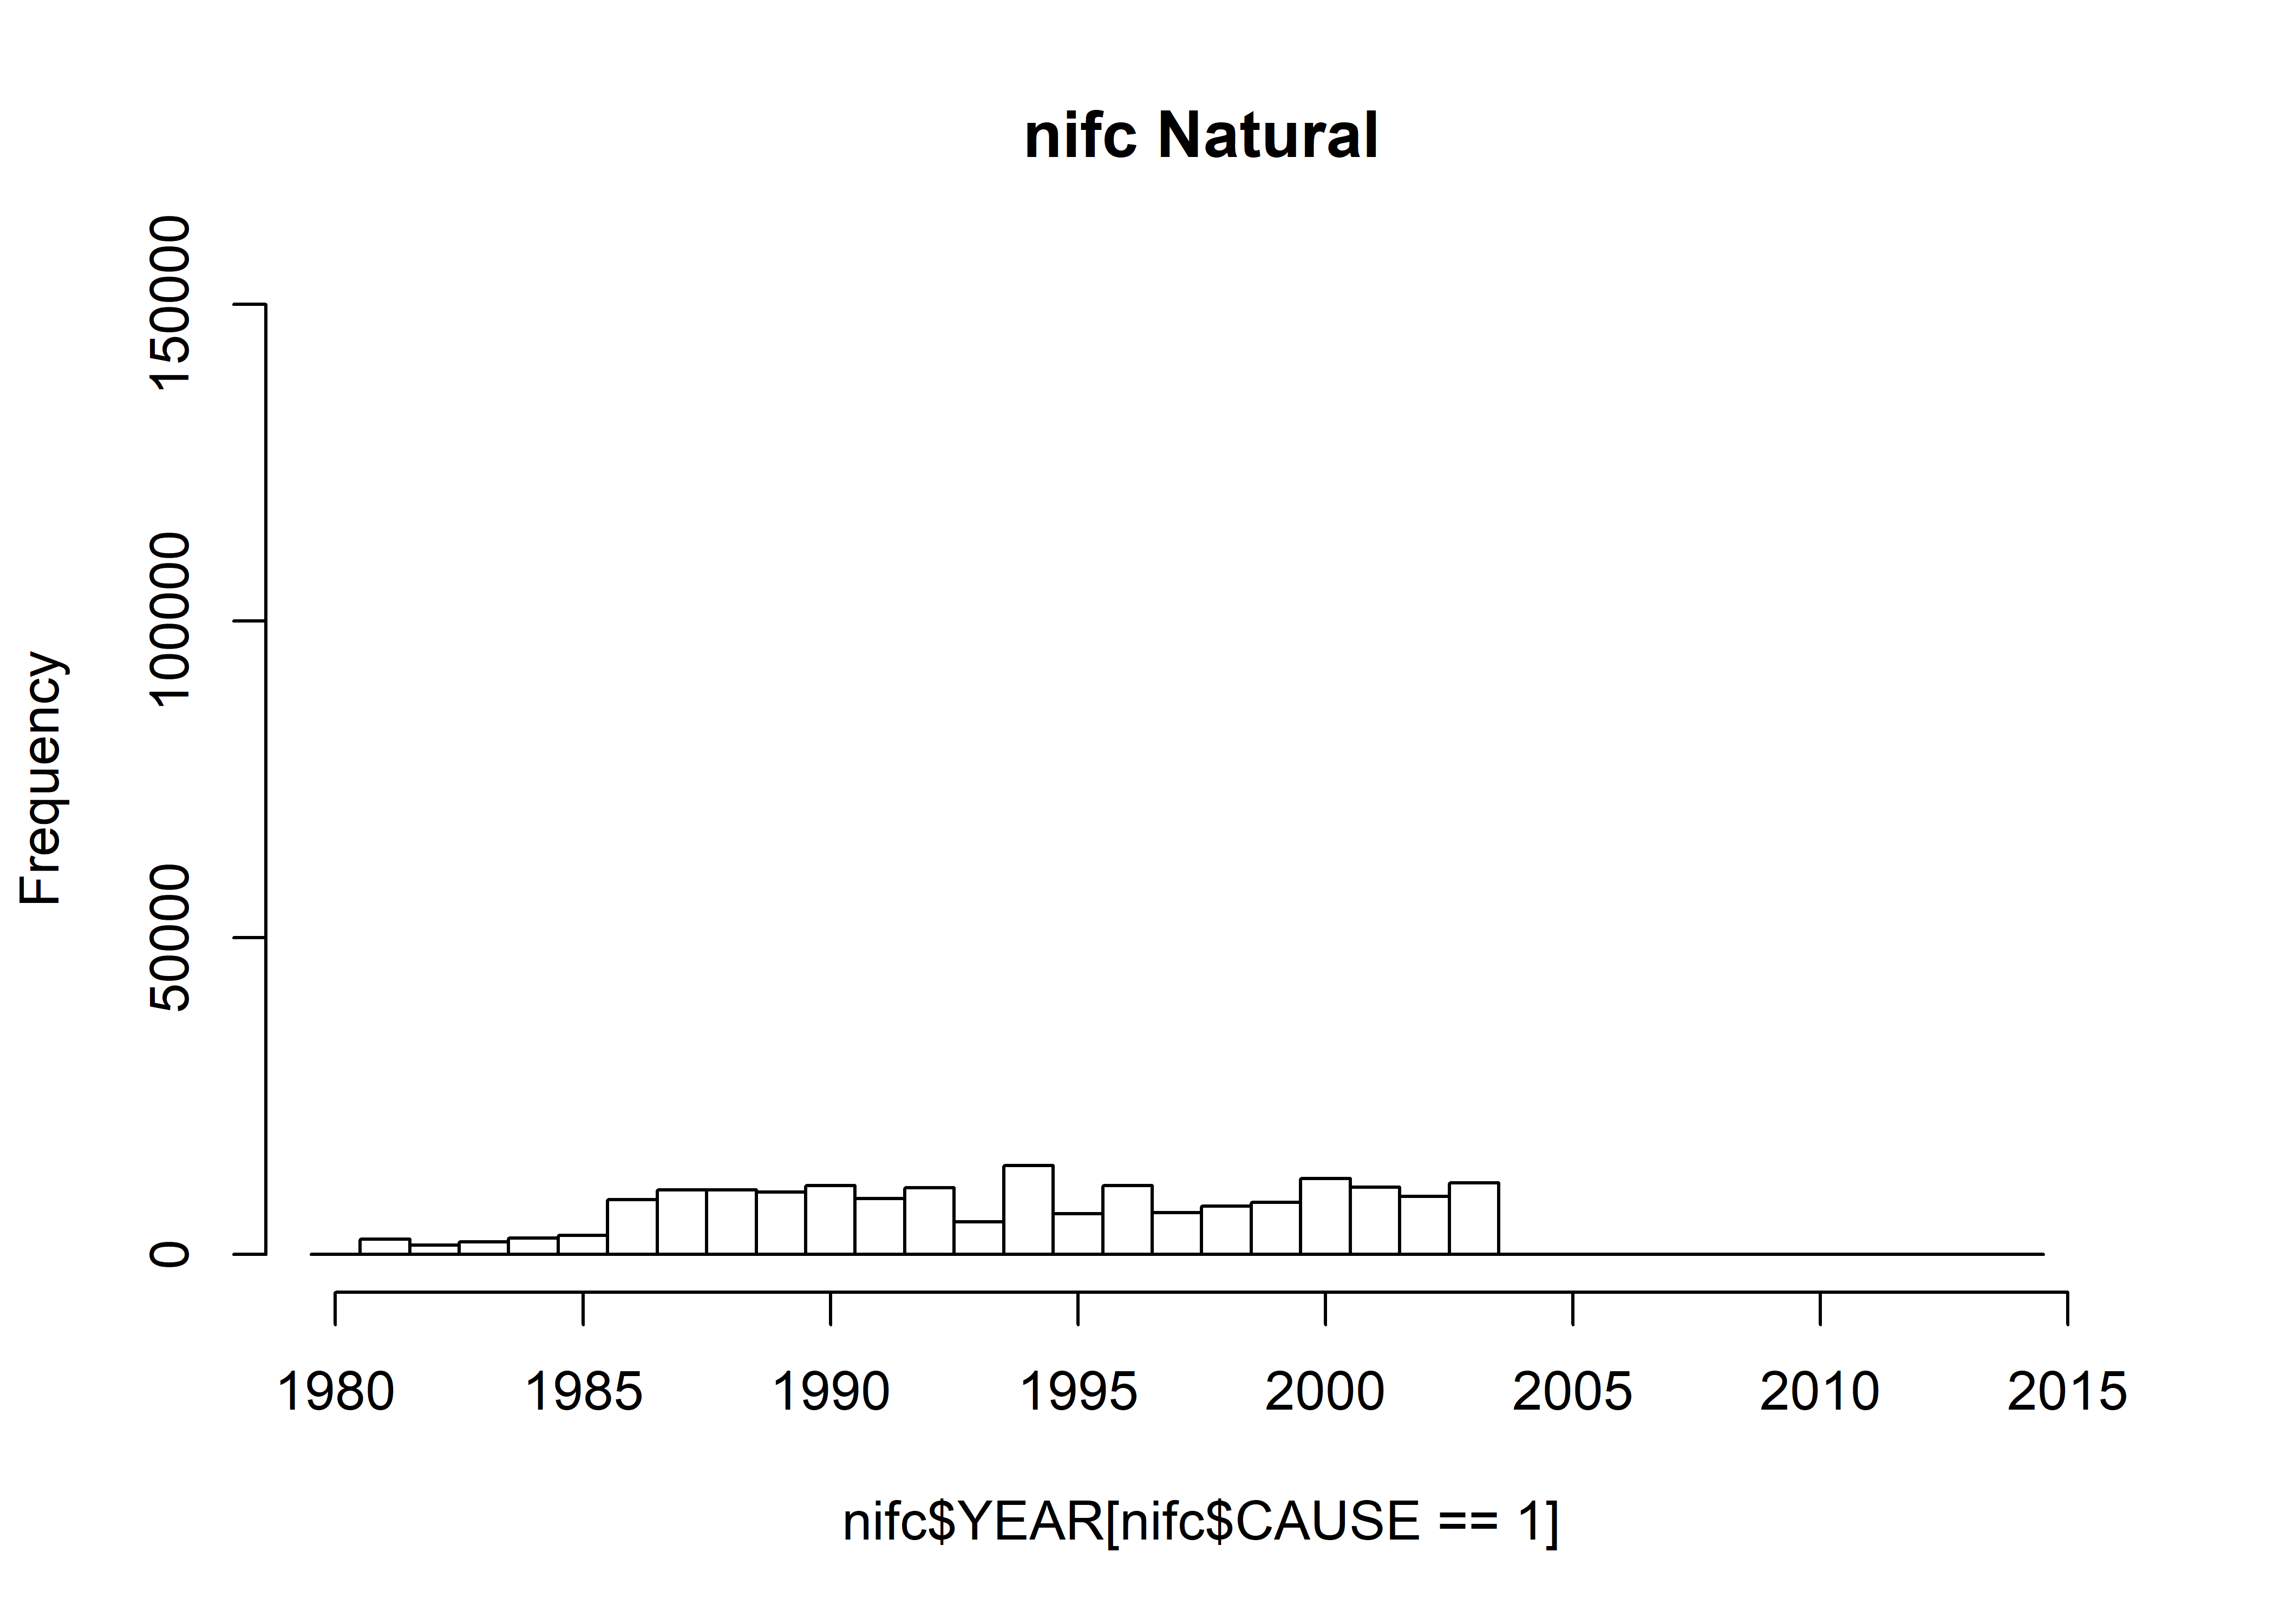
table(nifc$YEAR[nifc$CAUSE == 1])##
## 1981 1982 1983 1984 1985 1986 1987 1988 1989 1990 1991 1992 1993 1994 1995 1996 1997
## 2443 1452 1953 2553 2980 8620 10167 10216 9872 10897 8857 10540 5193 14035 6424 10900 6612
## 1998 1999 2000 2001 2002 2003
## 7589 8260 12028 10648 9138 11281hist(nifc$YEAR[nifc$CAUSE > 1], xlim=c(1980,2015), ylim=c(0,150000),
breaks=seq(1979.5,2014.5,by=1), main="nifc Human")
table(nifc$YEAR[nifc$CAUSE > 1])##
## 1981 1982 1983 1984 1985 1986 1987 1988 1989 1990 1991 1992 1993 1994 1995 1996 1997
## 2292 1578 2214 2867 4300 8300 10813 10860 9280 8718 9641 10688 10792 11834 11946 11031 8419
## 1998 1999 2000 2001 2002 2003
## 10237 12471 11098 10940 11352 8435Get the total area burned by year
size.year <- na.omit(cbind(nifc$AREA,nifc$YEAR))
total_by_year <- tapply(size.year[,1],size.year[,2],sum)
year <- as.numeric(unlist(dimnames(total_by_year)))
total_by_year <- as.numeric(total_by_year)
plot(total_by_year ~ year, pch=16, type="o", lwd=3, col="red", xlim=c(1980,2013),
  main="Total Area Burned (ha) (U.S. All)")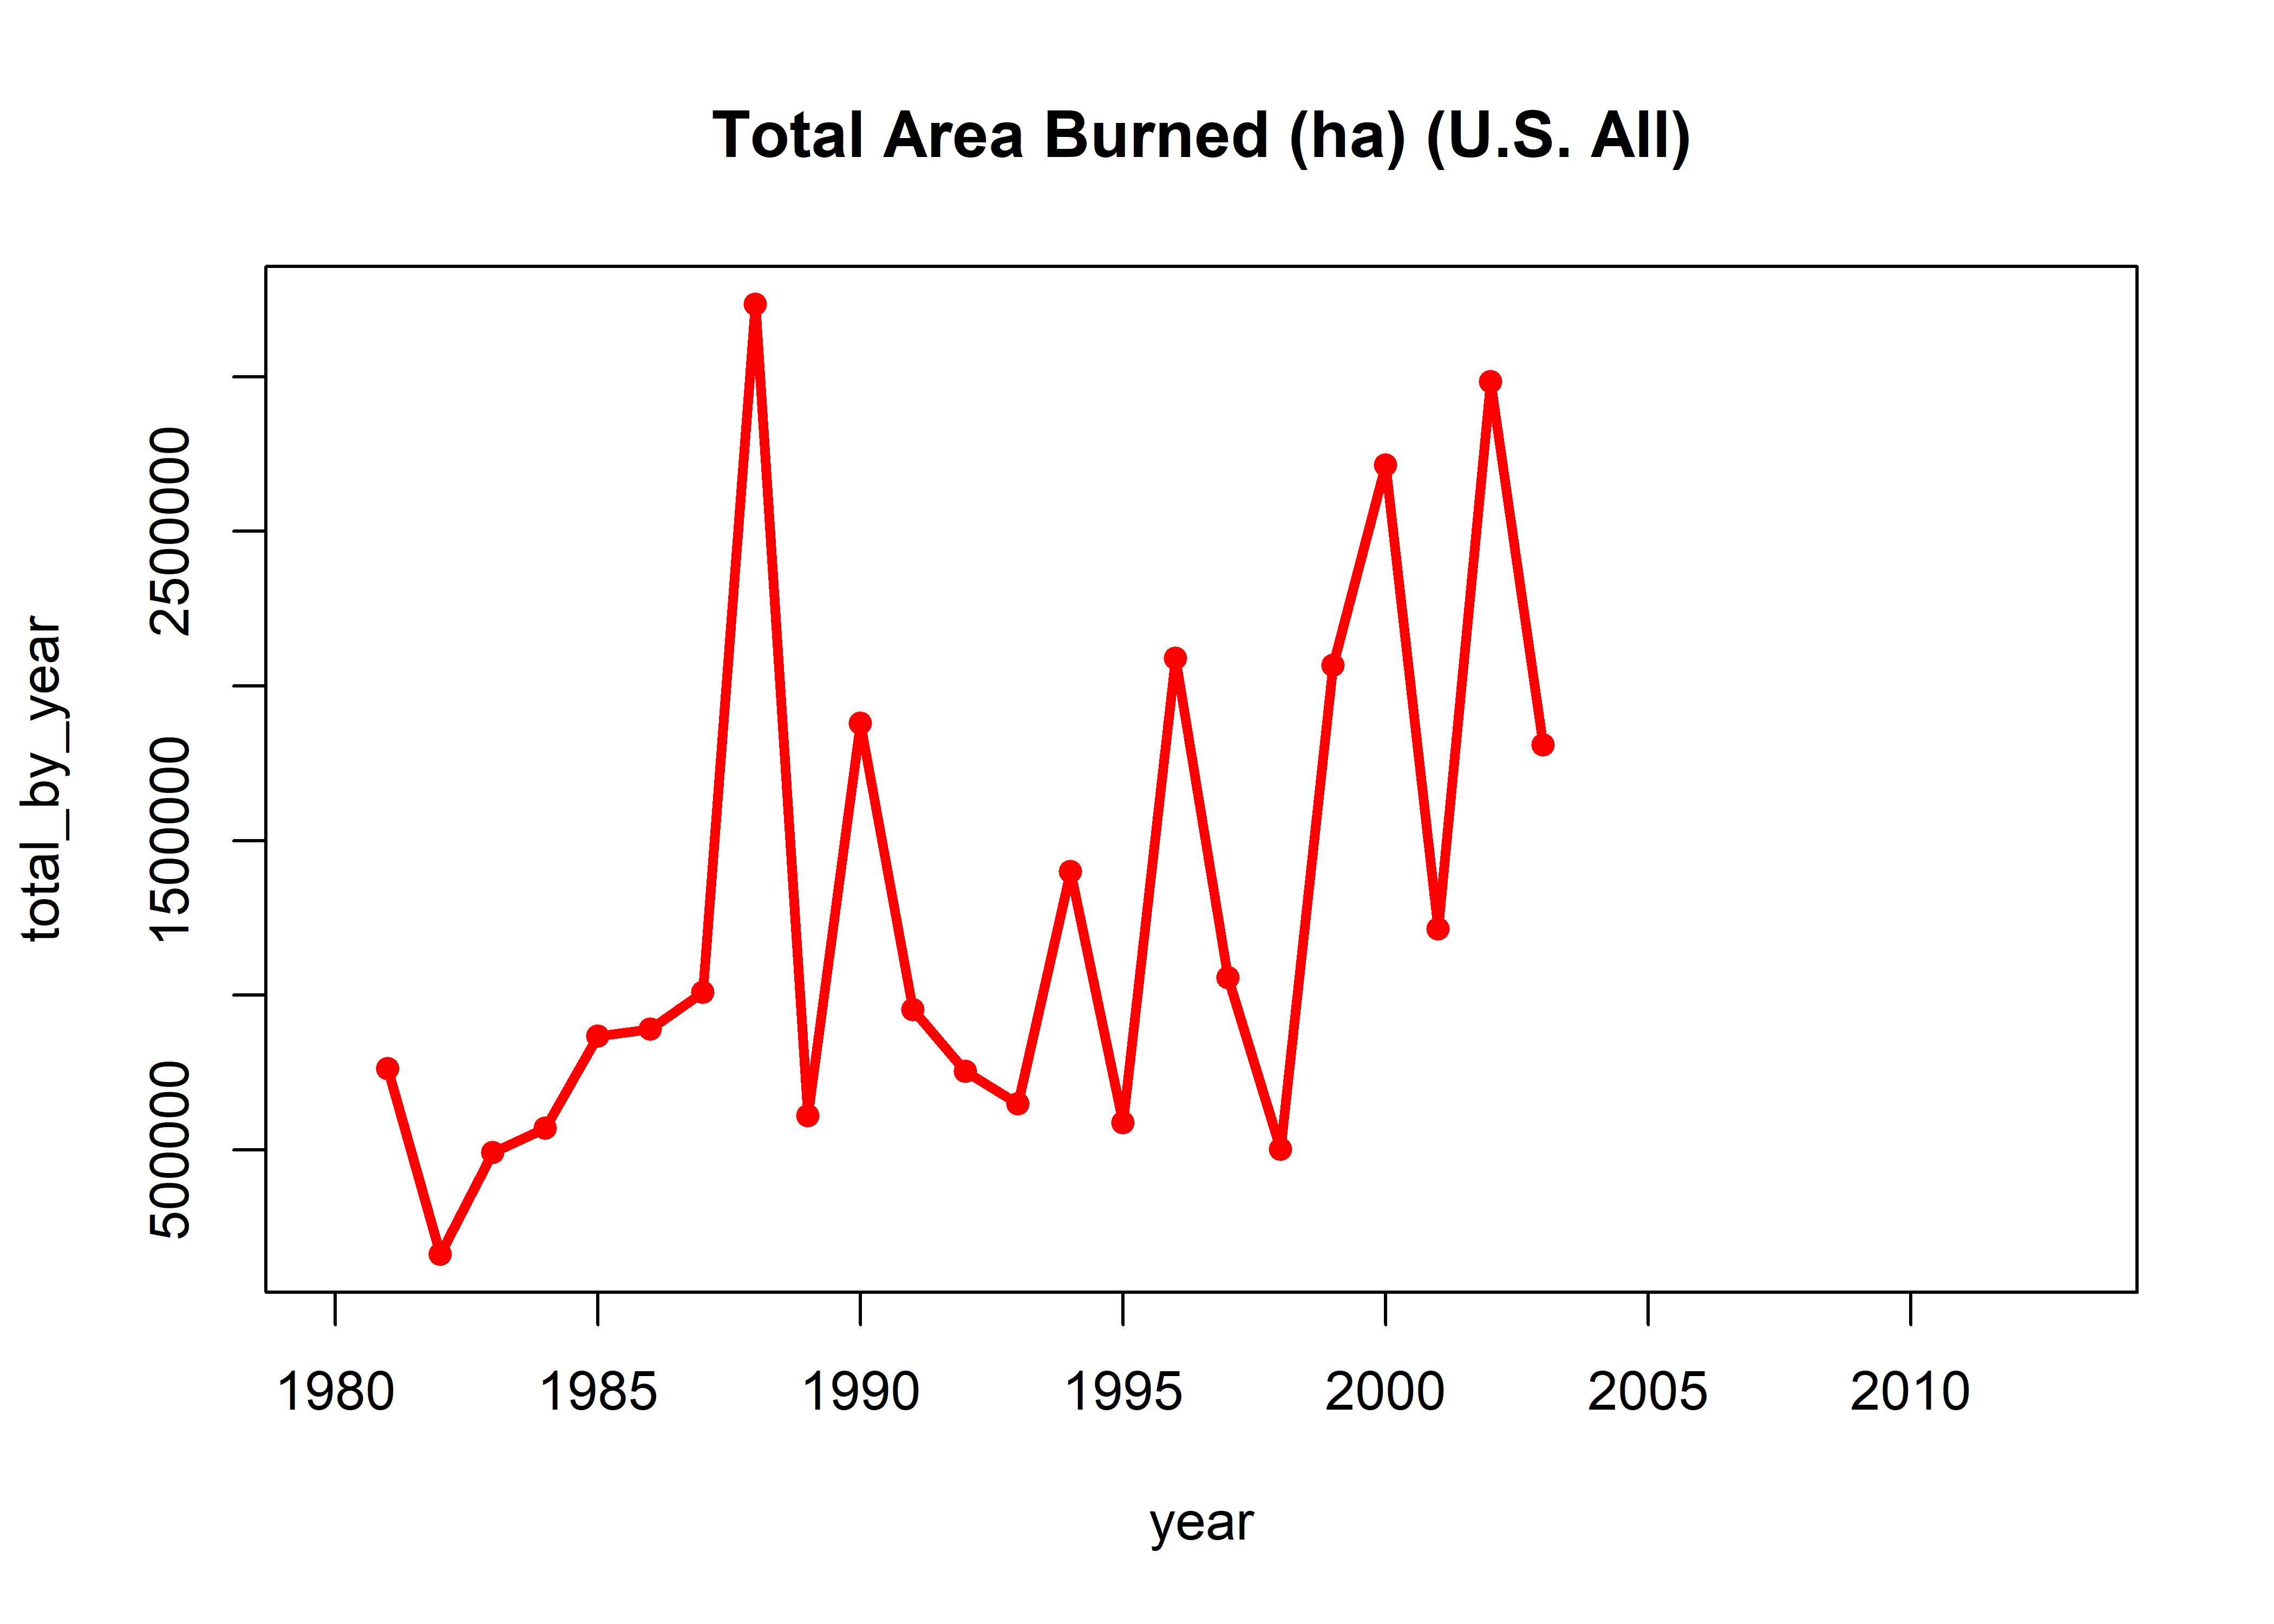
Mean area burned by year.
mean_by_year <- tapply(size.year[,1],size.year[,2],mean)
mean_by_year
## 1981 1982 1983 1984 1985 1986 1987 1988 1989 1990
## 139.23643 44.61810 99.03089 91.45392 106.08337 50.11265 46.12577 147.36037 30.68684 91.18336
## 1991 1992 1993 1994 1995 1996 1997 1998 1999 2000
## 48.83555 33.86250 38.08697 51.70260 30.06551 89.75962 64.95209 25.66716 95.09762 113.23597
## 2001 2002 2003
## 53.77868 138.51198 90.11396year <- as.numeric(unlist(dimnames(mean_by_year)))
mean_by_year <- as.numeric(mean_by_year)
plot(mean_by_year ~ year, pch=16, type="o", lwd=3, col="red", xlim=c(1980,2013),
main="Mean Area Burned (ha) (U.S. All)")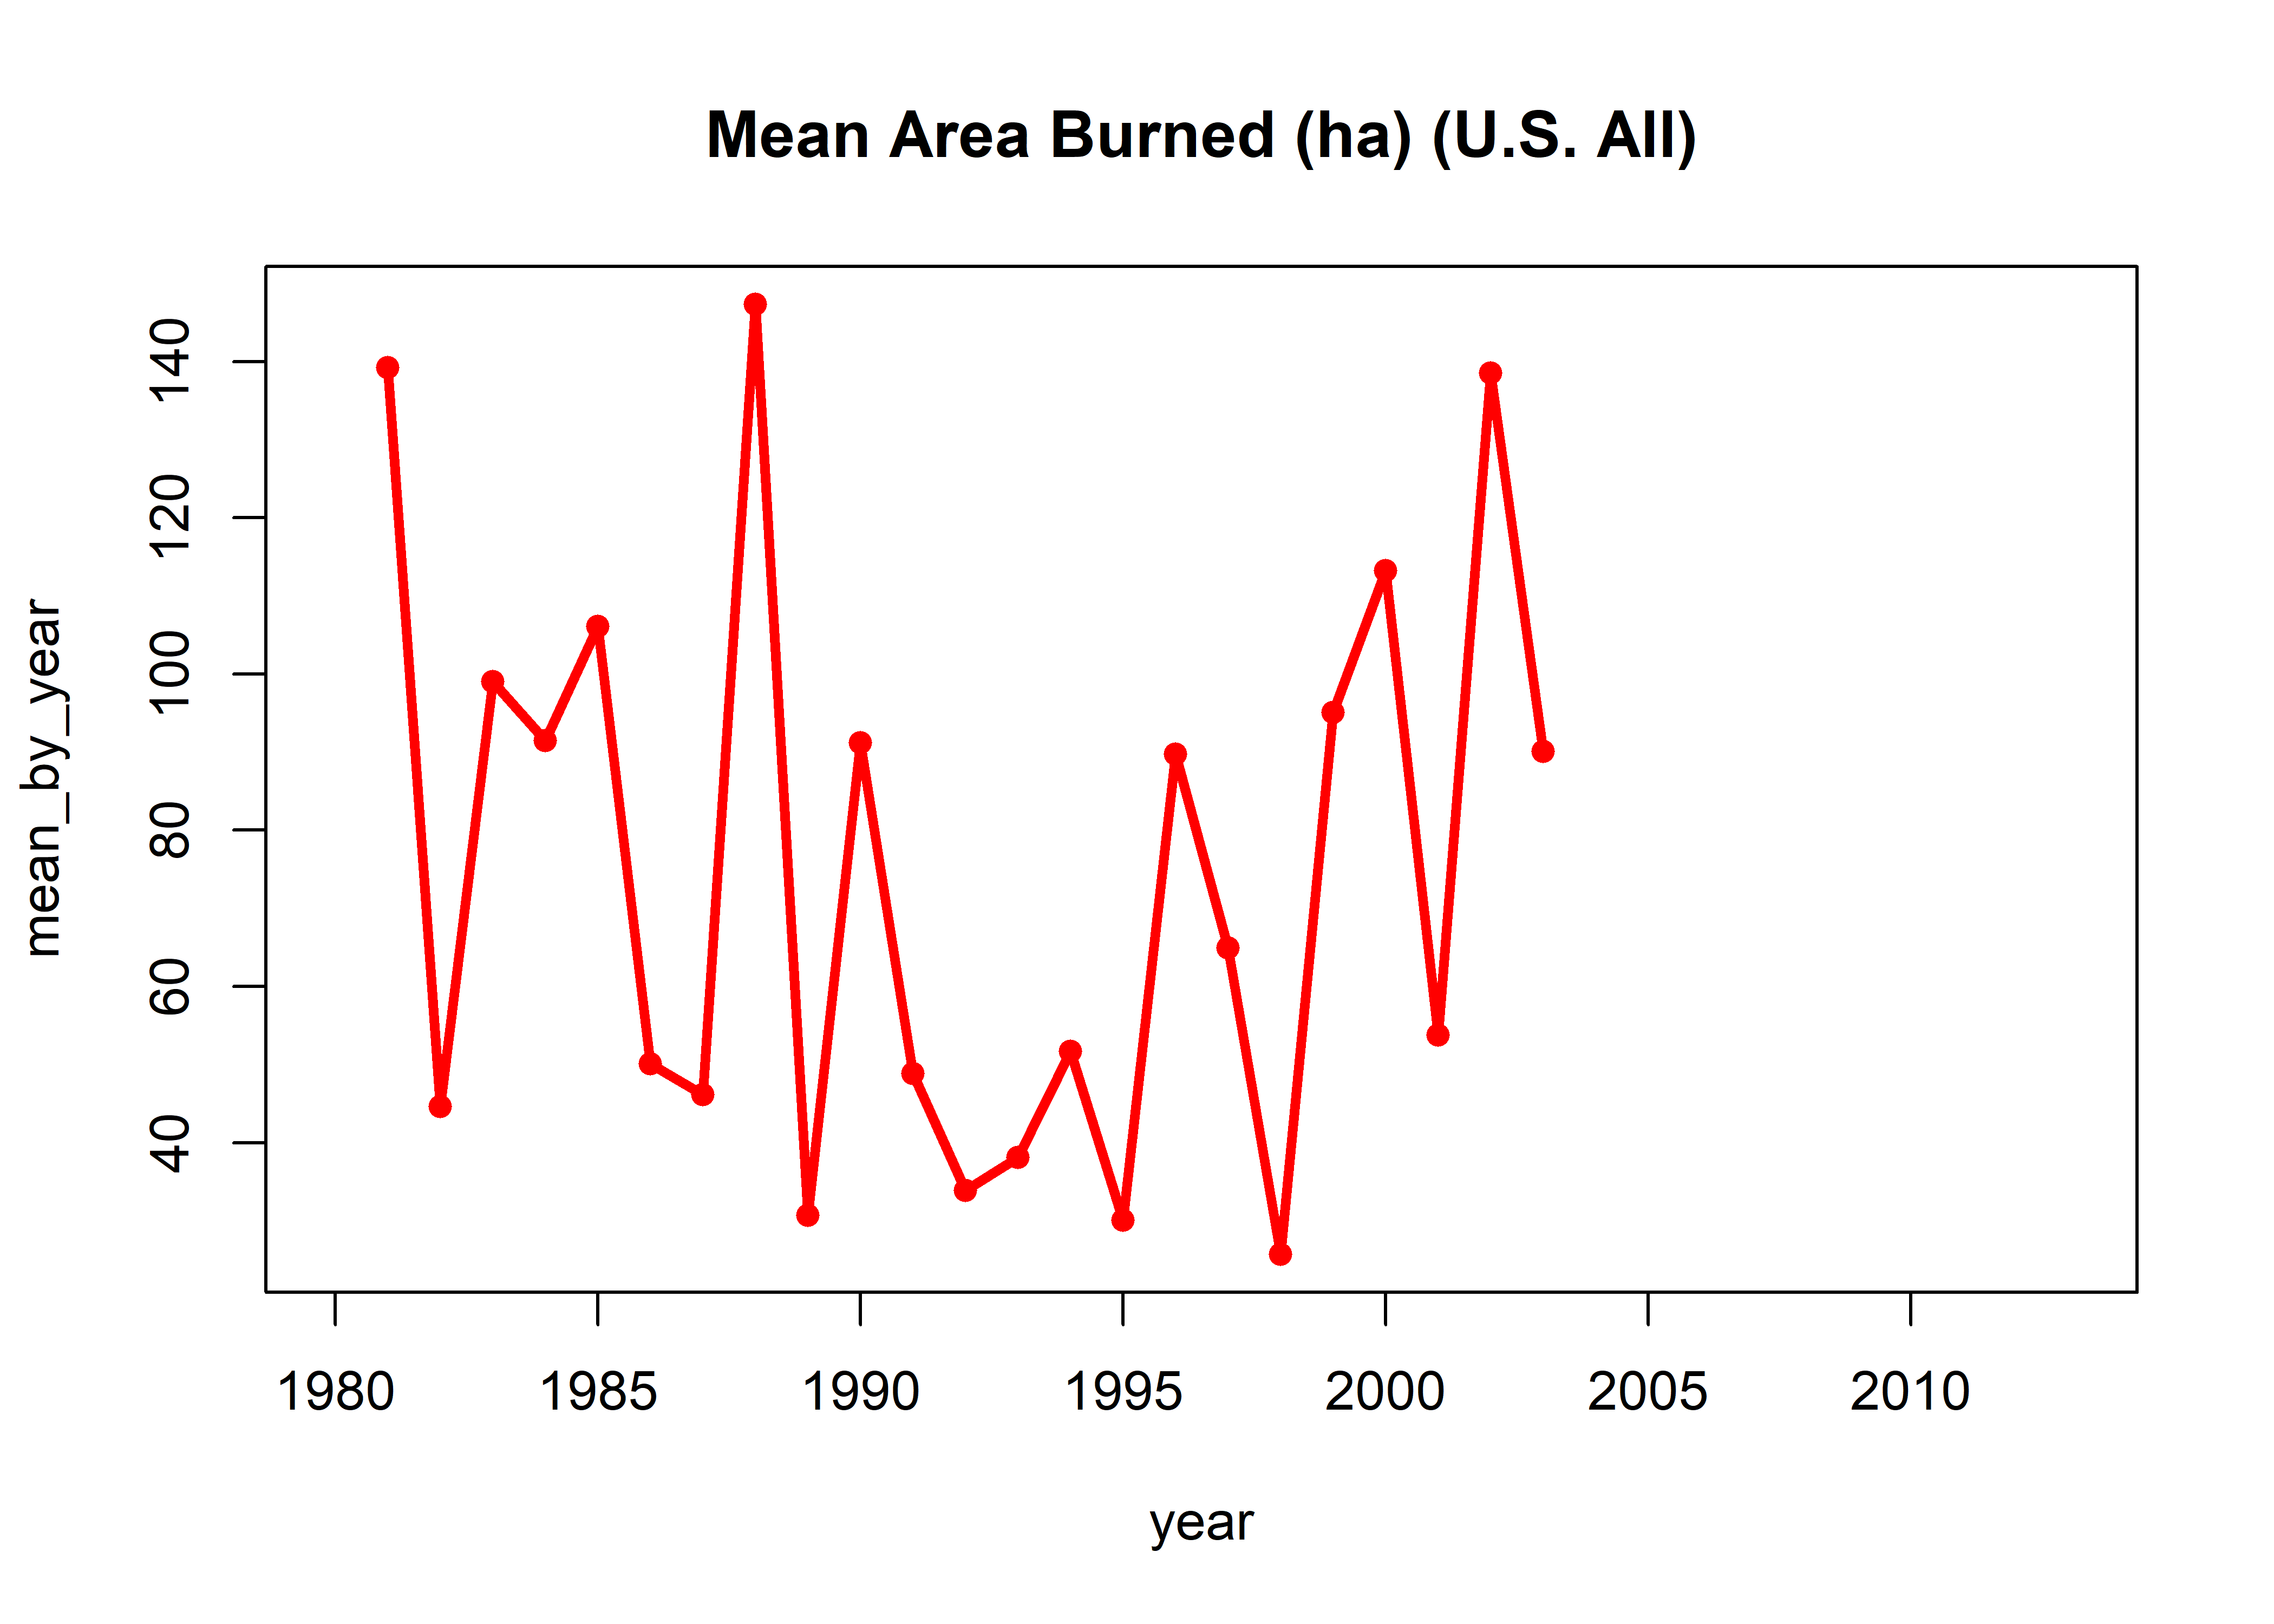
Histograms of start-day number of the YEAR (startdaynum) for all data, human and lightning:
hist(nifc$startdaynum, breaks=seq(-0.5,366.5,by=1), freq=-TRUE, ylim=c(0,6000), xlim=c(0,400))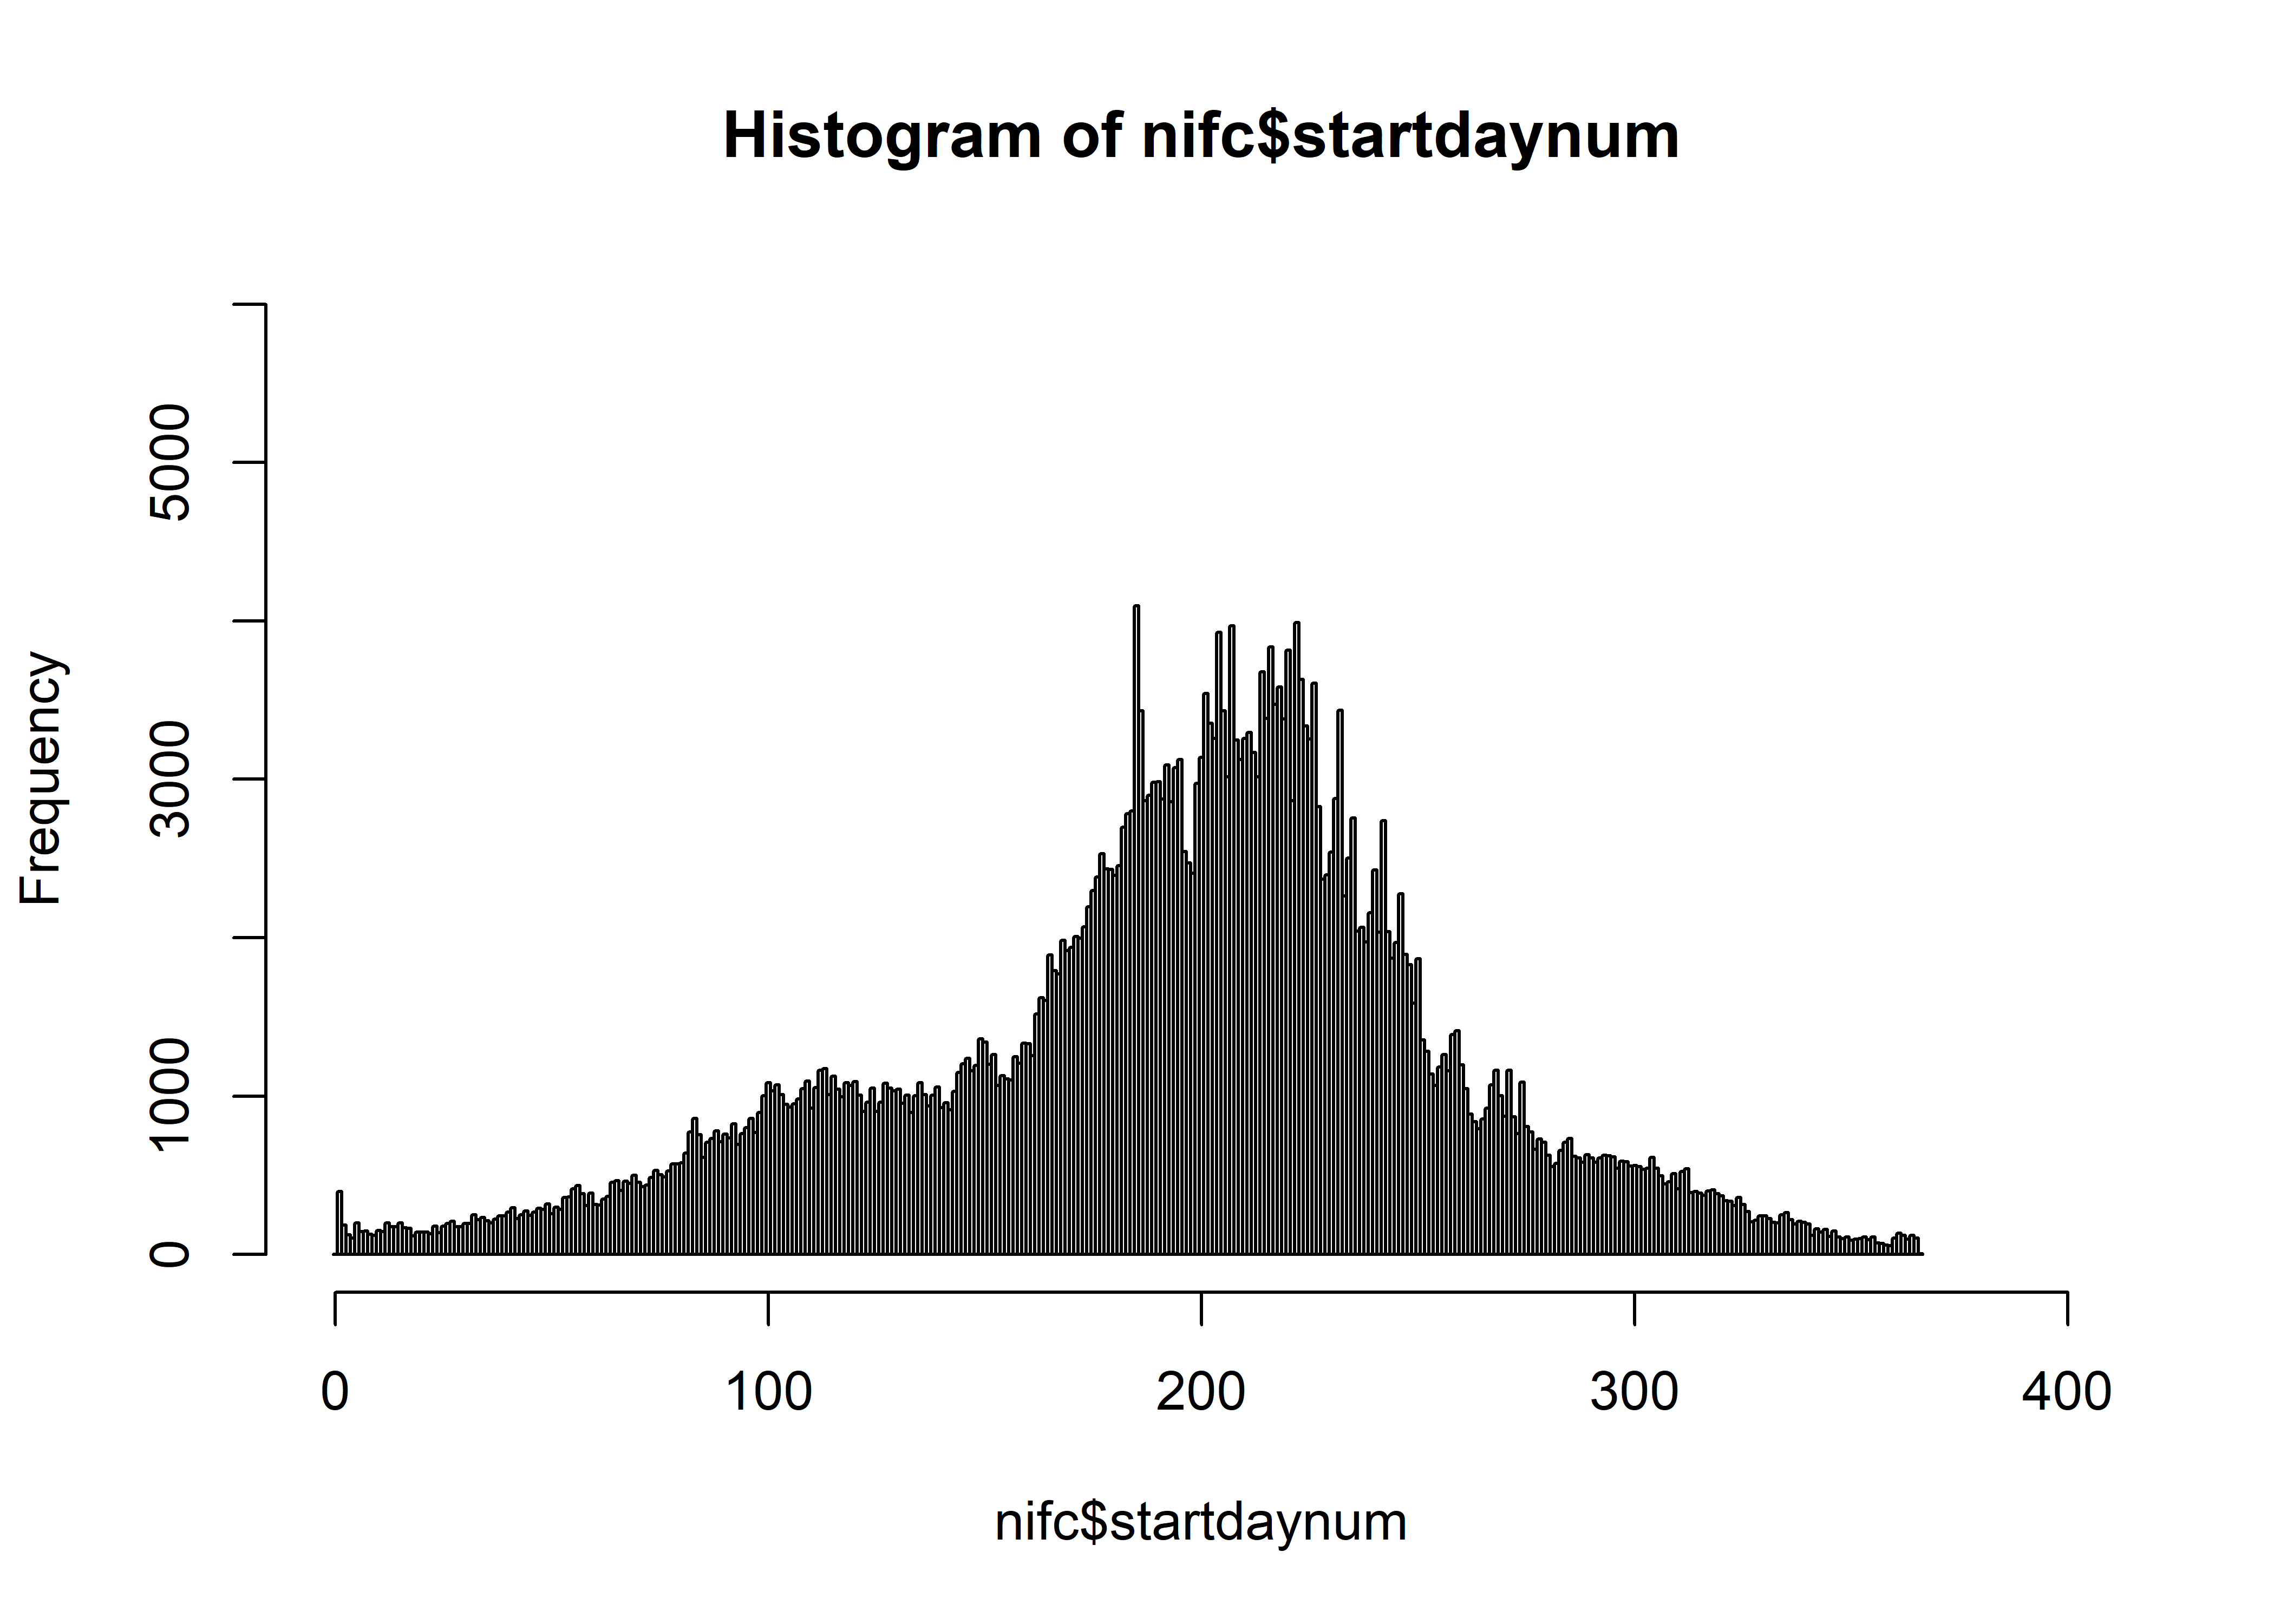
hist(nifc$startdaynum[nifc$CAUSE==1], breaks=seq(-0.5,366.5,by=1), freq=-TRUE,
  xlim=c(0,400), ylim=c(0,6000), main="nifc Natural")
hist(nifc$startdaynum[nifc$CAUSE==2], breaks=seq(-0.5,366.5,by=1), freq=-TRUE,
  xlim=c(0,400), ylim=c(0,6000), main="nifc Human")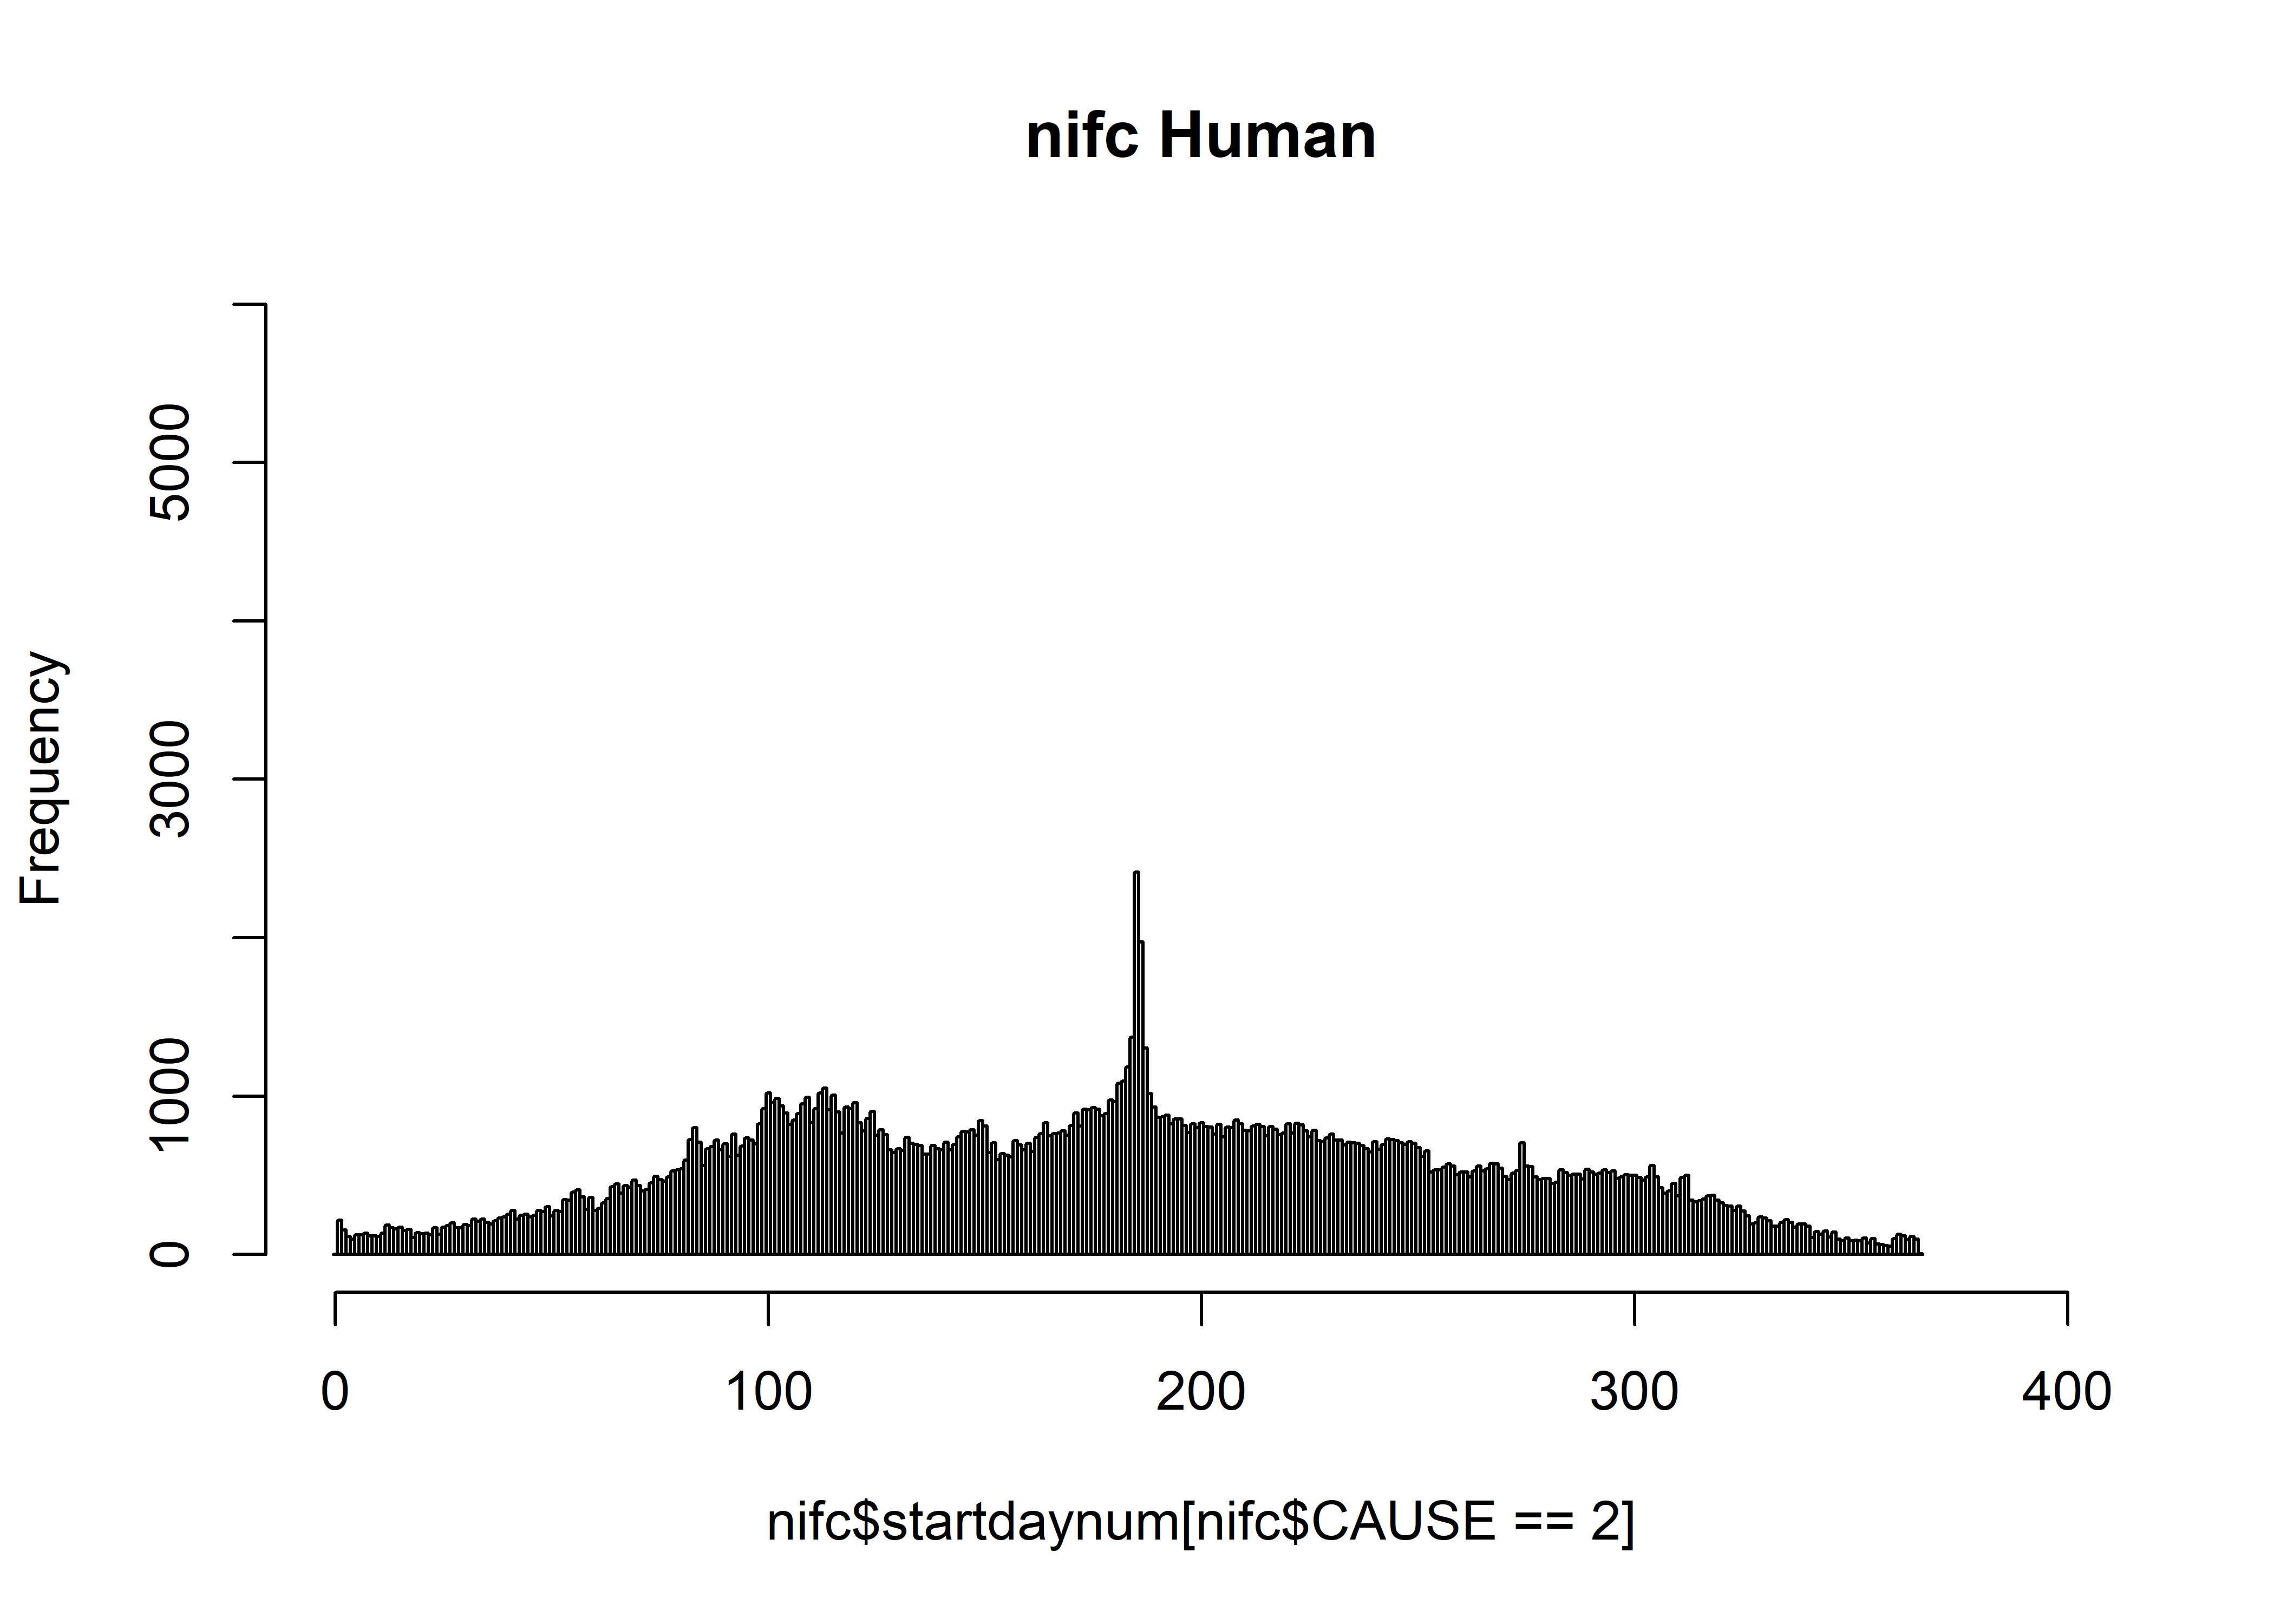
Histograms of the start day over all months
hist(nifc$startday, breaks=seq(-0.5,31.5,by=1), freq=-TRUE, ylim=c(0,60000))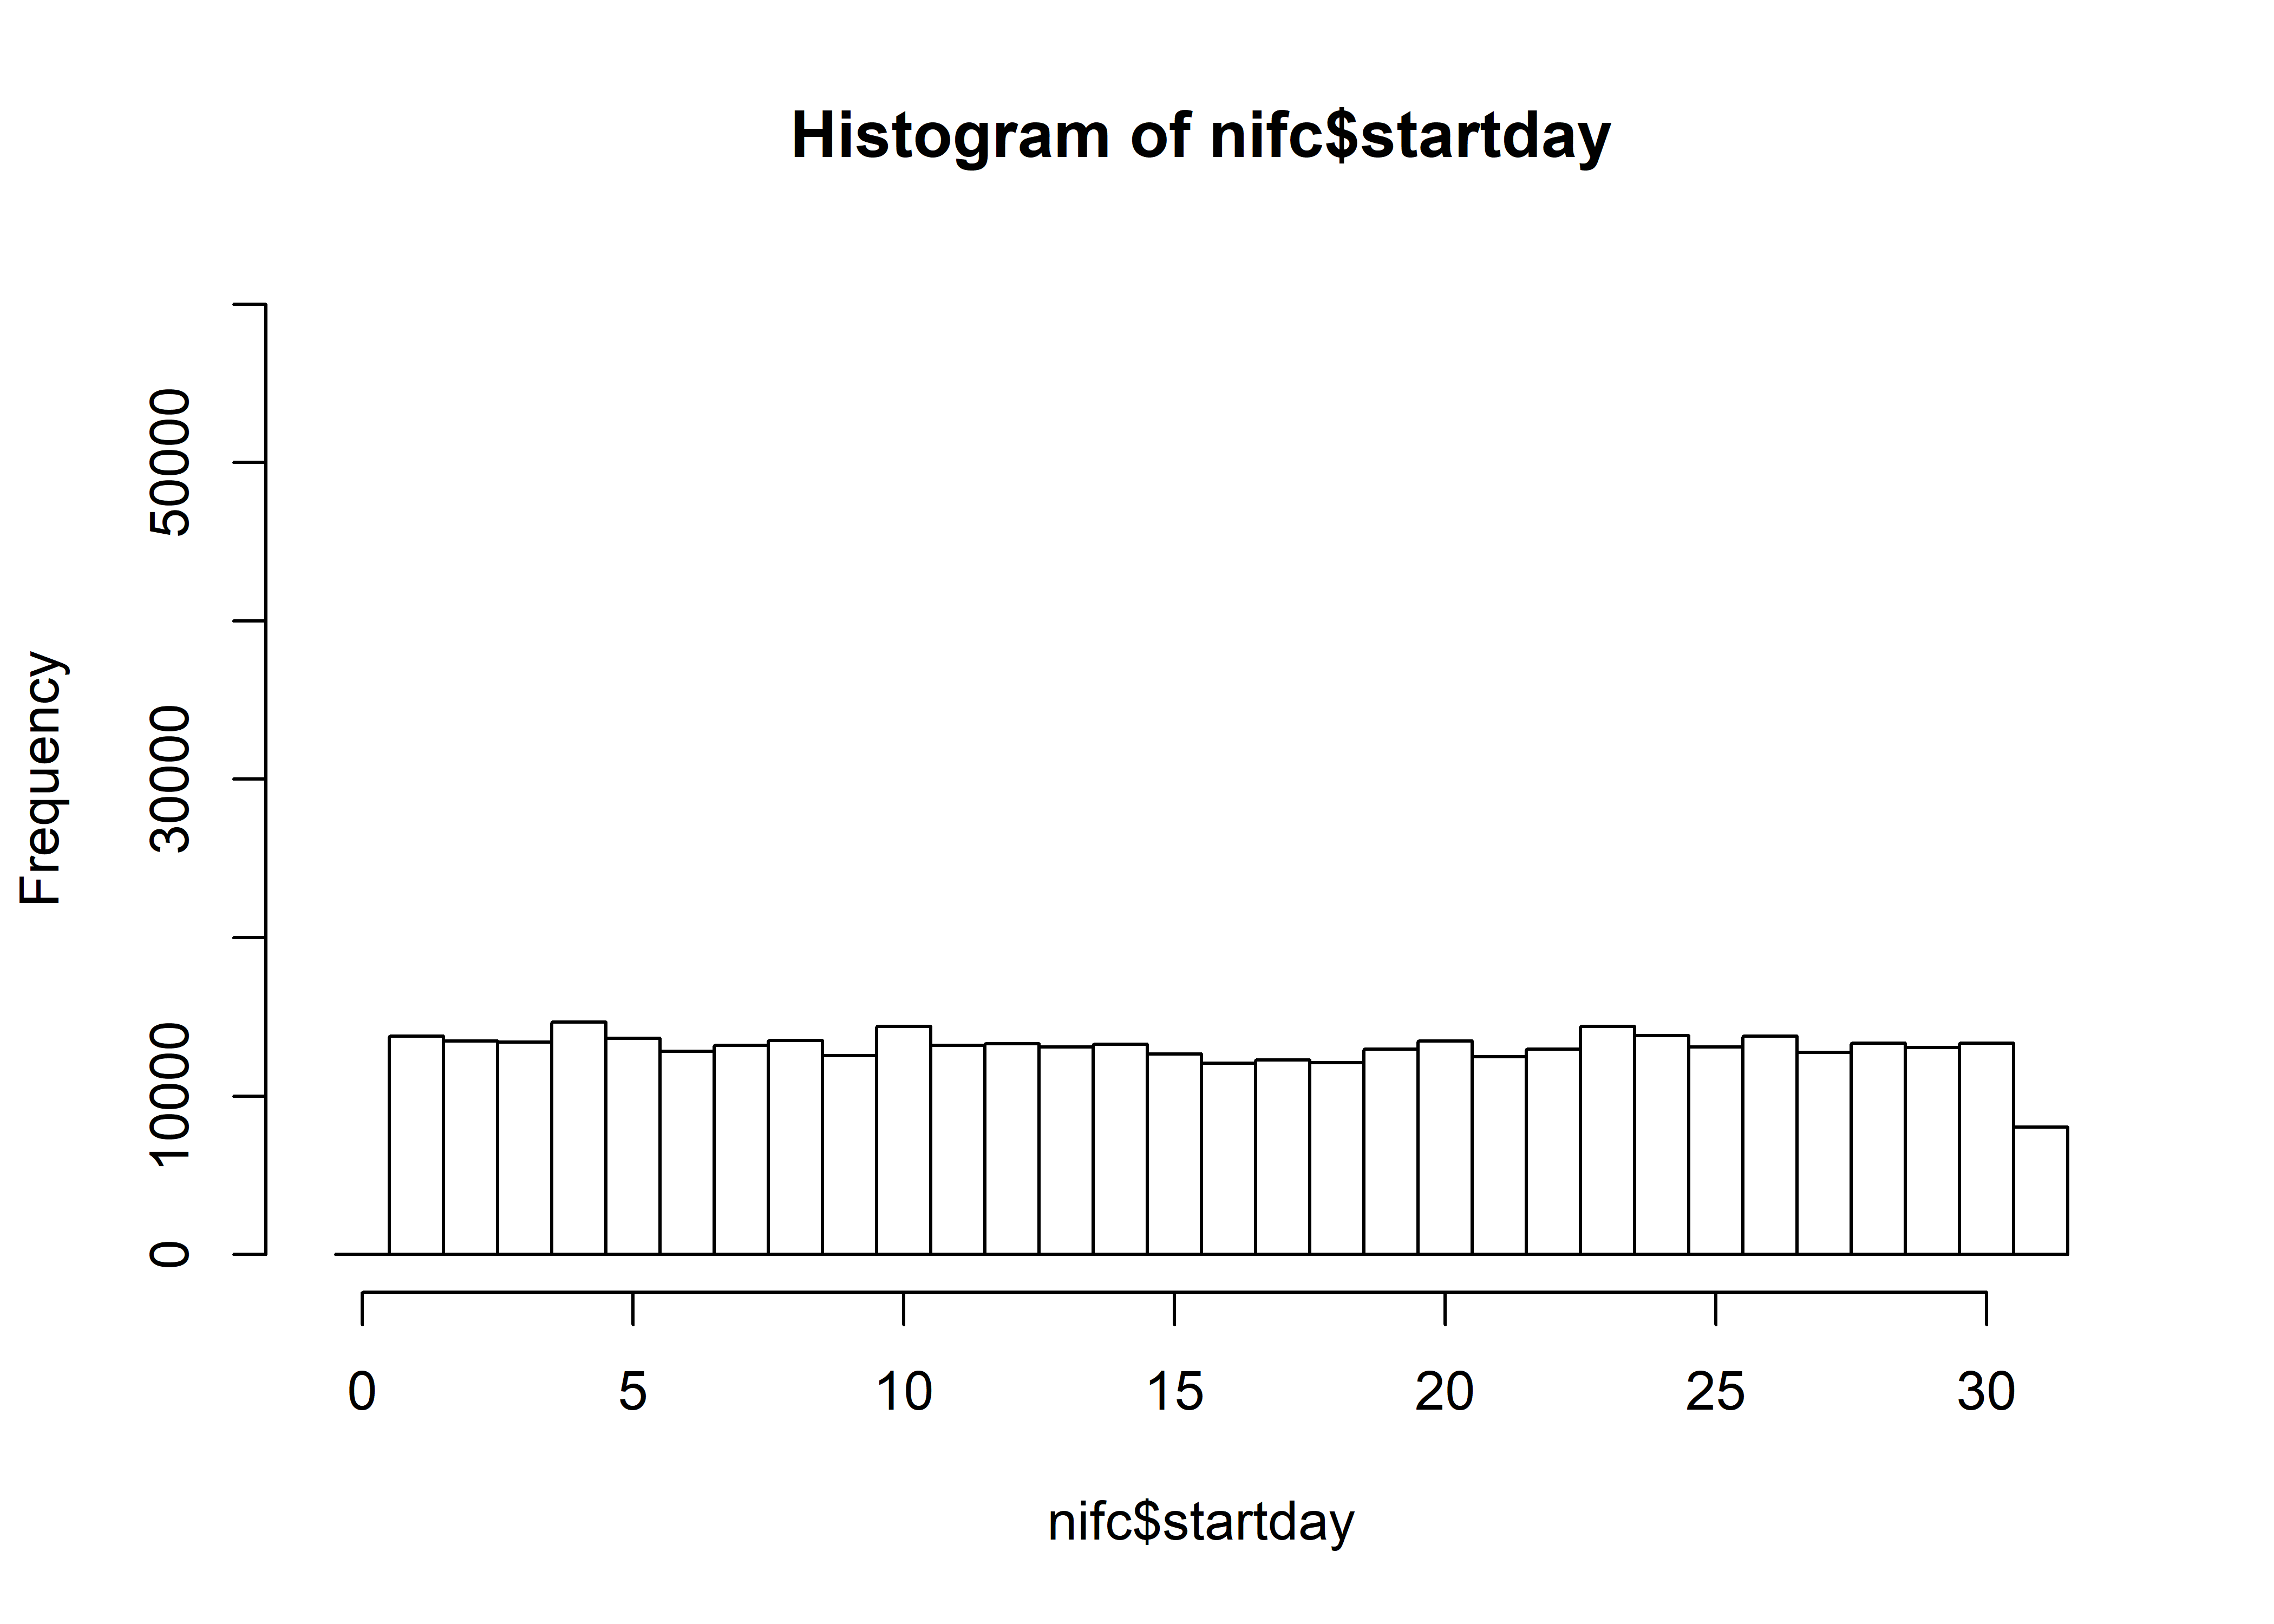
hist(nifc$startday[nifc$CAUSE==1], breaks=seq(-0.5,31.5,by=1), freq=-TRUE, ylim=c(0,30000),
  main="nifc Natural")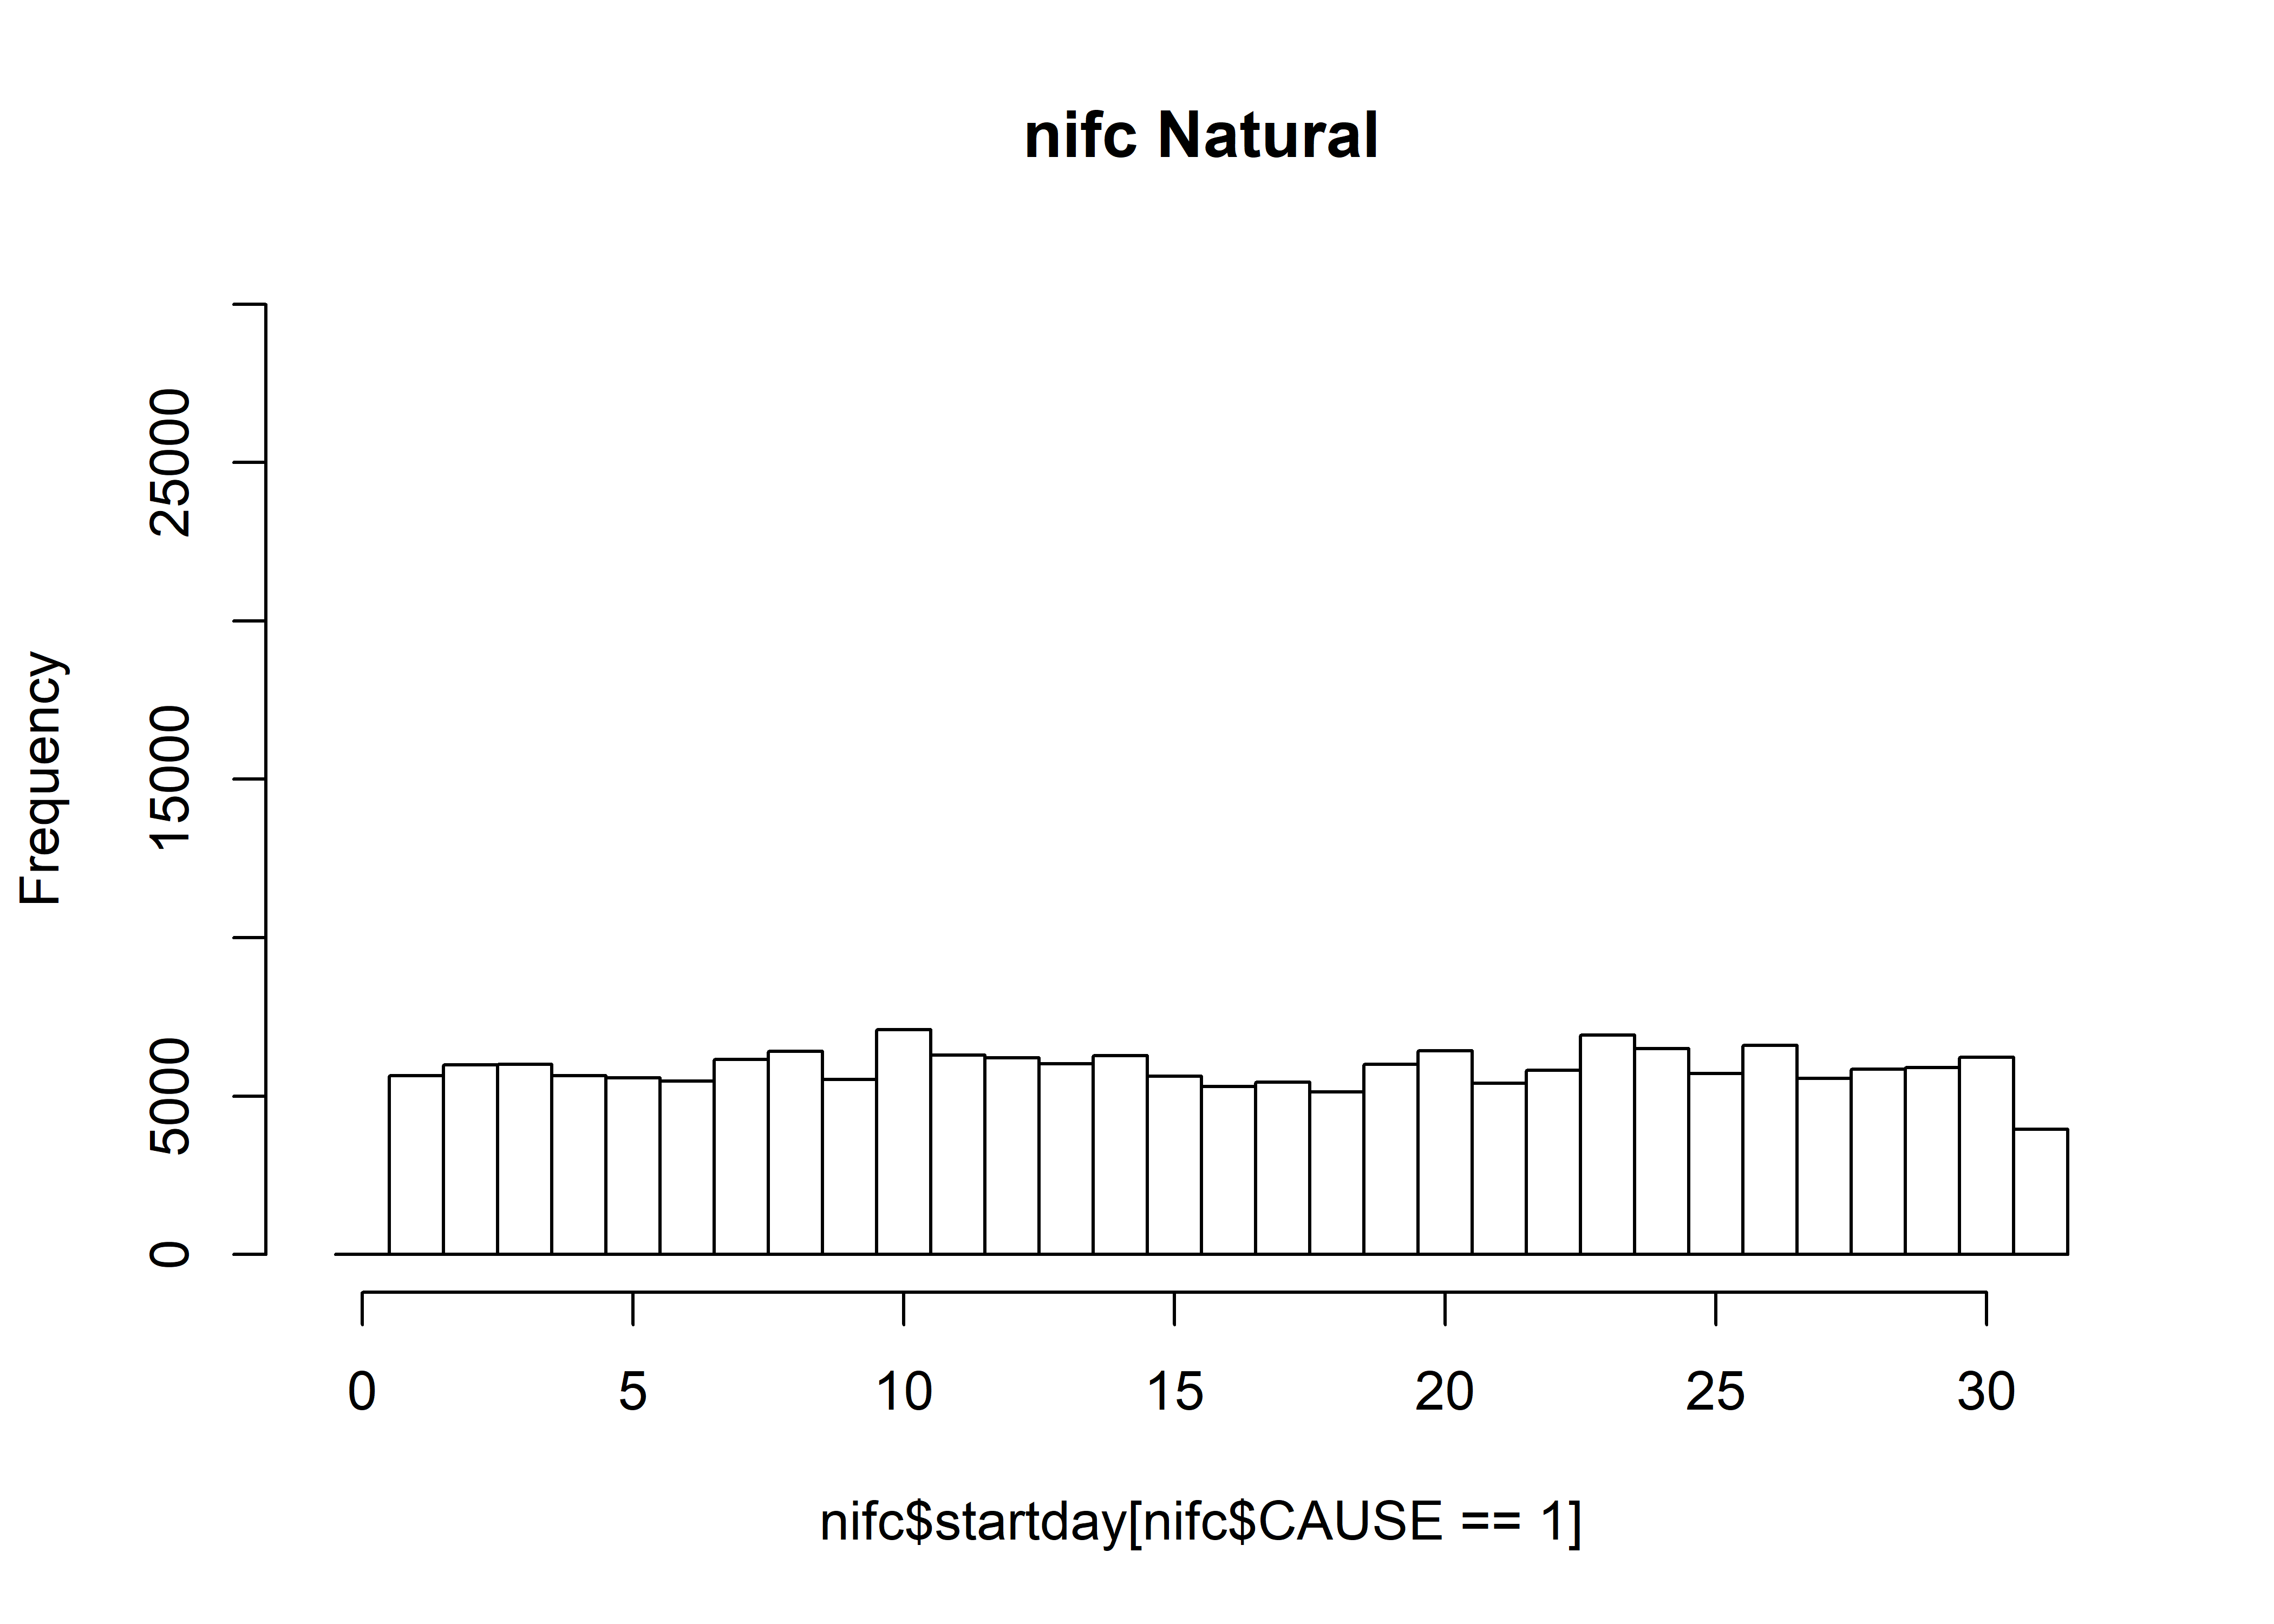
hist(nifc$startday[nifc$CAUSE==2], breaks=seq(-0.5,31.5,by=1), freq=-TRUE, ylim=c(0,30000),
  main="nifc Human")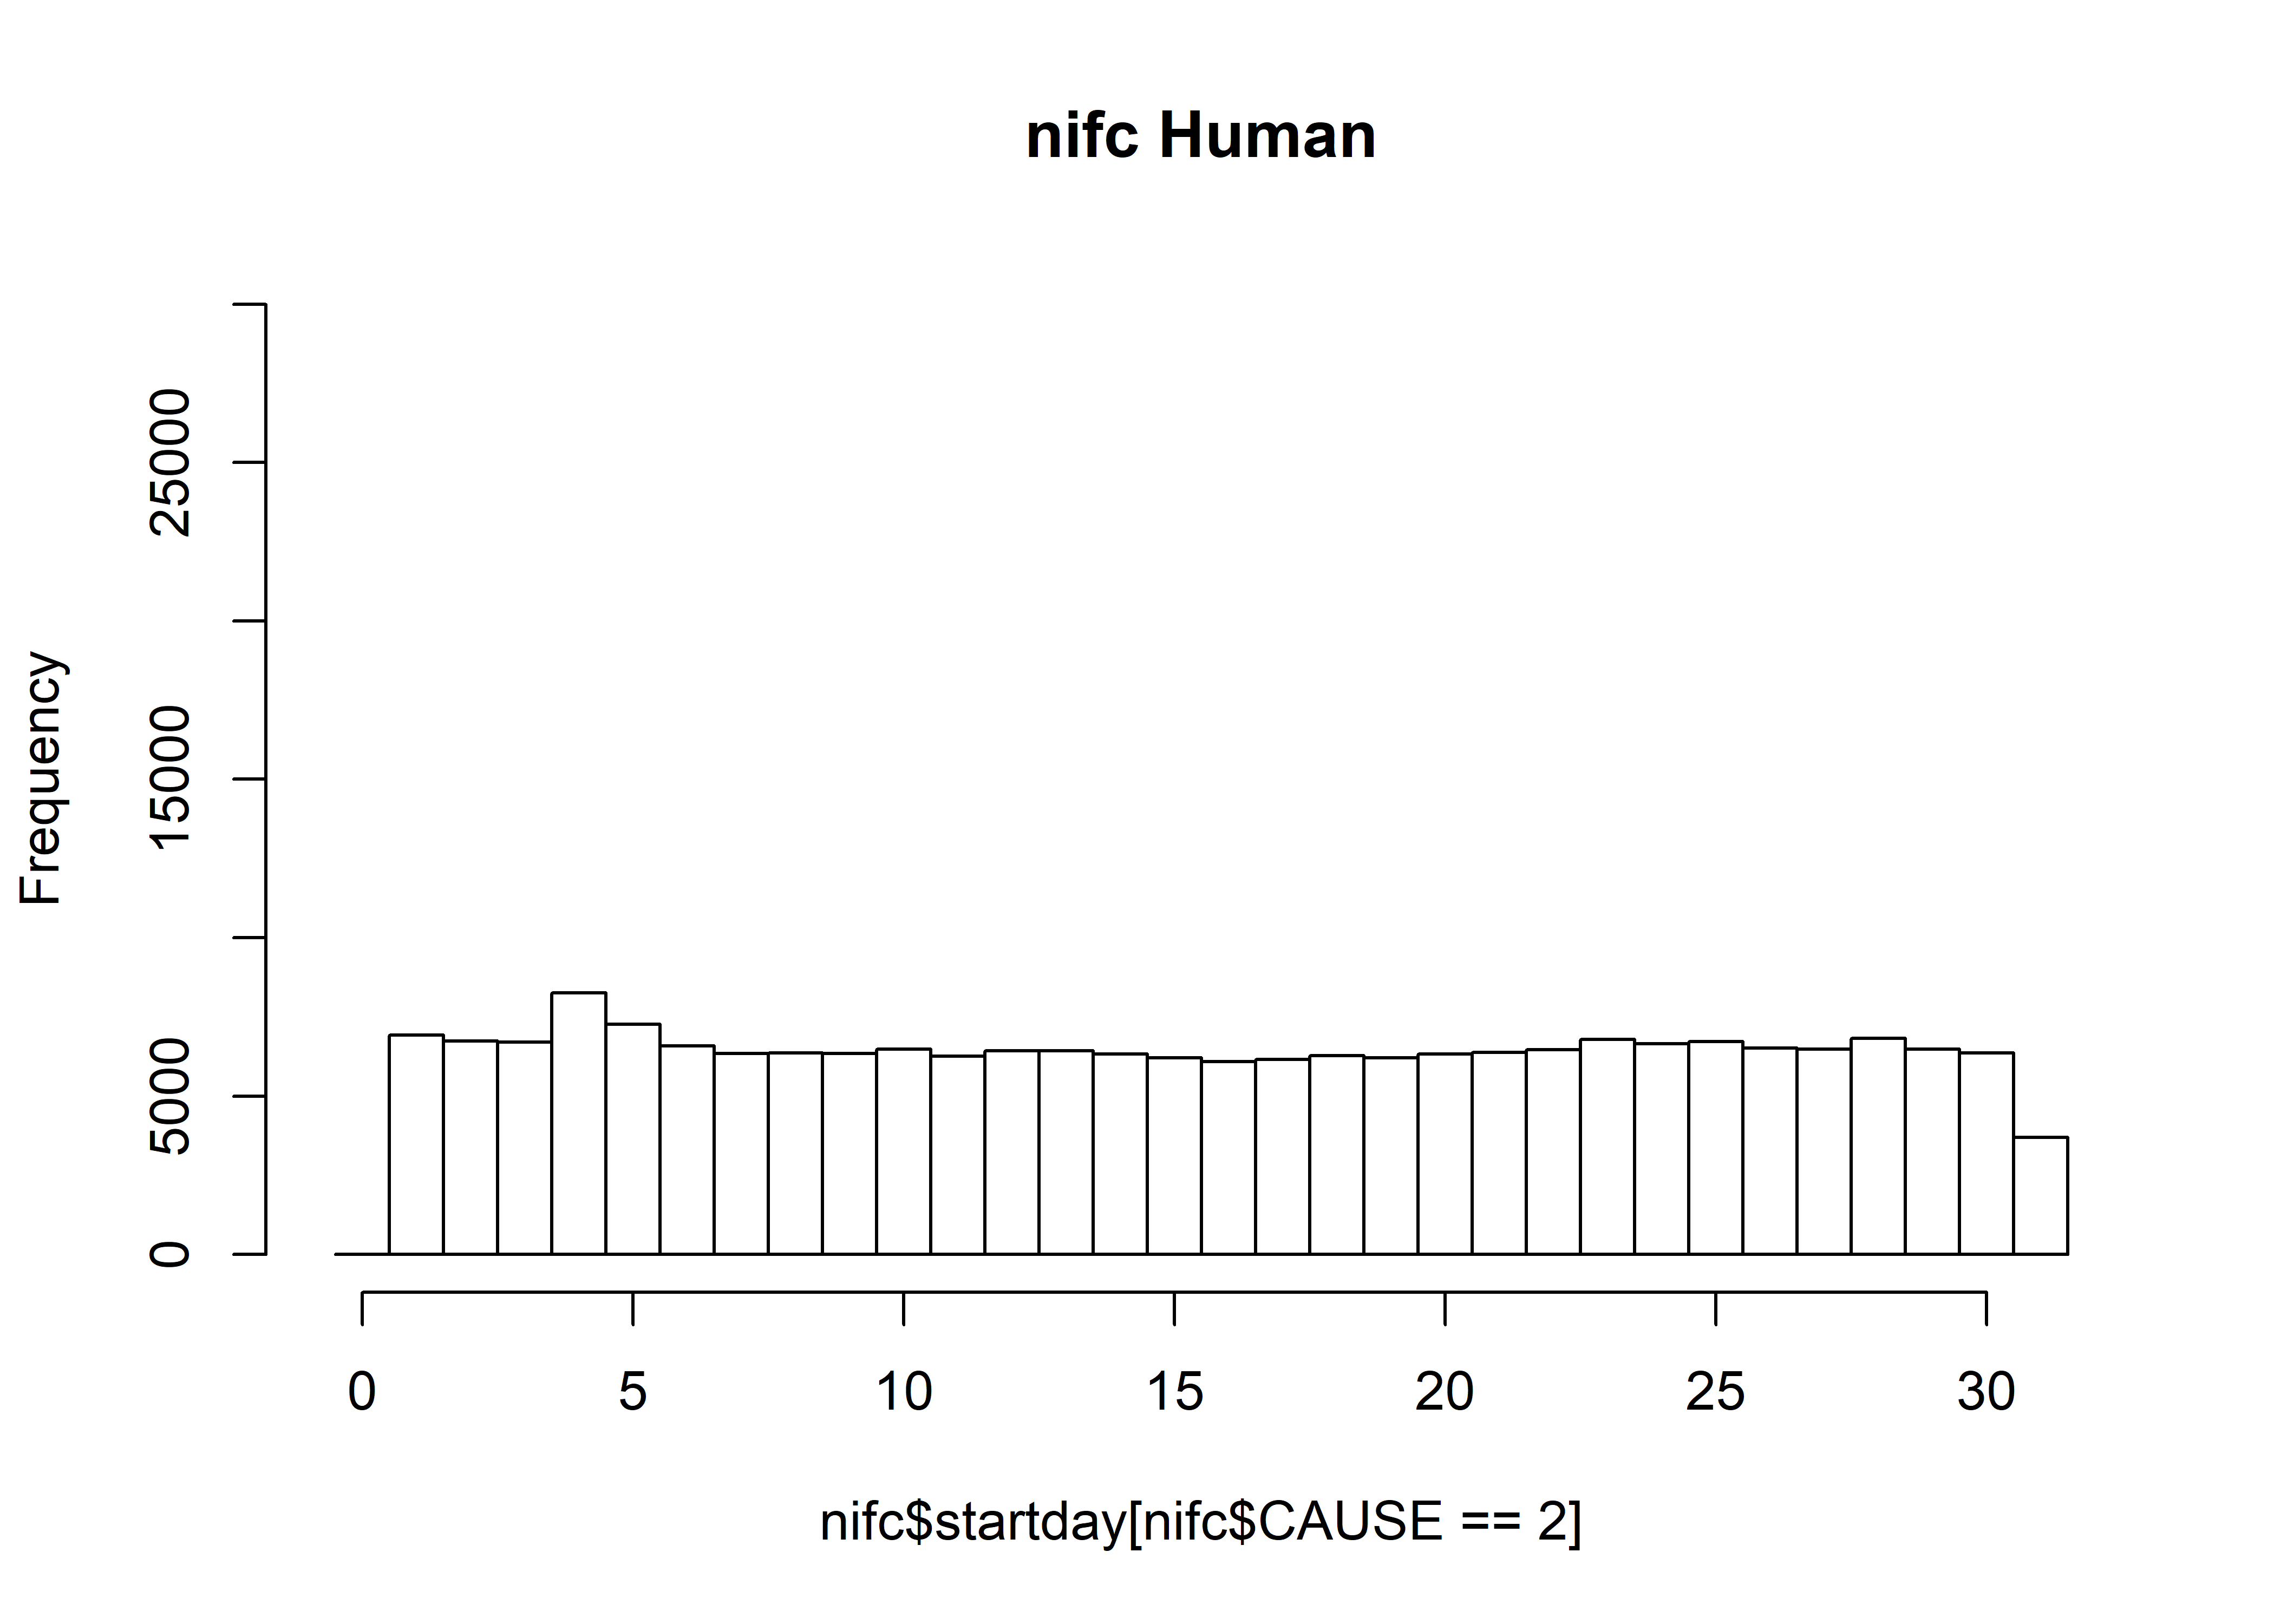
Early vs late
length(nifc$startday)## [1] 405124nifc$startday2 <- ifelse(nifc$startday <= 9, nifc$startday2 <- "1-9",
nifc$startday2 <- "10-31")
length(nifc$startday2)## [1] 405124table(nifc$startday2)##
## 1-9 10-31
## 121041 283895nifc.table <- table(nifc$YEAR, nifc$startday2)
nifc.year <- as.integer(row.names(nifc.table))
nifc.ratio <- nifc.table[,1]/nifc.table[,2]
mosaicplot(nifc.table, color=c(3,4), cex.axis=0.6, las=3, main="Start Day in Month by Year")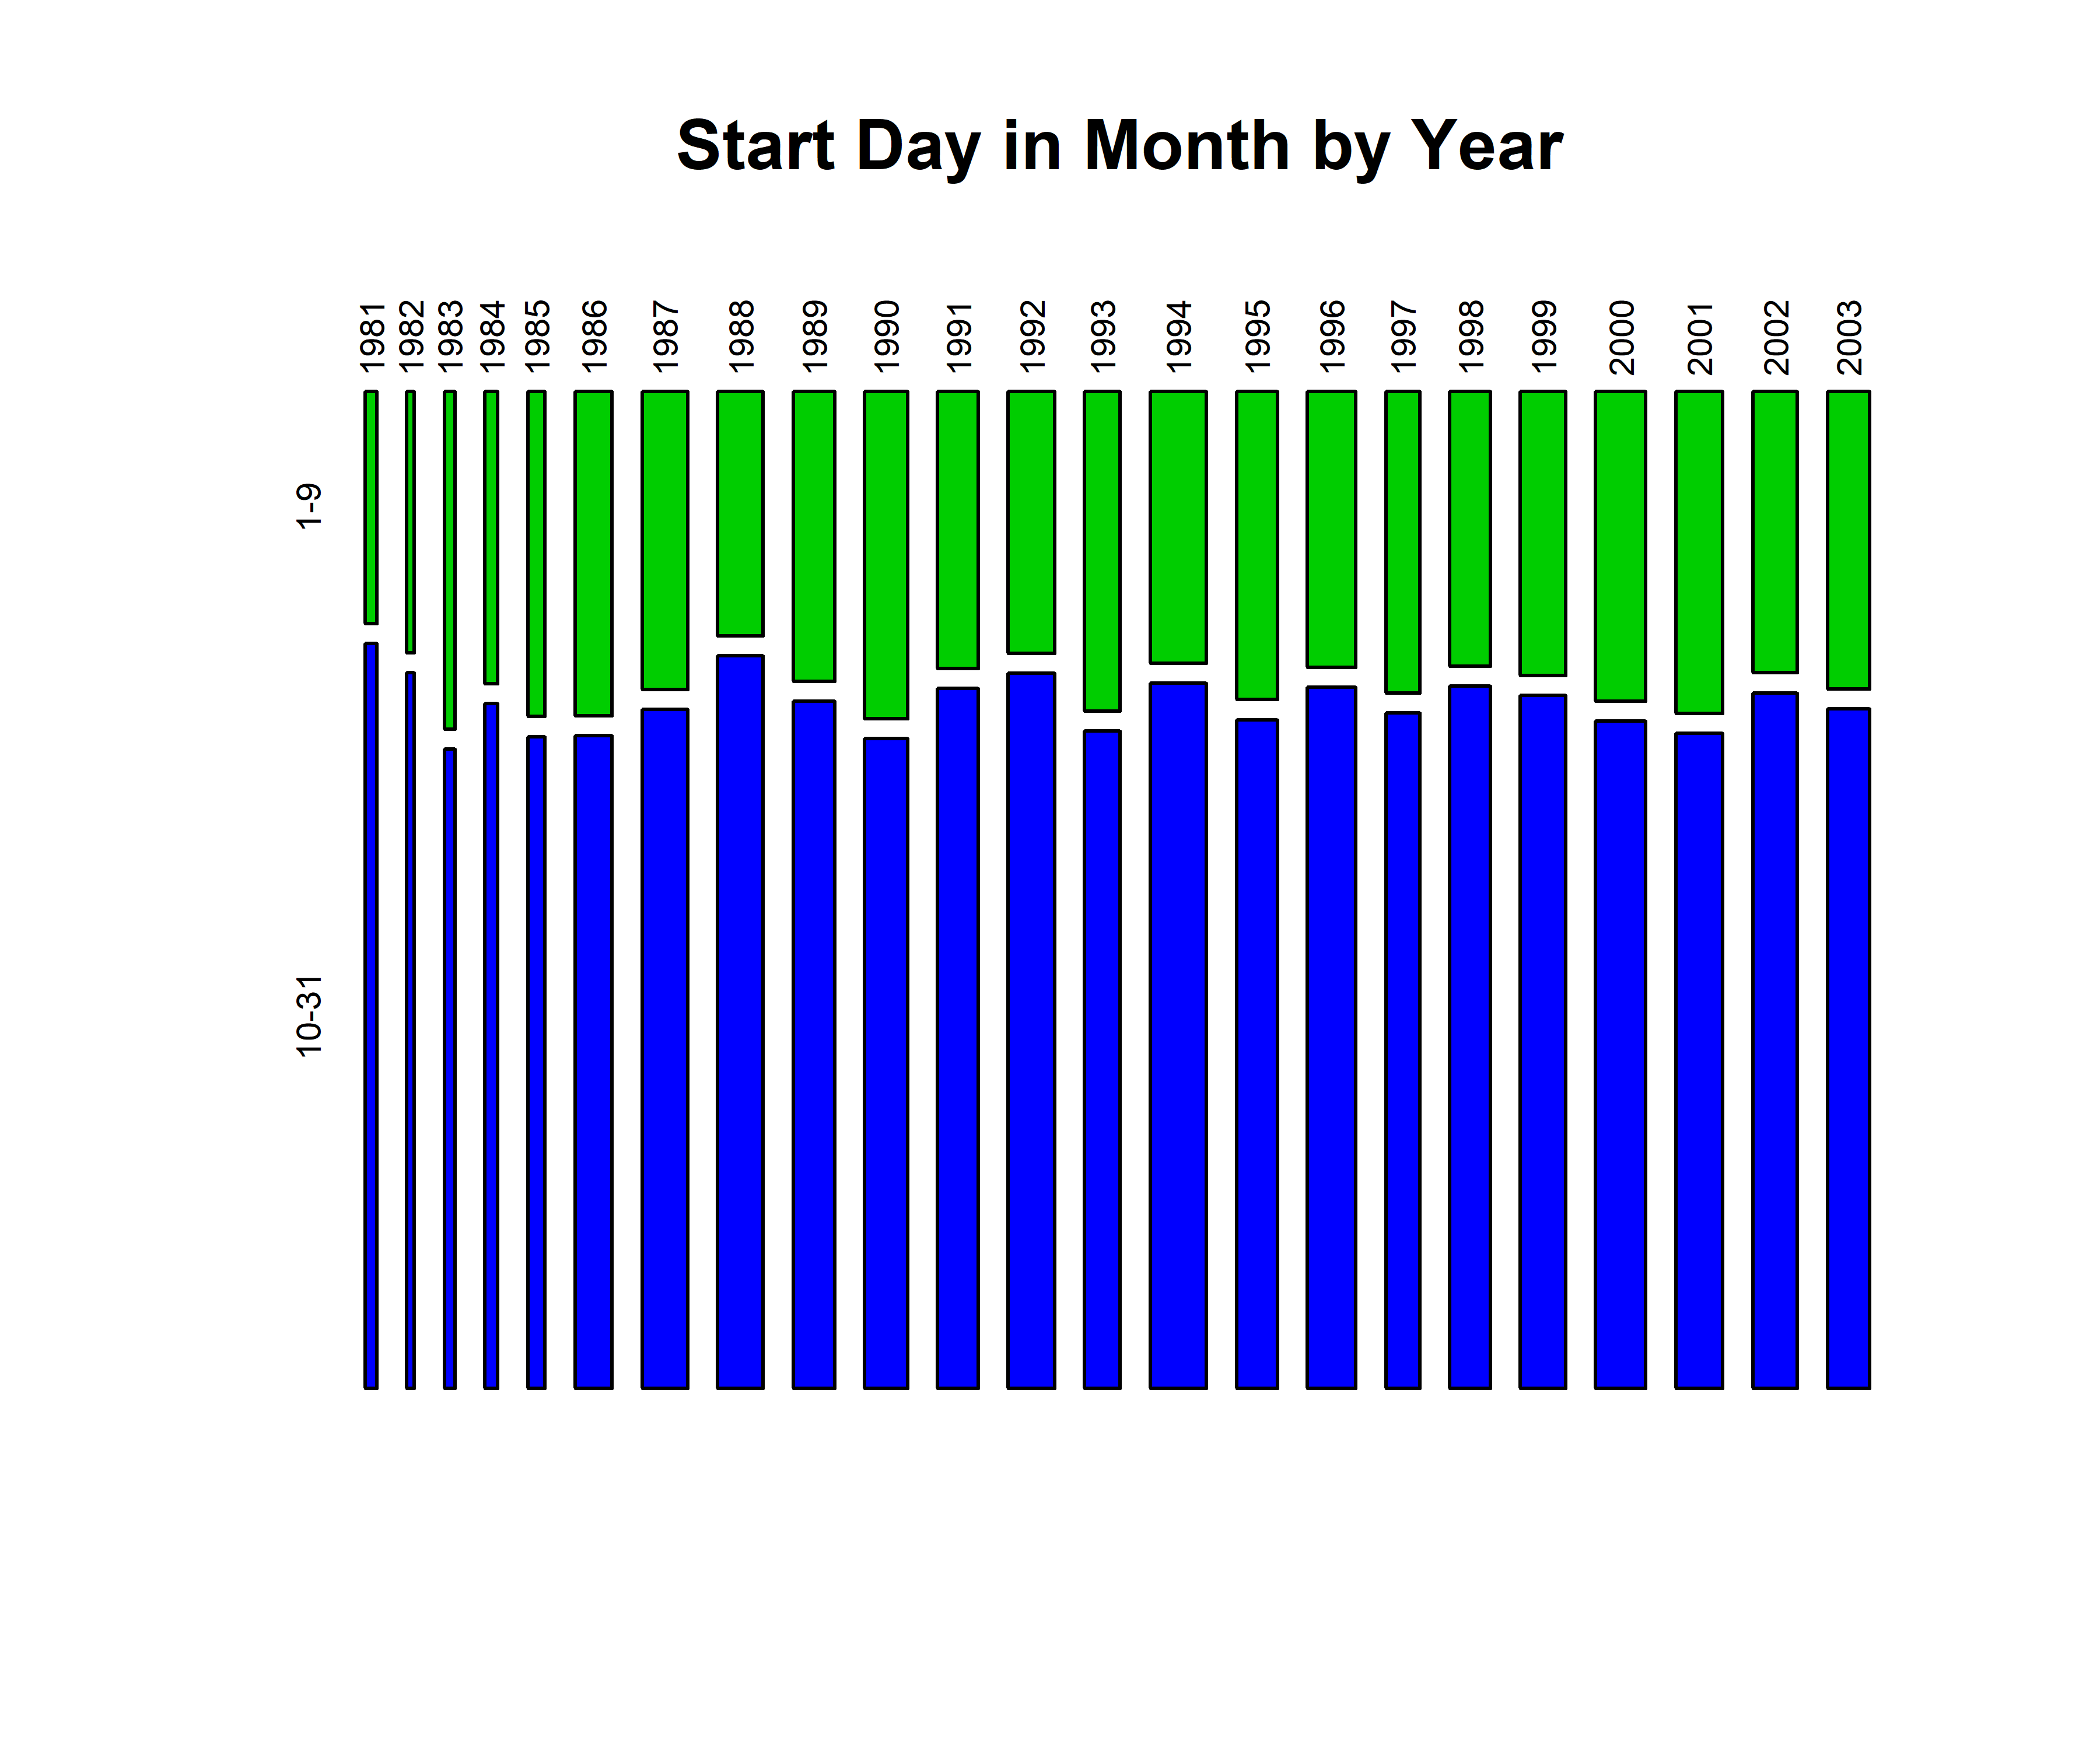
plot(nifc.year, nifc.ratio, pch=16, type="o", lwd=3, col="red")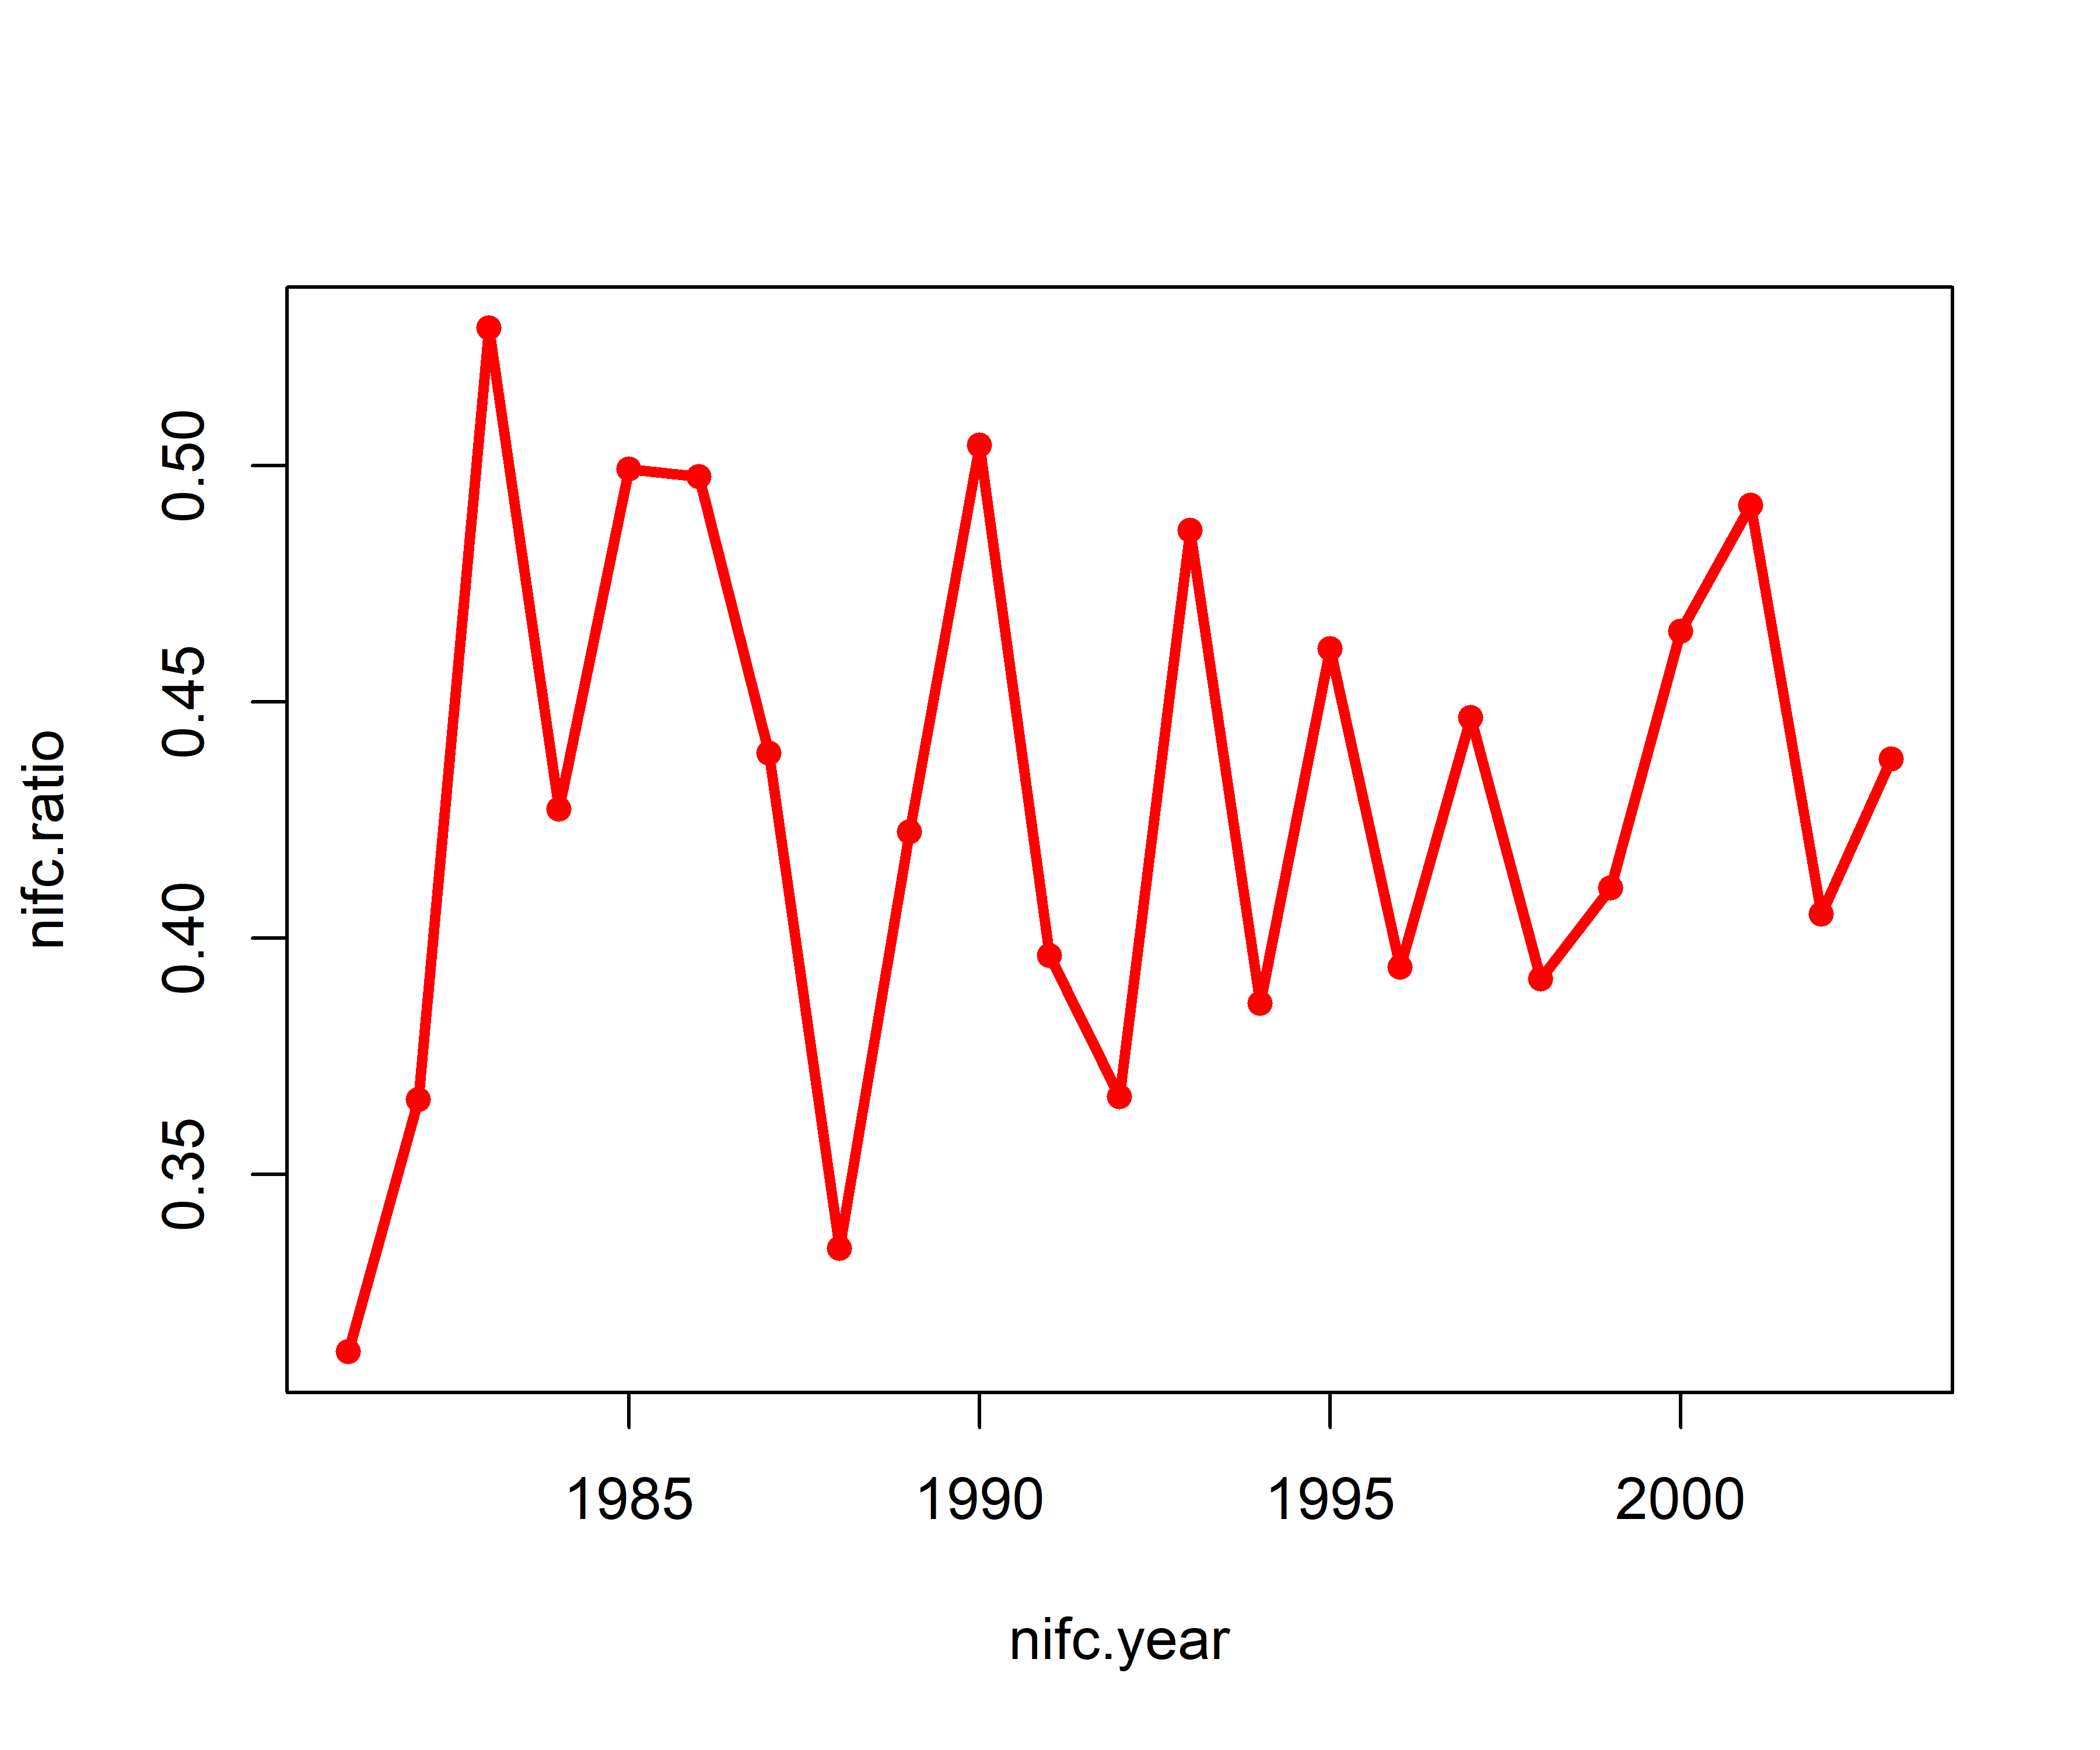
Mosaic plots
nifc.table.start <- table(nifc$startmon, nifc$startday2)
mosaicplot(nifc.table.start, color=c(3,4), cex.axis=0.6, las=3, main="Start Day in Month by Month")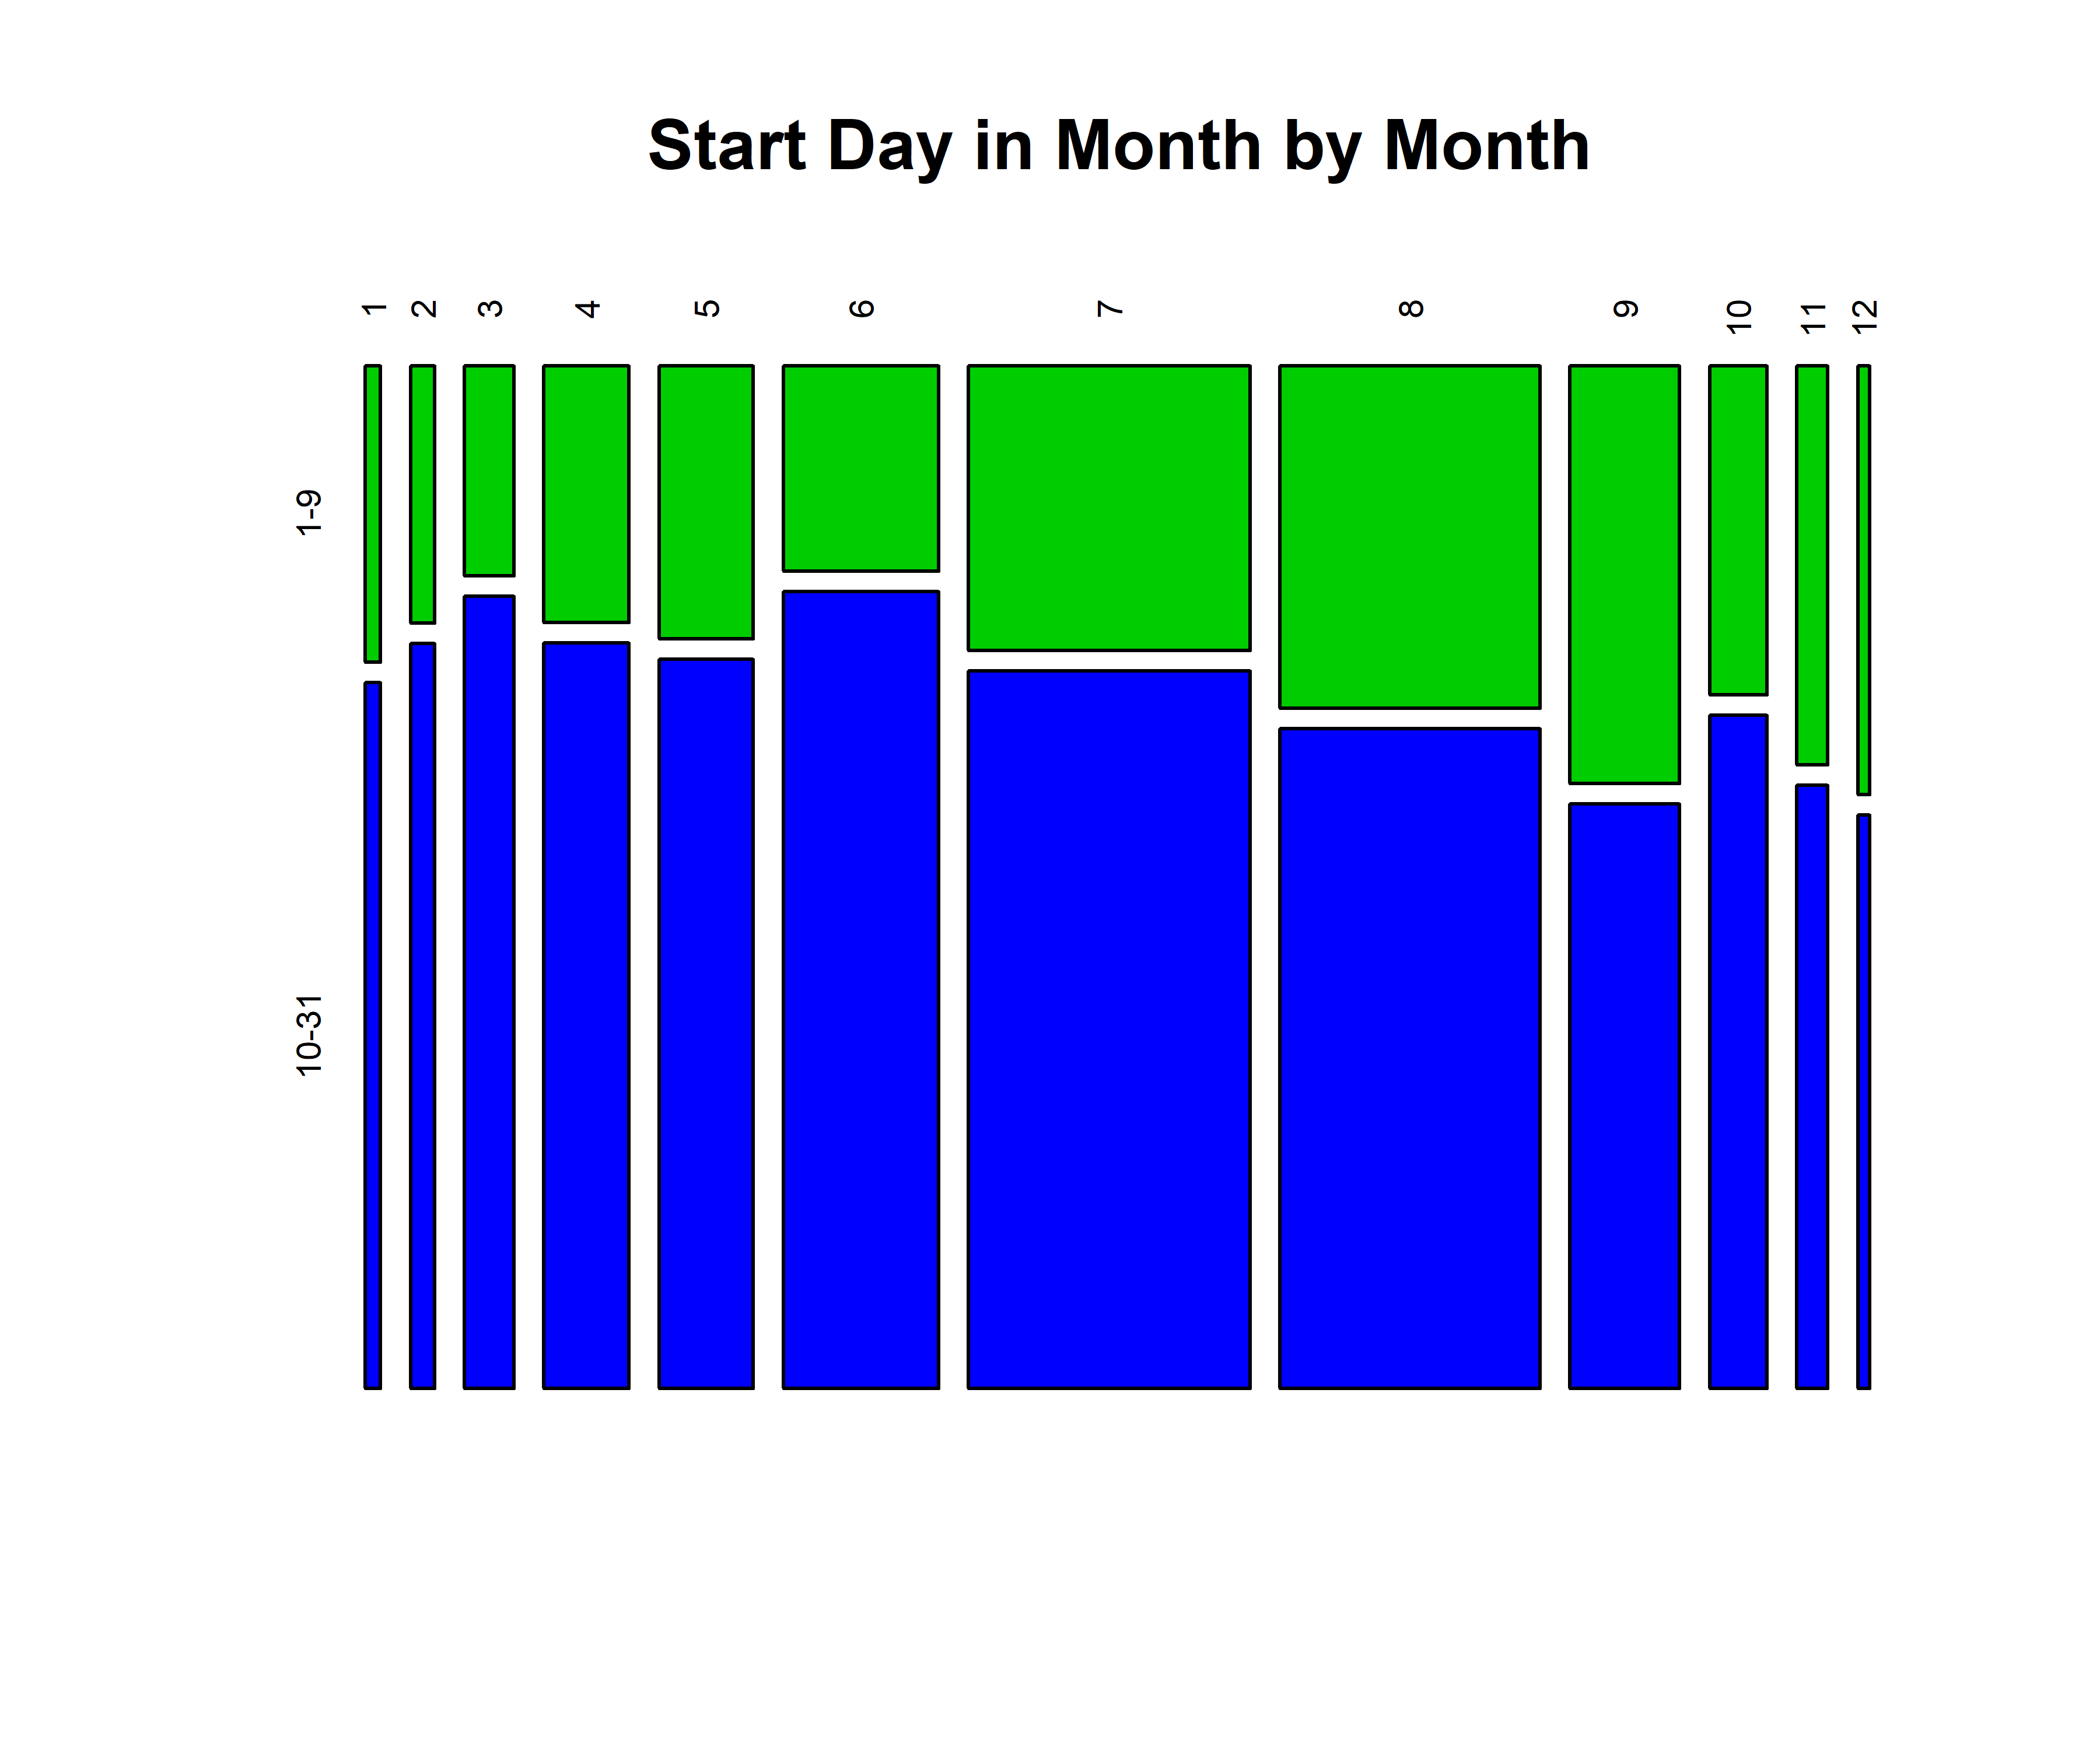
nifc.tablemon <- table(nifc$YEAR, nifc$startmon)
mosaicplot(nifc.tablemon, color=monthcolors, cex.axis=0.6, las=3, main="All Fires")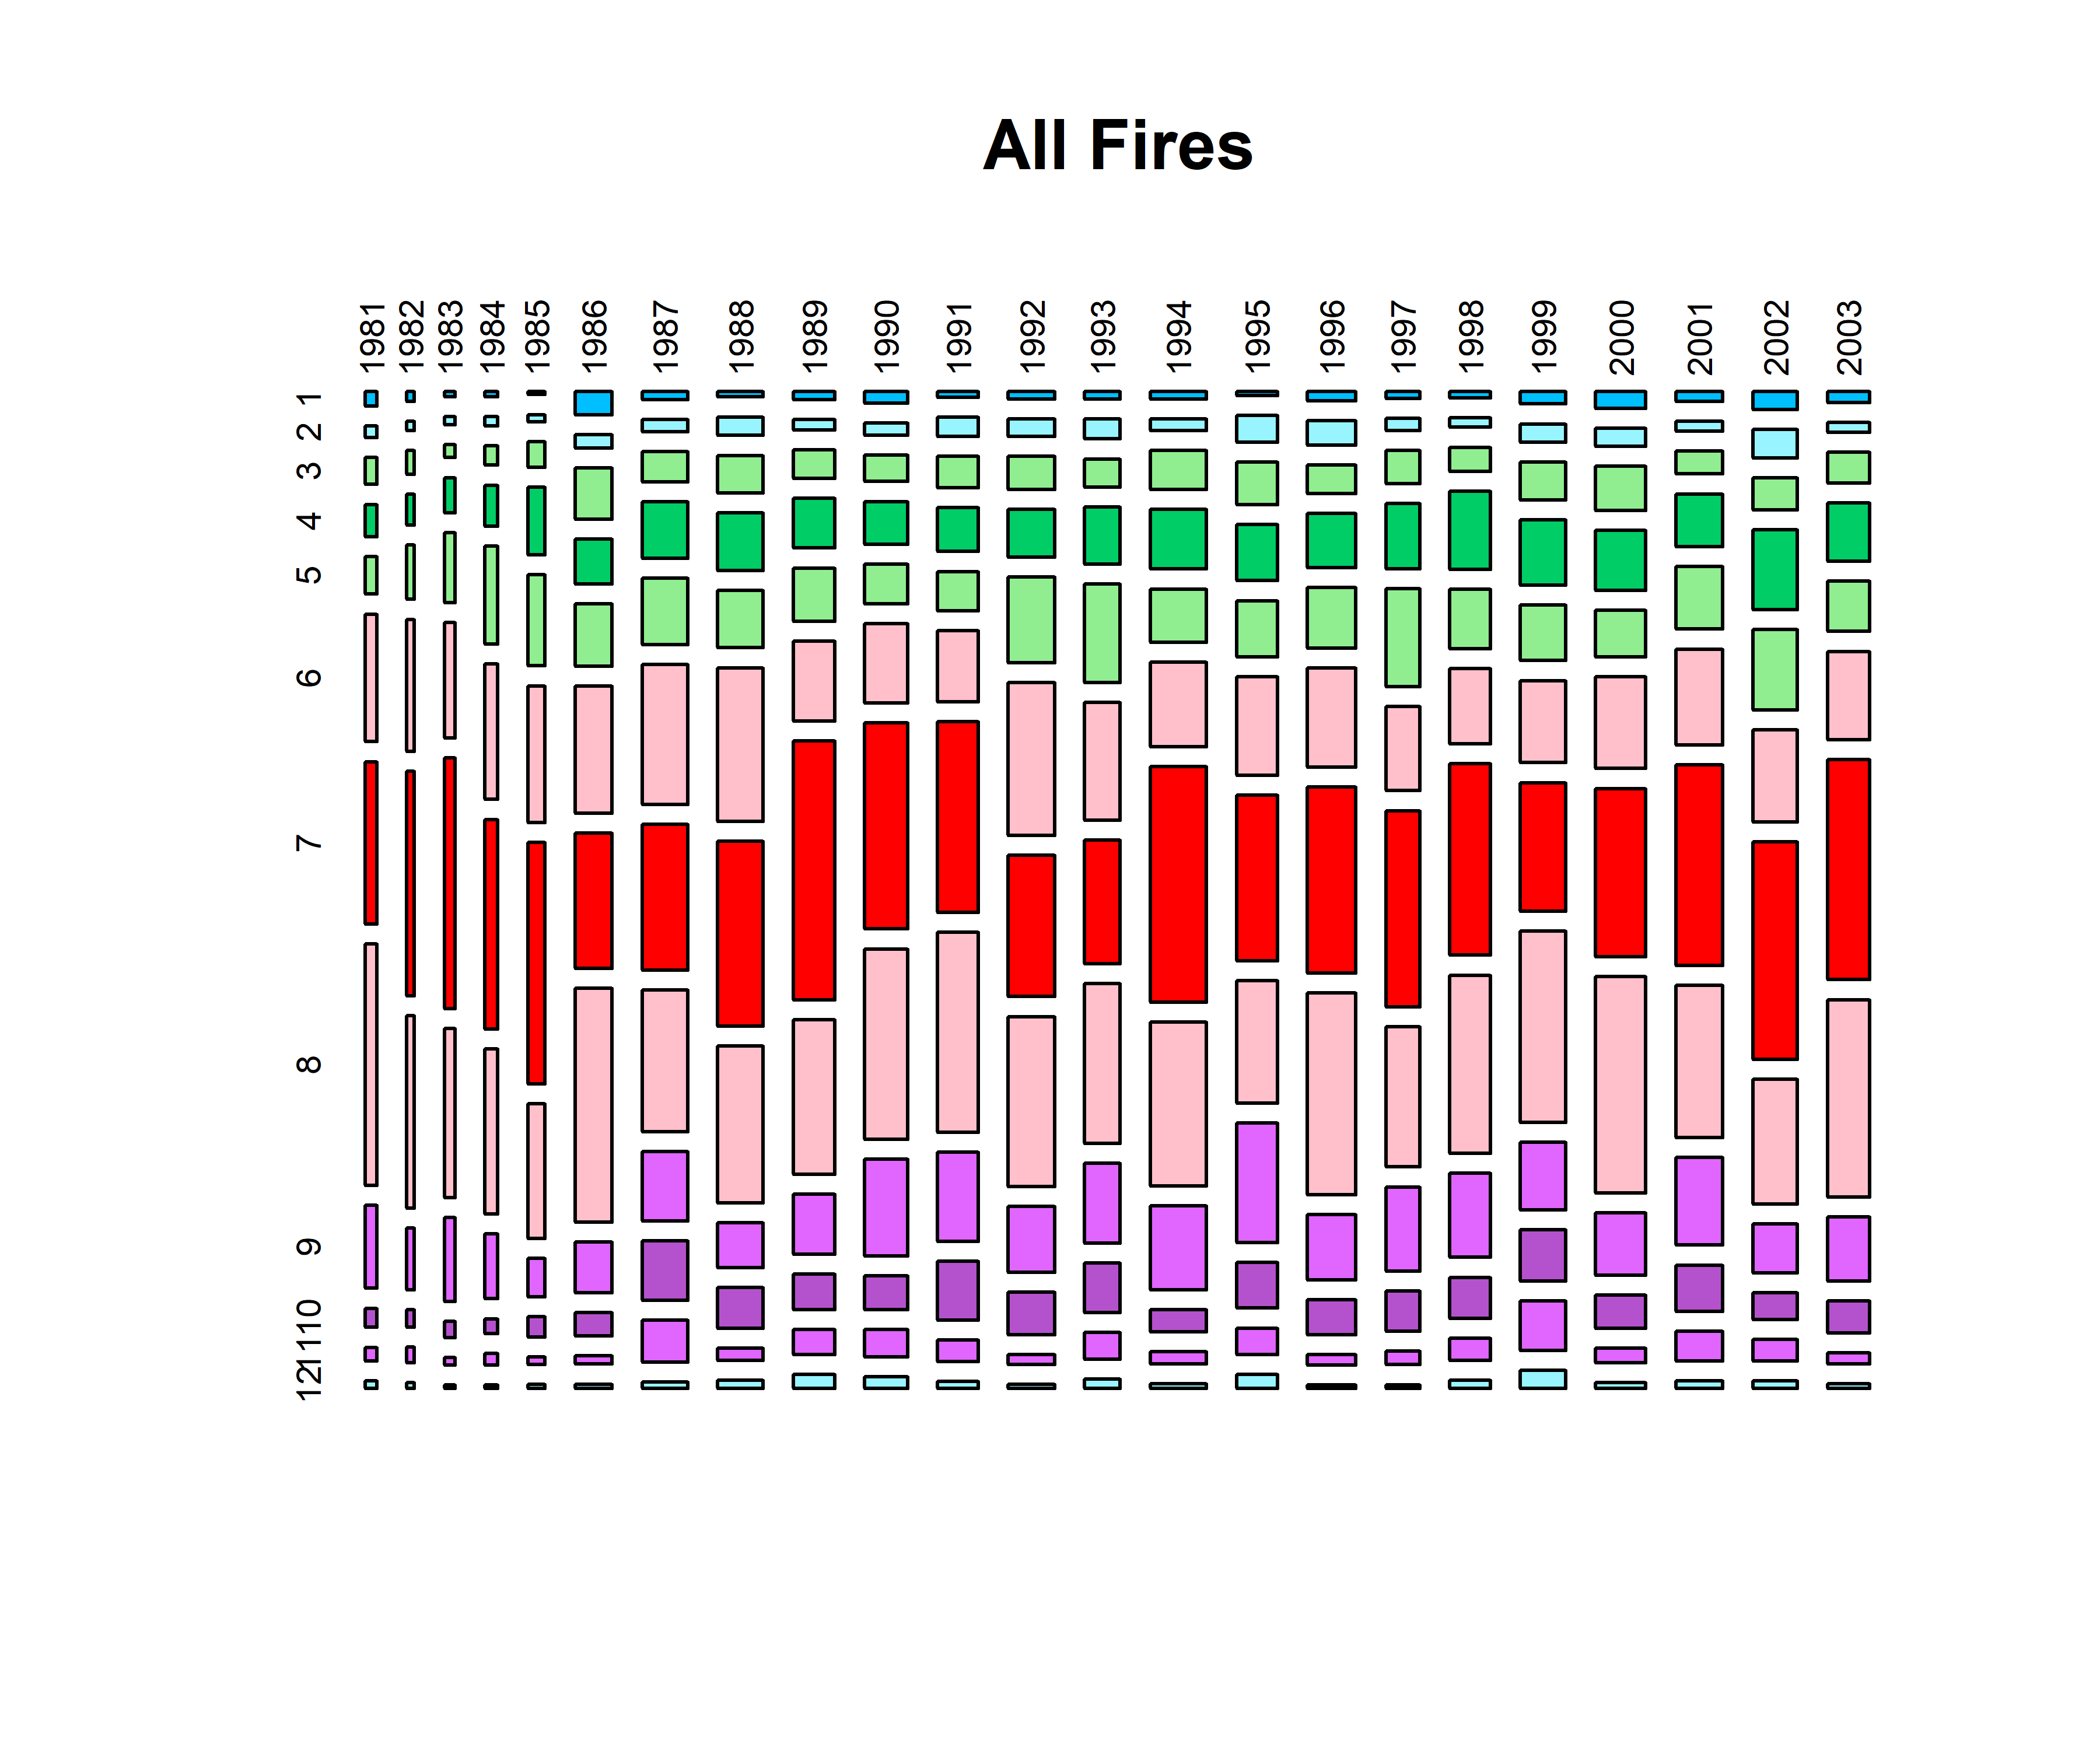
nifc.tablemon.n <- table(nifc$YEAR[nifc$CAUSE==1], nifc$startmon[nifc$CAUSE==1])
mosaicplot(nifc.tablemon.n, color=monthcolors, cex.axis=0.6, las=3, main="Natural Fires")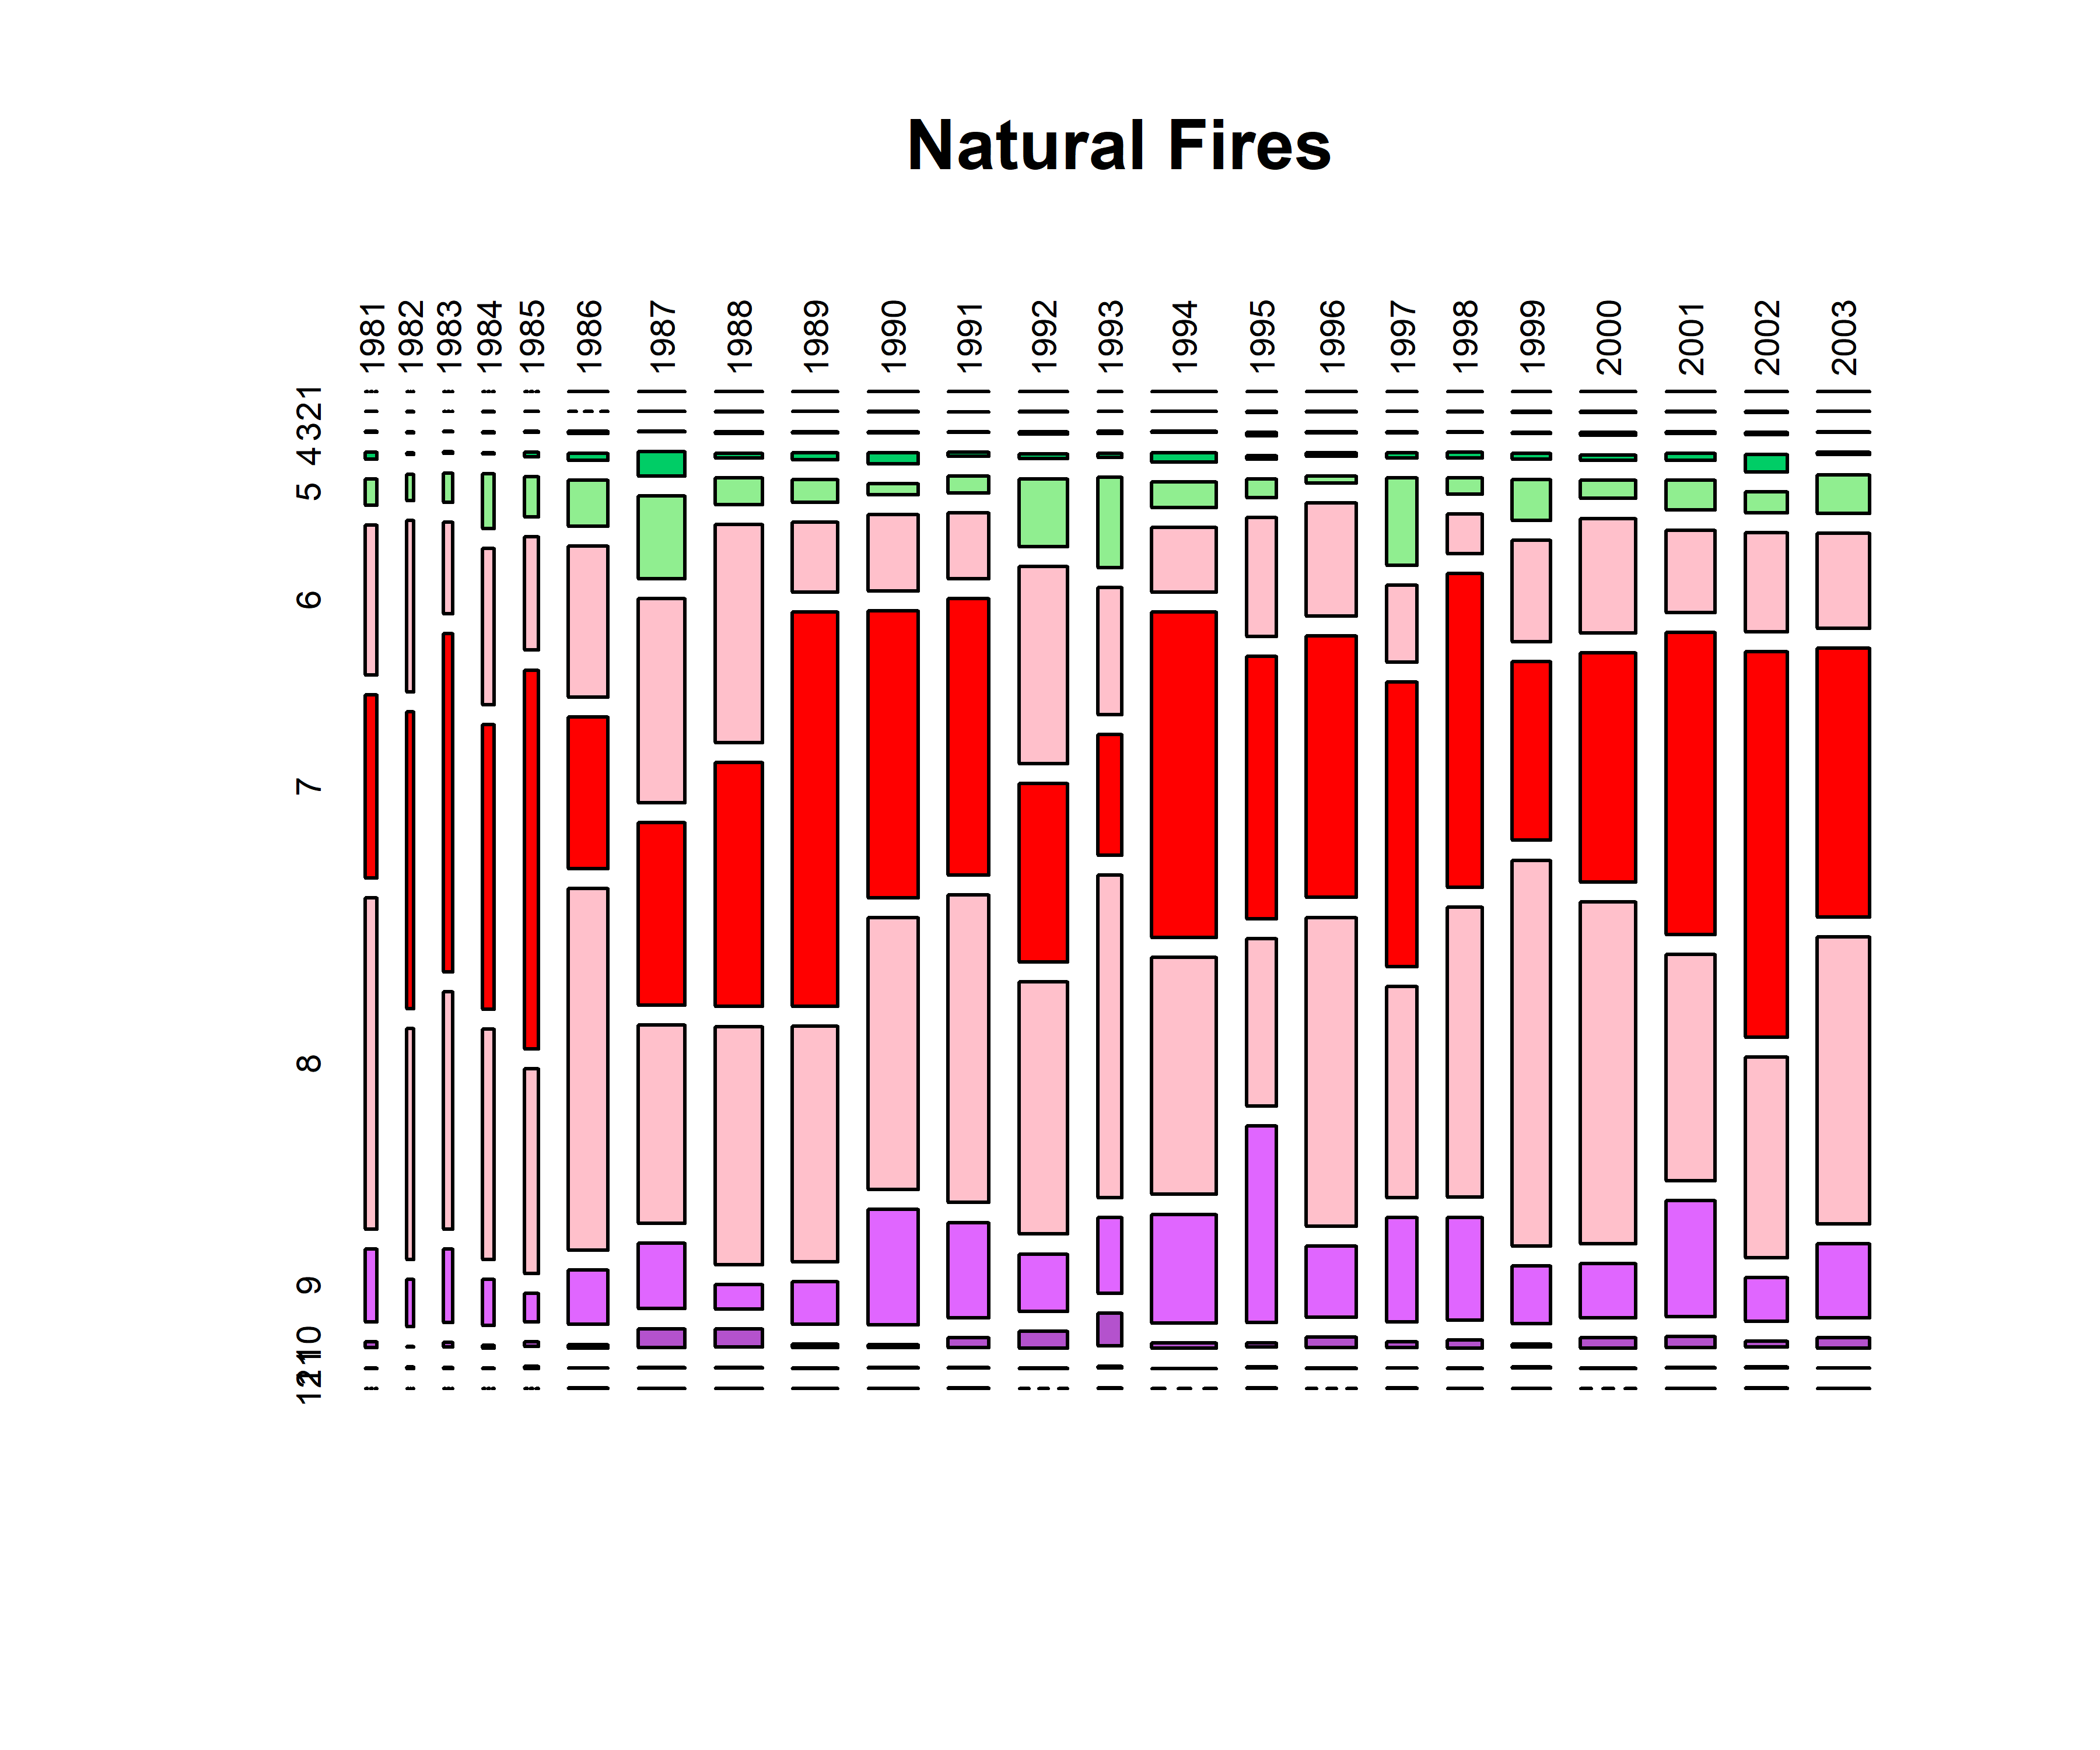
nifc.tablemon.h <- table(nifc$YEAR[nifc$CAUSE==2], nifc$startmon[nifc$CAUSE==2])
mosaicplot(nifc.tablemon.h, color=monthcolors, cex.axis=0.6, las=3, main="Human Fires")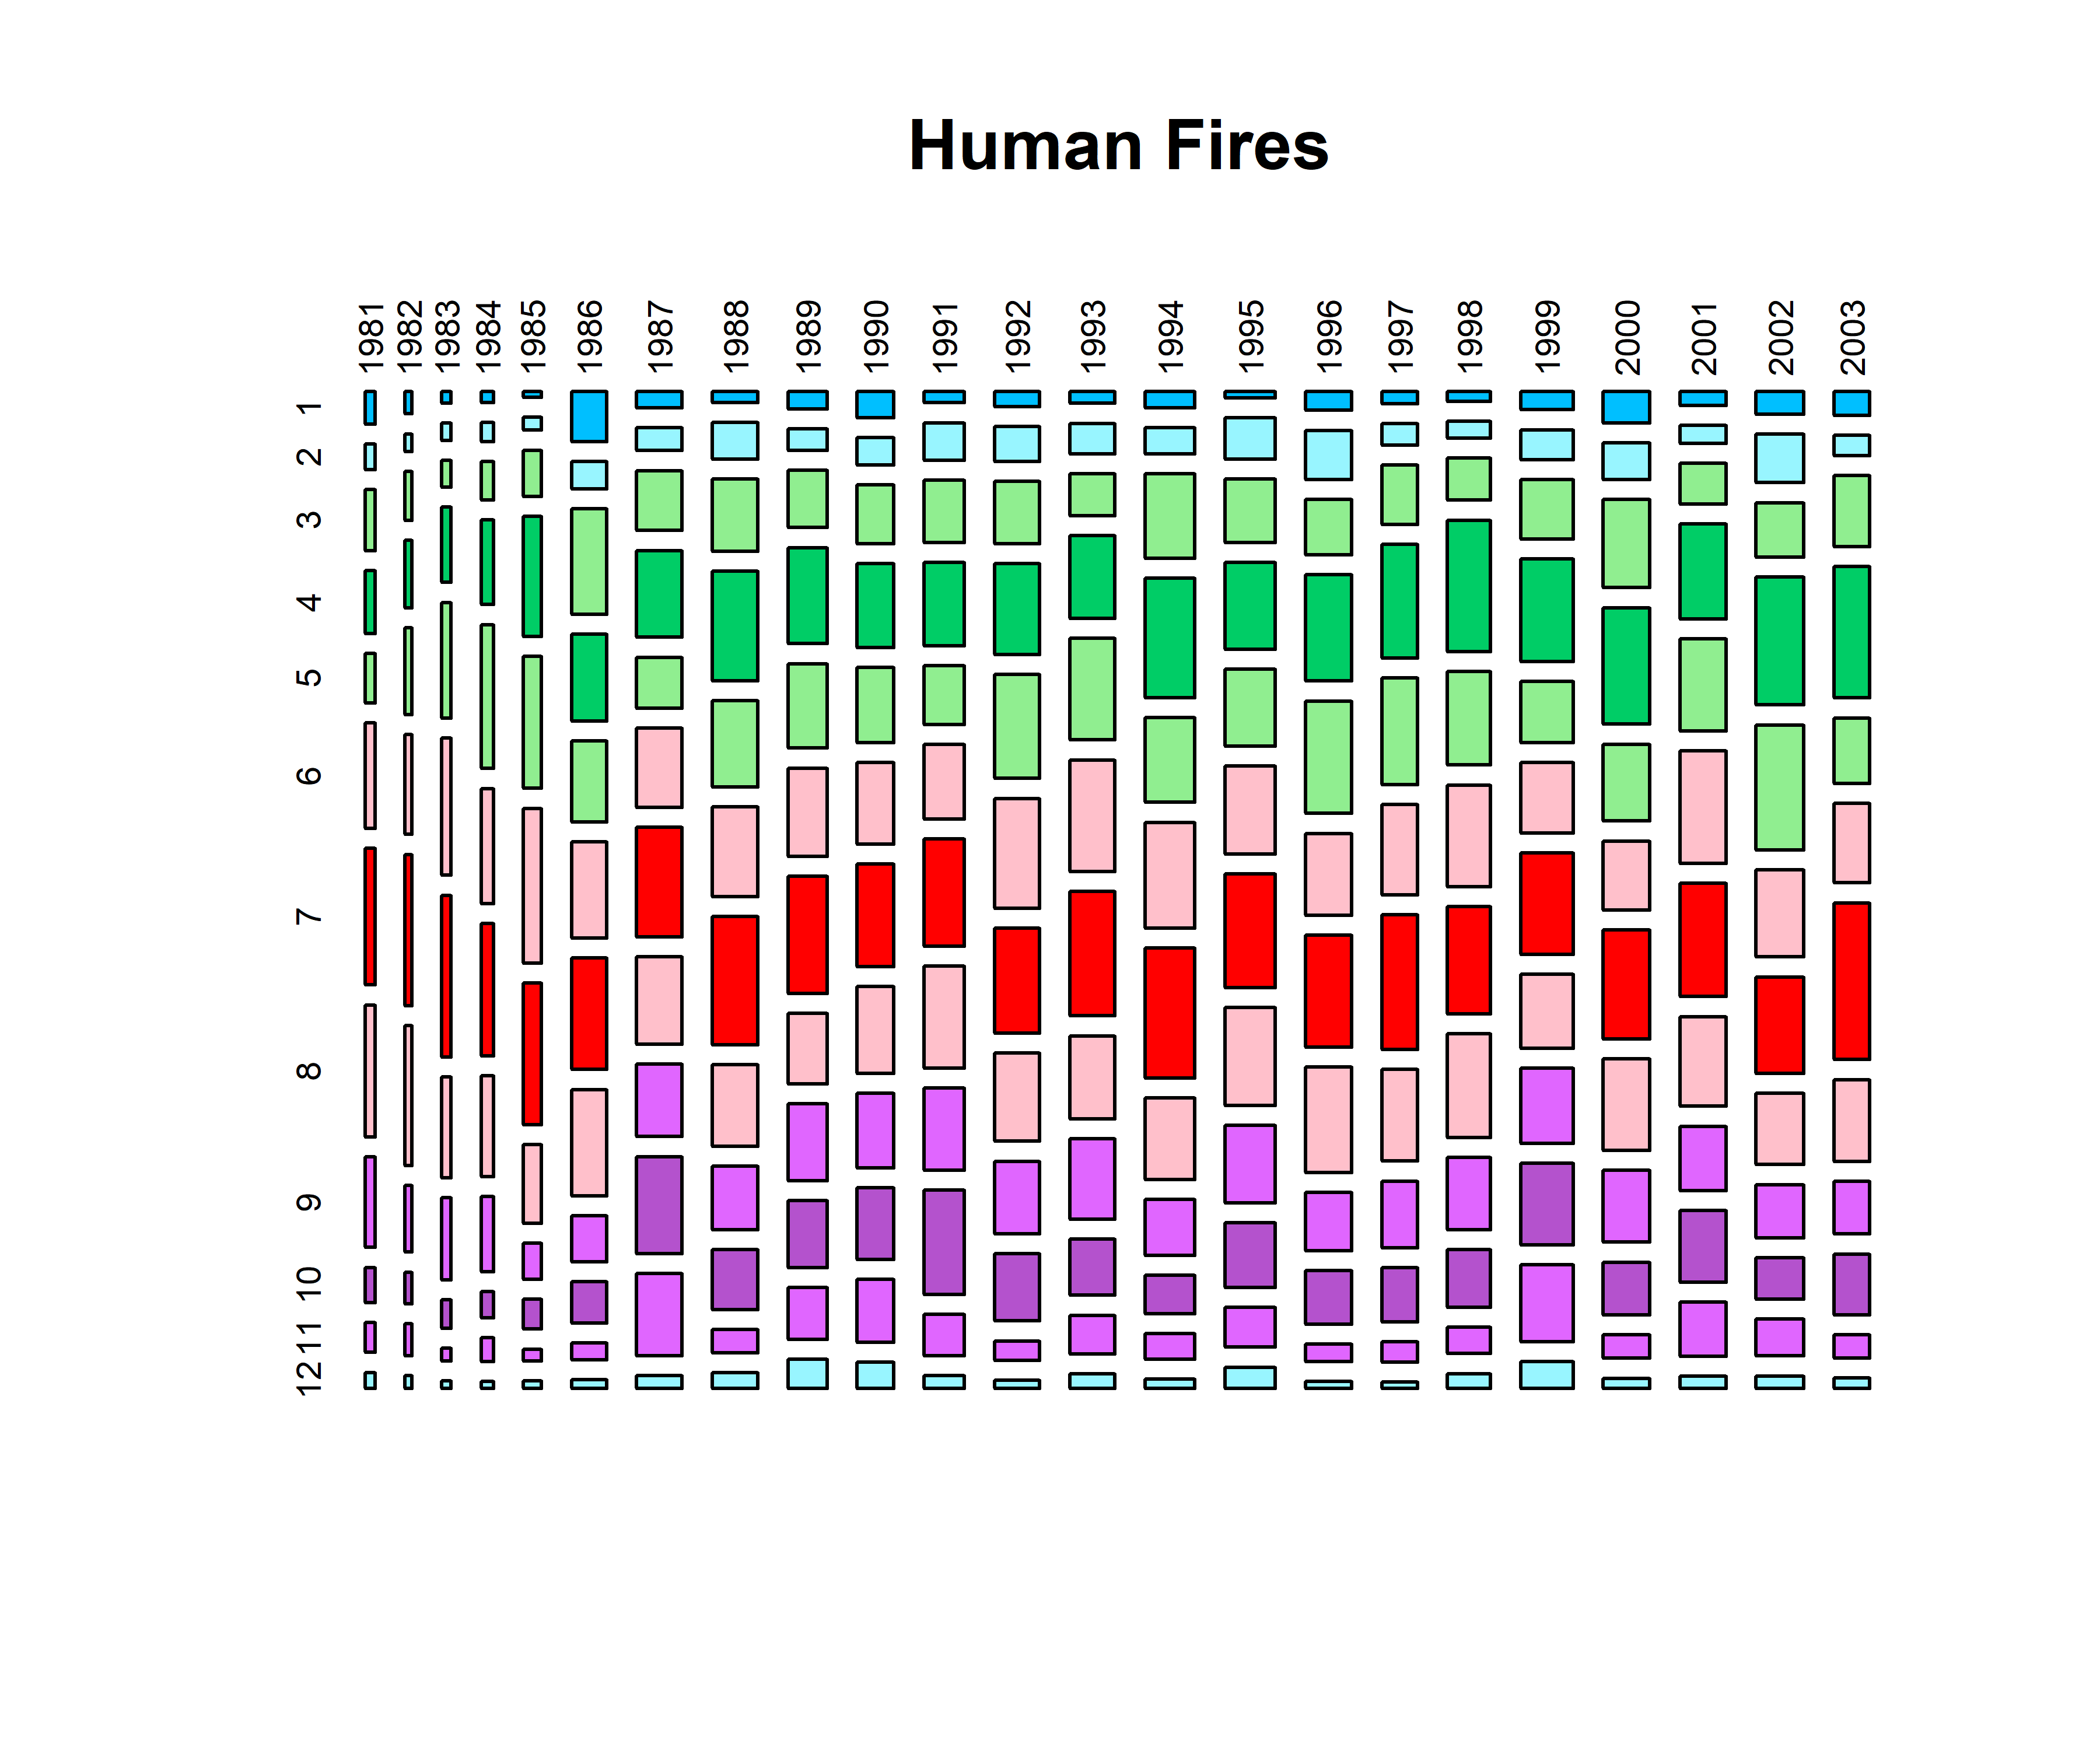
nifc.tablecause <- table(nifc$YEAR, nifc$AGENCY_COD)
mosaicplot(nifc.tablecause, cex.axis=0.6, las=3, color=mosaiccolor, main="Fires by Organization")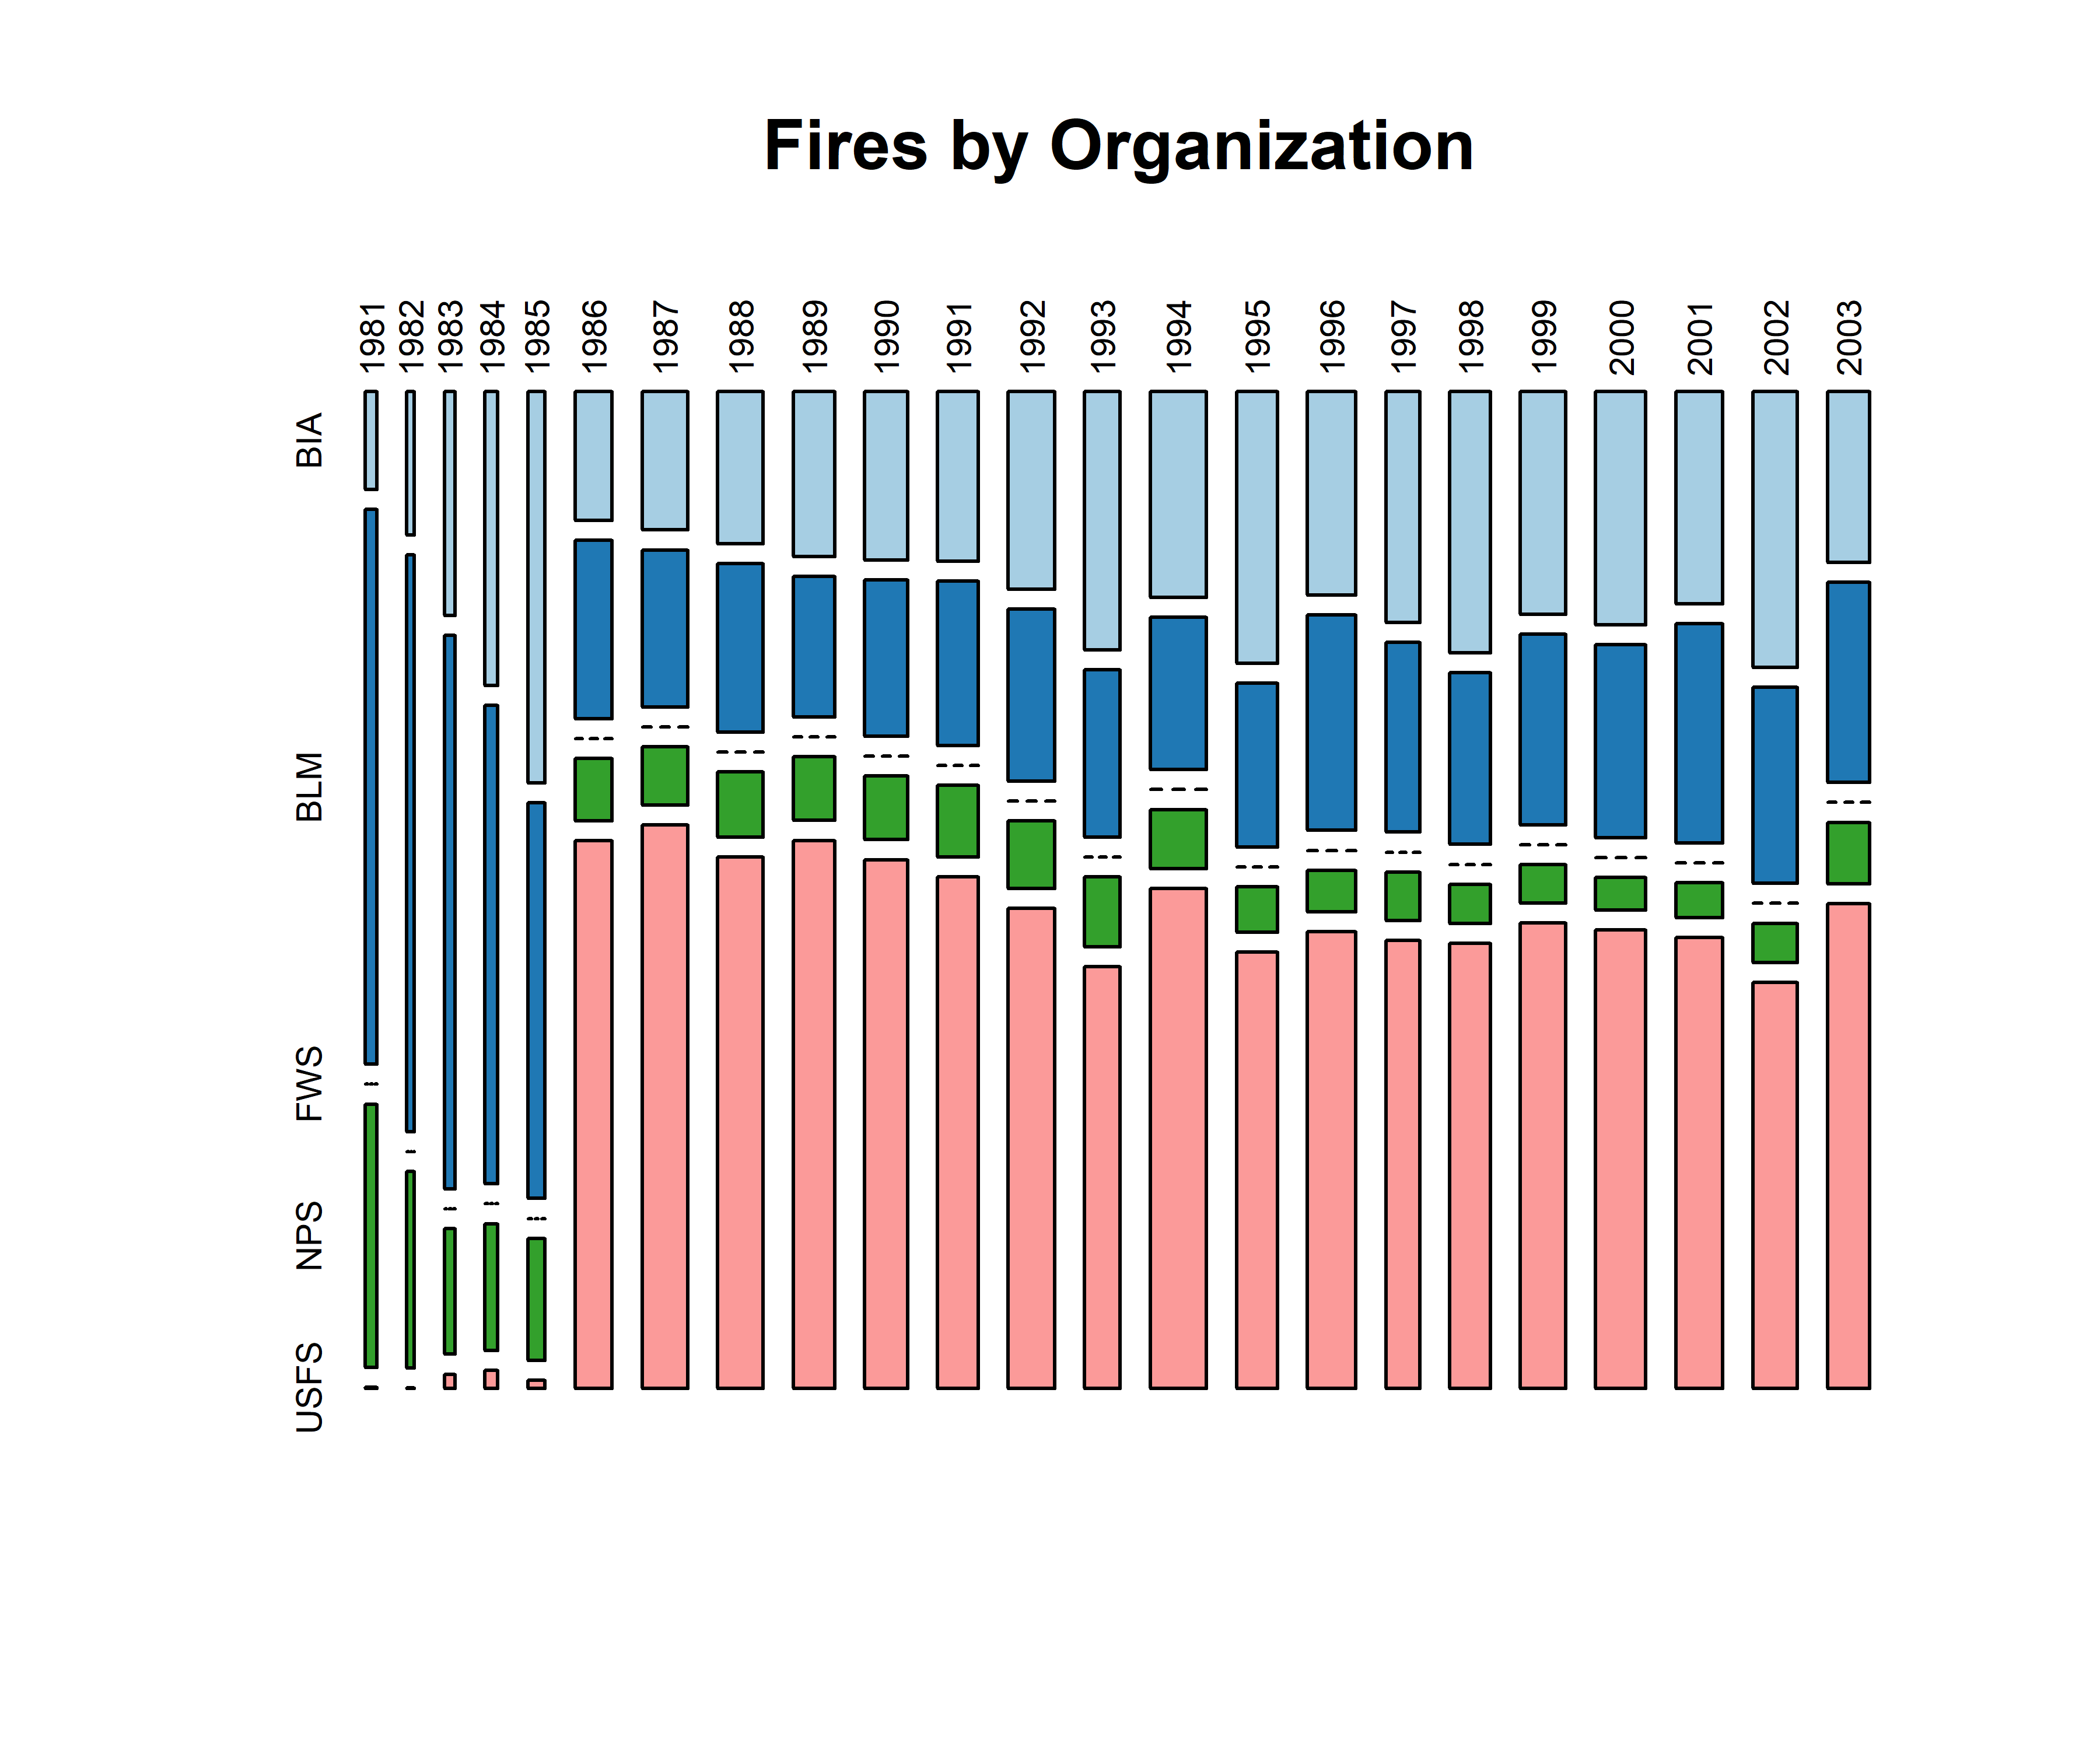
# 1 Natural; 2 Campfire; 3 Smoking; 4 Fire use; 5 Incendiary; 6 Equipment
# 7 Railroads; 8 Juveniles; 9 Miscellaneous; 0 Unknown
nifc.tablecause <- table(nifc$YEAR, nifc$GENERAL_CA)
mosaicplot(nifc.tablecause, cex.axis=0.6, las=3, color=mosaiccolor, main="Fires by Cause")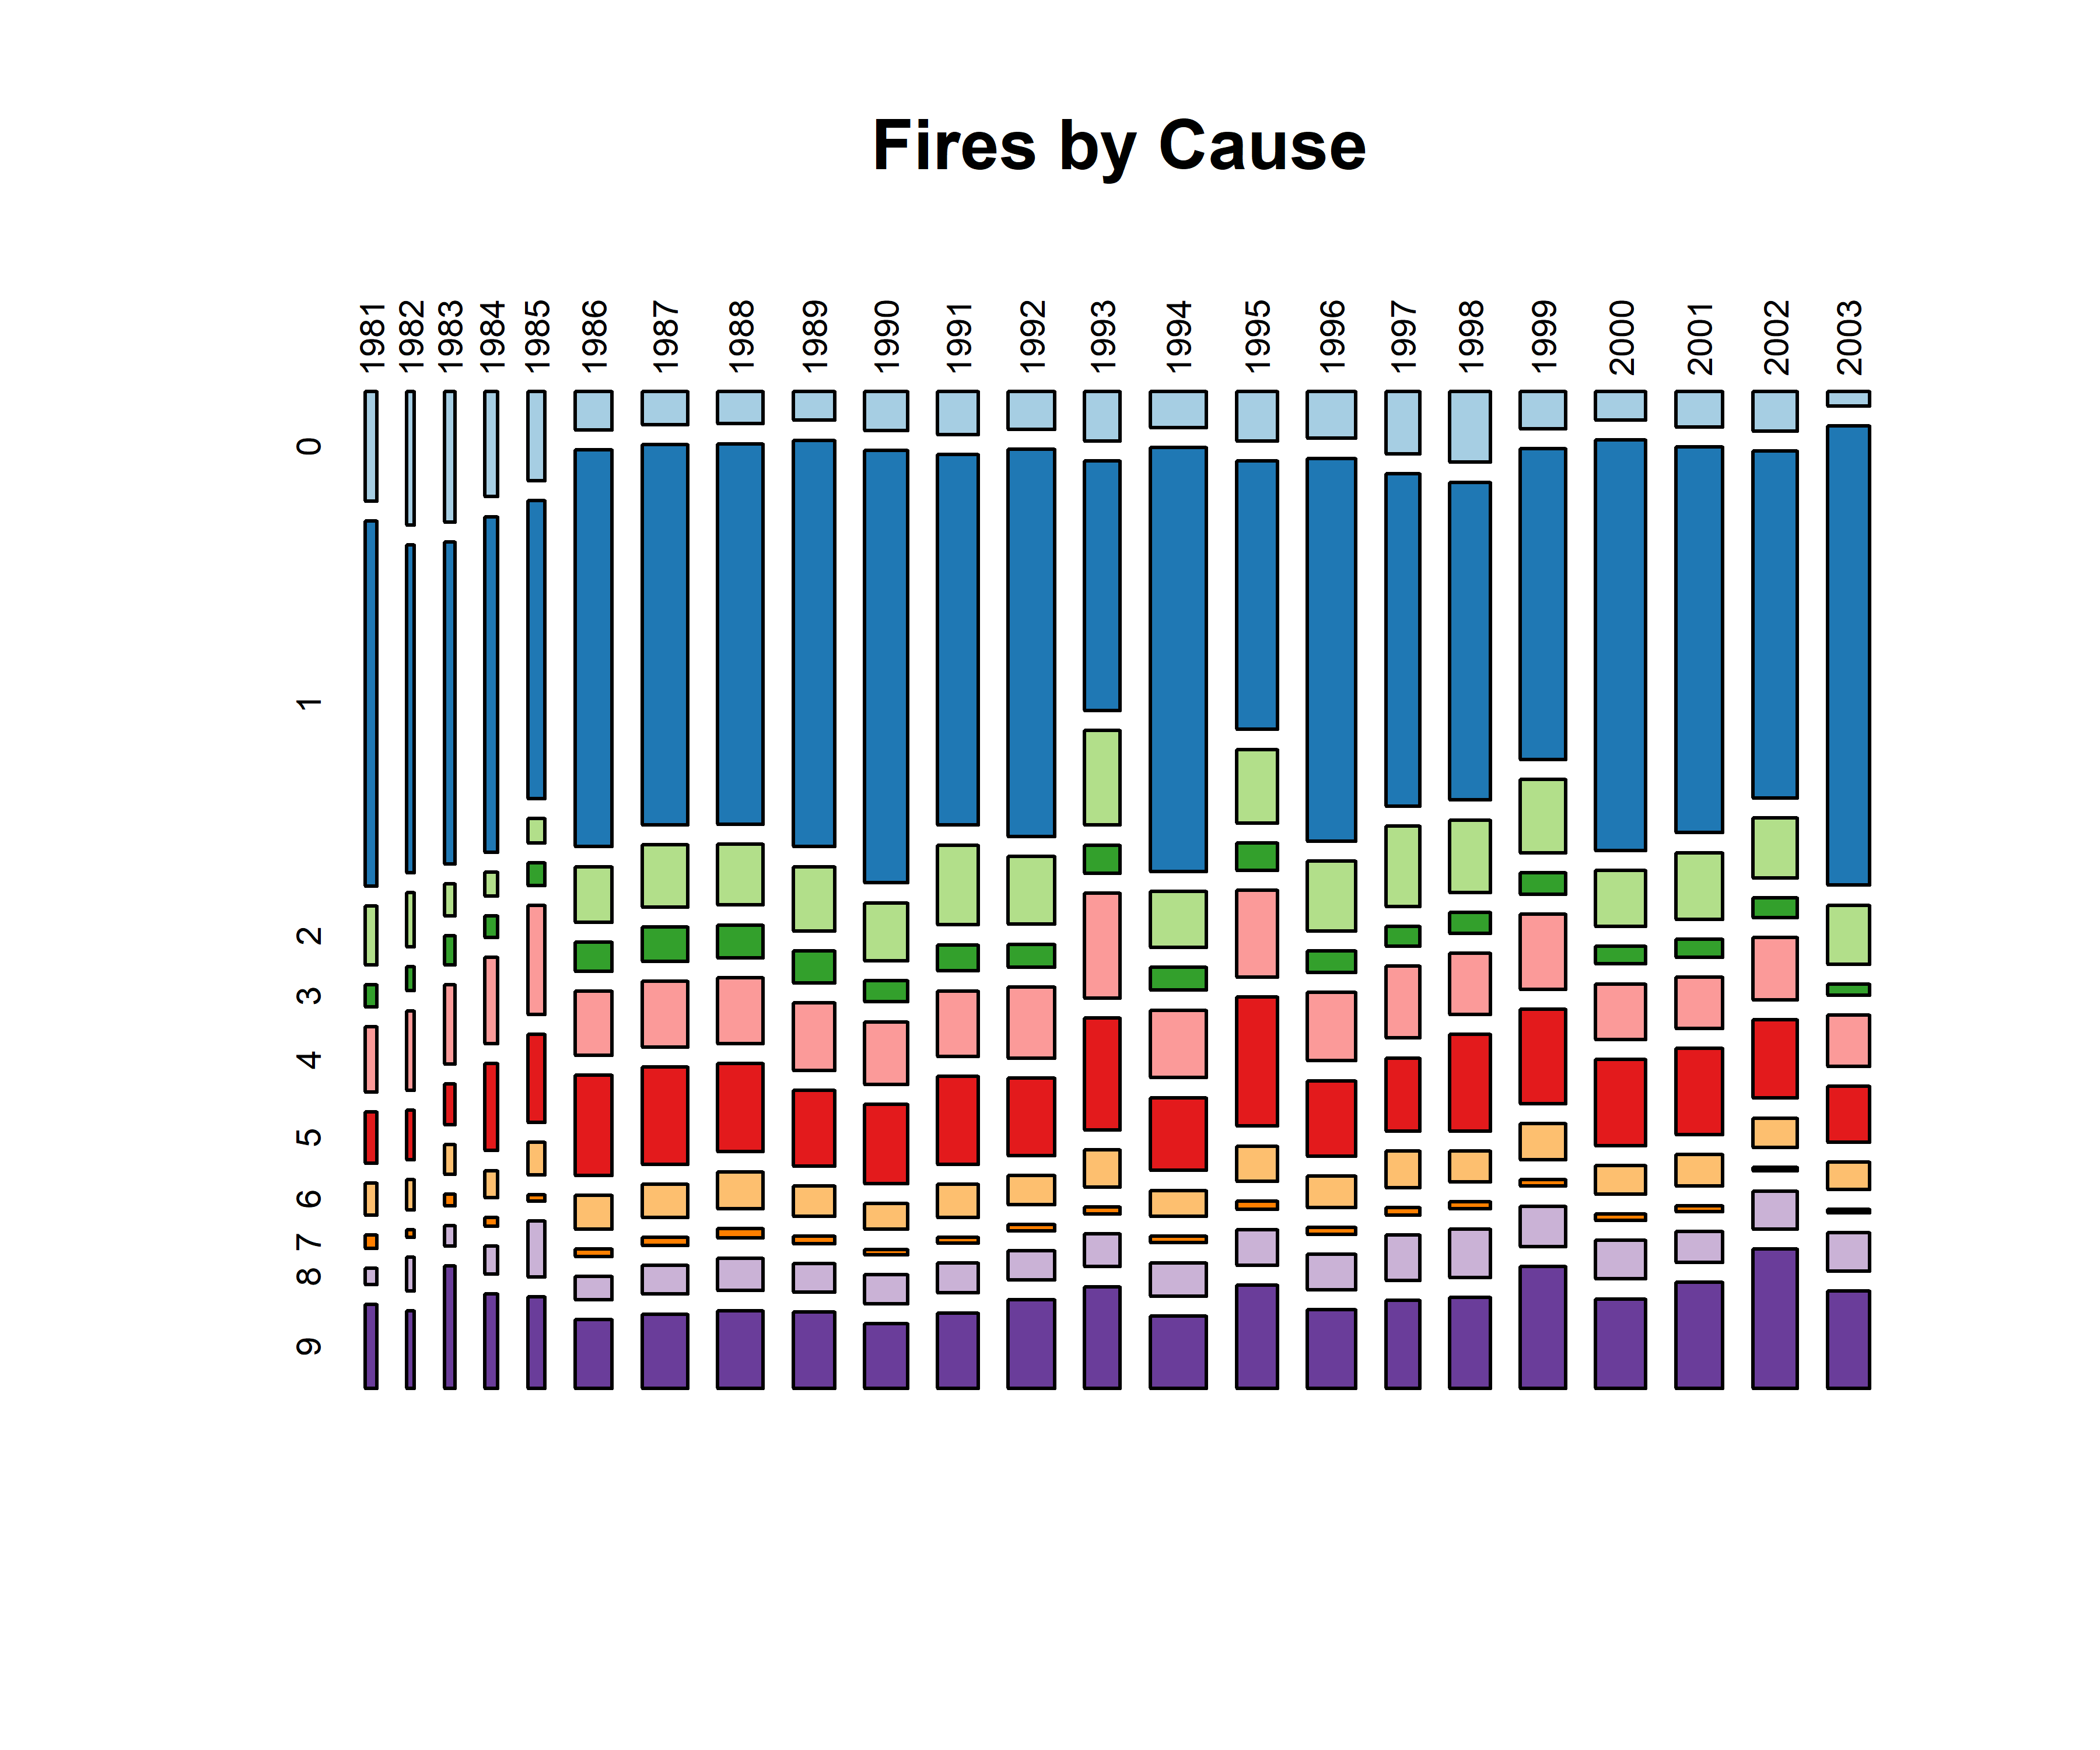
# 1 Lightning; 2 Aircraft; 3 Vehicle; 4 Exhaust; 5 Exhaust-other; 6 Logging Line; 7 Brakes; 8 Cooking/Warming;
# 9 Warming Fire; 10 Smoking; 11 Trash Burning; 12 Burning Dump; 13 Field Burning; 14 Land Clearing;
# 15 Slash Burning; 16 Right-of-way Burn; 17 Resource Management Burning; 18 Grudge Fire; 19 Recurrent;
# 20 Smoke Bees/Game; 21 Insect/Snake Control; 22 Employment; 23 Blasting; 24 Burning Building; 25 Power-line;
# 26 Fireworks; 27 Ignition Devices; 28 Repel Predators; 29 House/Stove Spark; 30 Other-Unknown;
# 31 Volcanic; 32 Other-Unknown
nifc.tablecause <- table(nifc$YEAR, nifc$specific_cause)
mosaicplot(nifc.tablecause, cex.axis=0.6, las=2, color=mosaiccolor, main="Fires by Cause")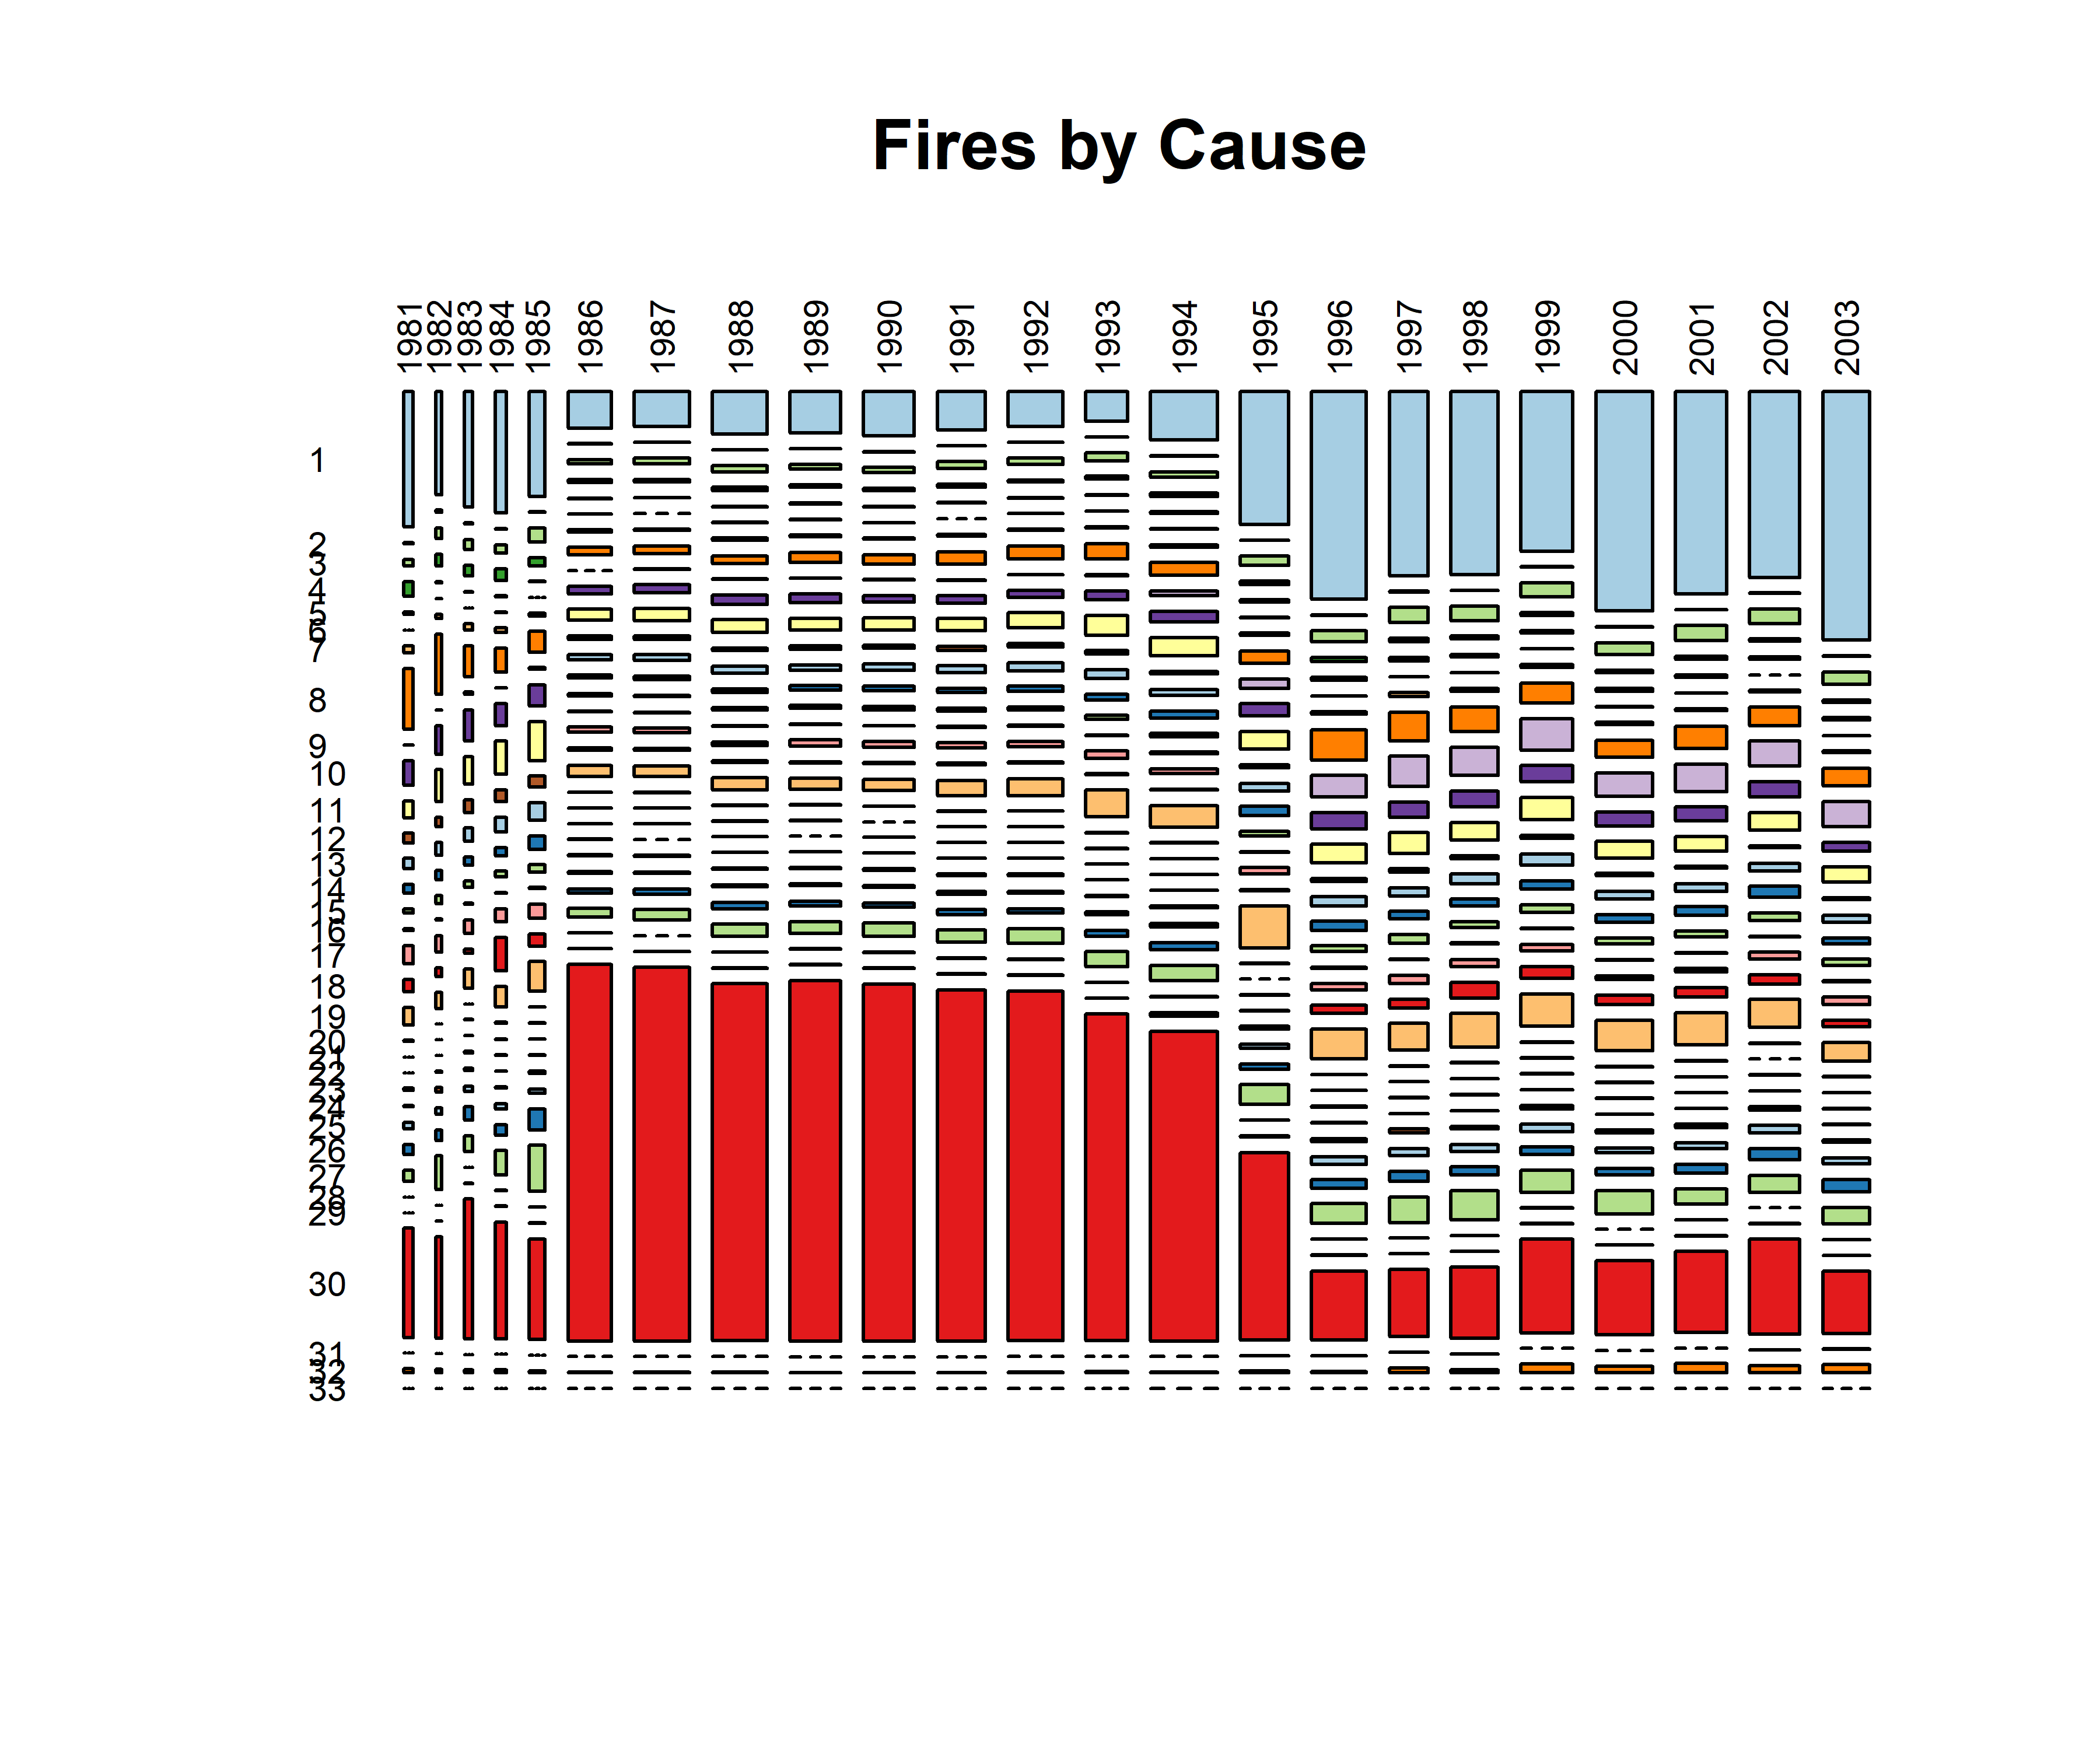
# 1 Natural; 2 Campfire; 3 Smoking; 4 Fire use; 5 Incendiary; 6 Equipment
# 7 Railroads; 8 Juveniles; 9 Miscellaneous; 0 Unknown
nifc.tableagencycause <- table(nifc$AGENCY_COD, nifc$GENERAL_CA)
mosaicplot(nifc.tableagencycause, cex.axis=0.6, las=3, color=mosaiccolor, main="Fires by Agency and Cause")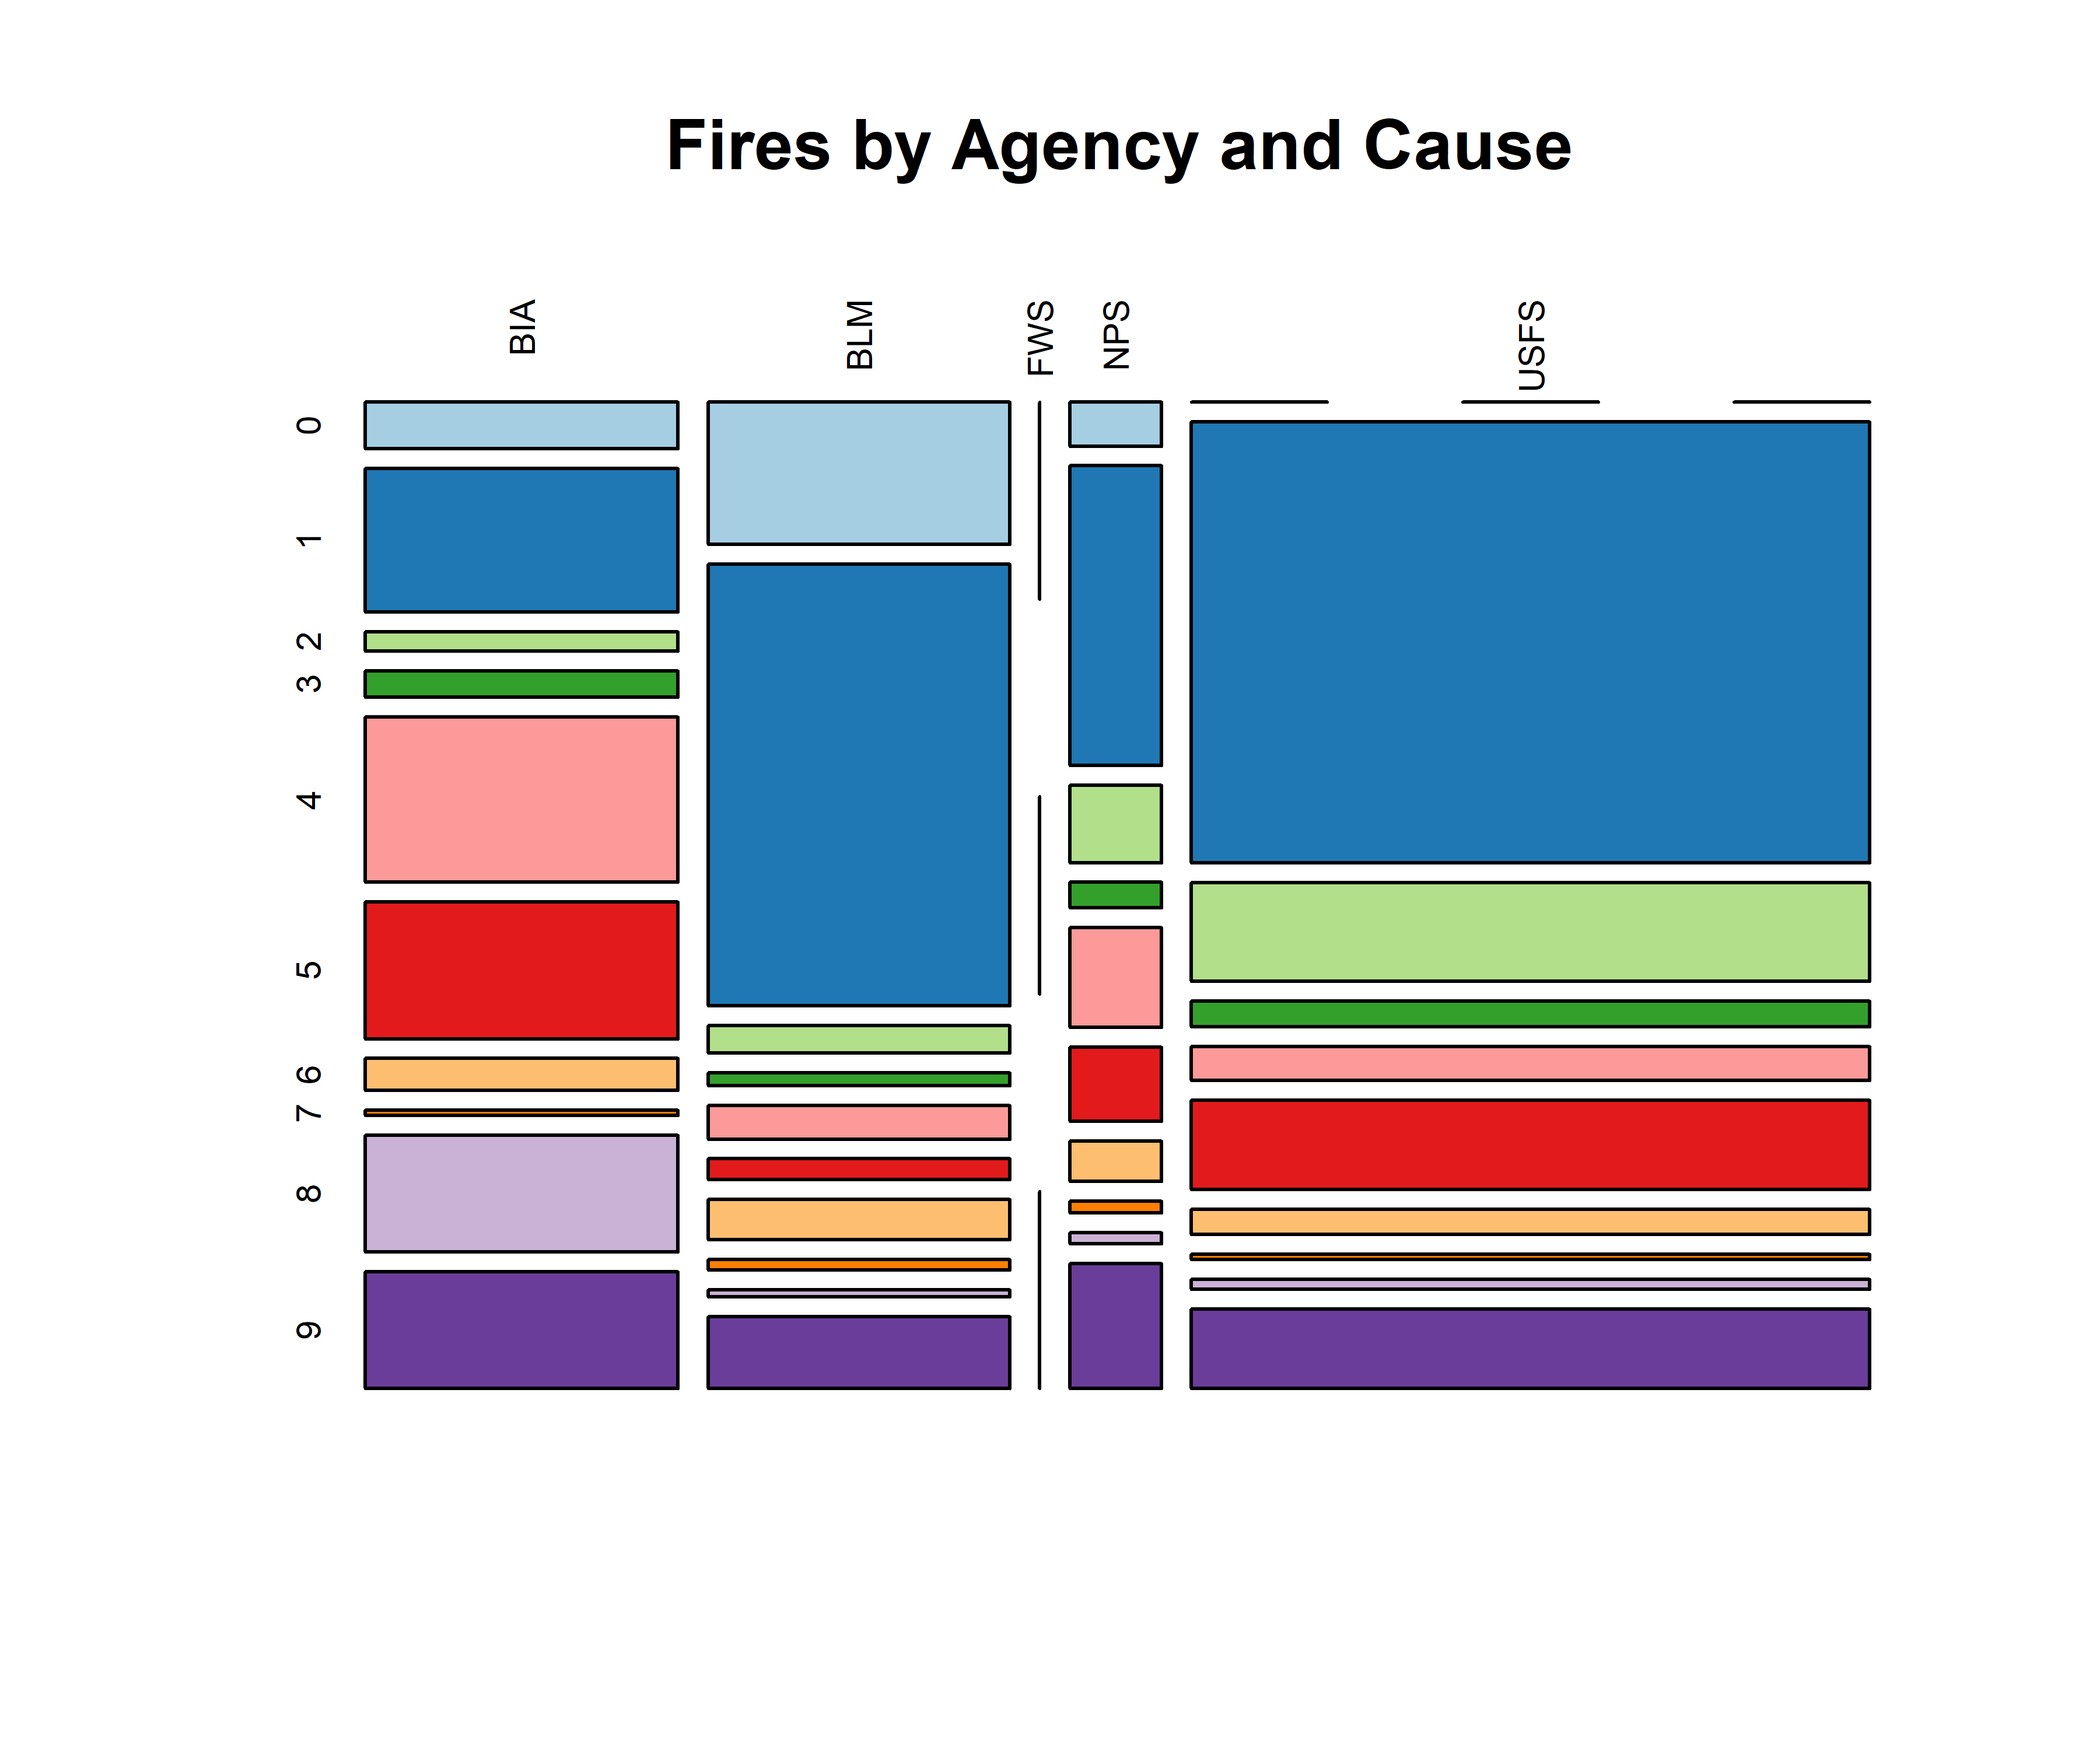
# 1 Lightning; 2 Aircraft; 3 Vehicle; 4 Exhaust; 5 Exhaust-other; 6 Logging Line; 7 Brakes; 8 Cooking/Warming;
# 9 Warming Fire; 10 Smoking; 11 Trash Burning; 12 Burning Dump; 13 Field Burning; 14 Land Clearing;
# 15 Slash Burning; 16 Right-of-way Burn; 17 Resource Management Burning; 18 Grudge Fire; 19 Recurrent;
# 20 Smoke Bees/Game; 21 Insect/Snake Control; 22 Employment; 23 Blasting; 24 Burning Building; 25 Power-line;
# 26 Fireworks; 27 Ignition Devices; 28 Repel Predators; 29 House/Stove Spark; 30 Other-Unknown;
# 31 Volcanic; 32 Other-Unknown
nifc.tableagencyspcause <- table(nifc$AGENCY_COD, as.integer(nifc$specific_cause))
mosaicplot(nifc.tableagencyspcause, cex.axis=0.6, las=2, color=mosaiccolor, main="Fires by Agency and Cause")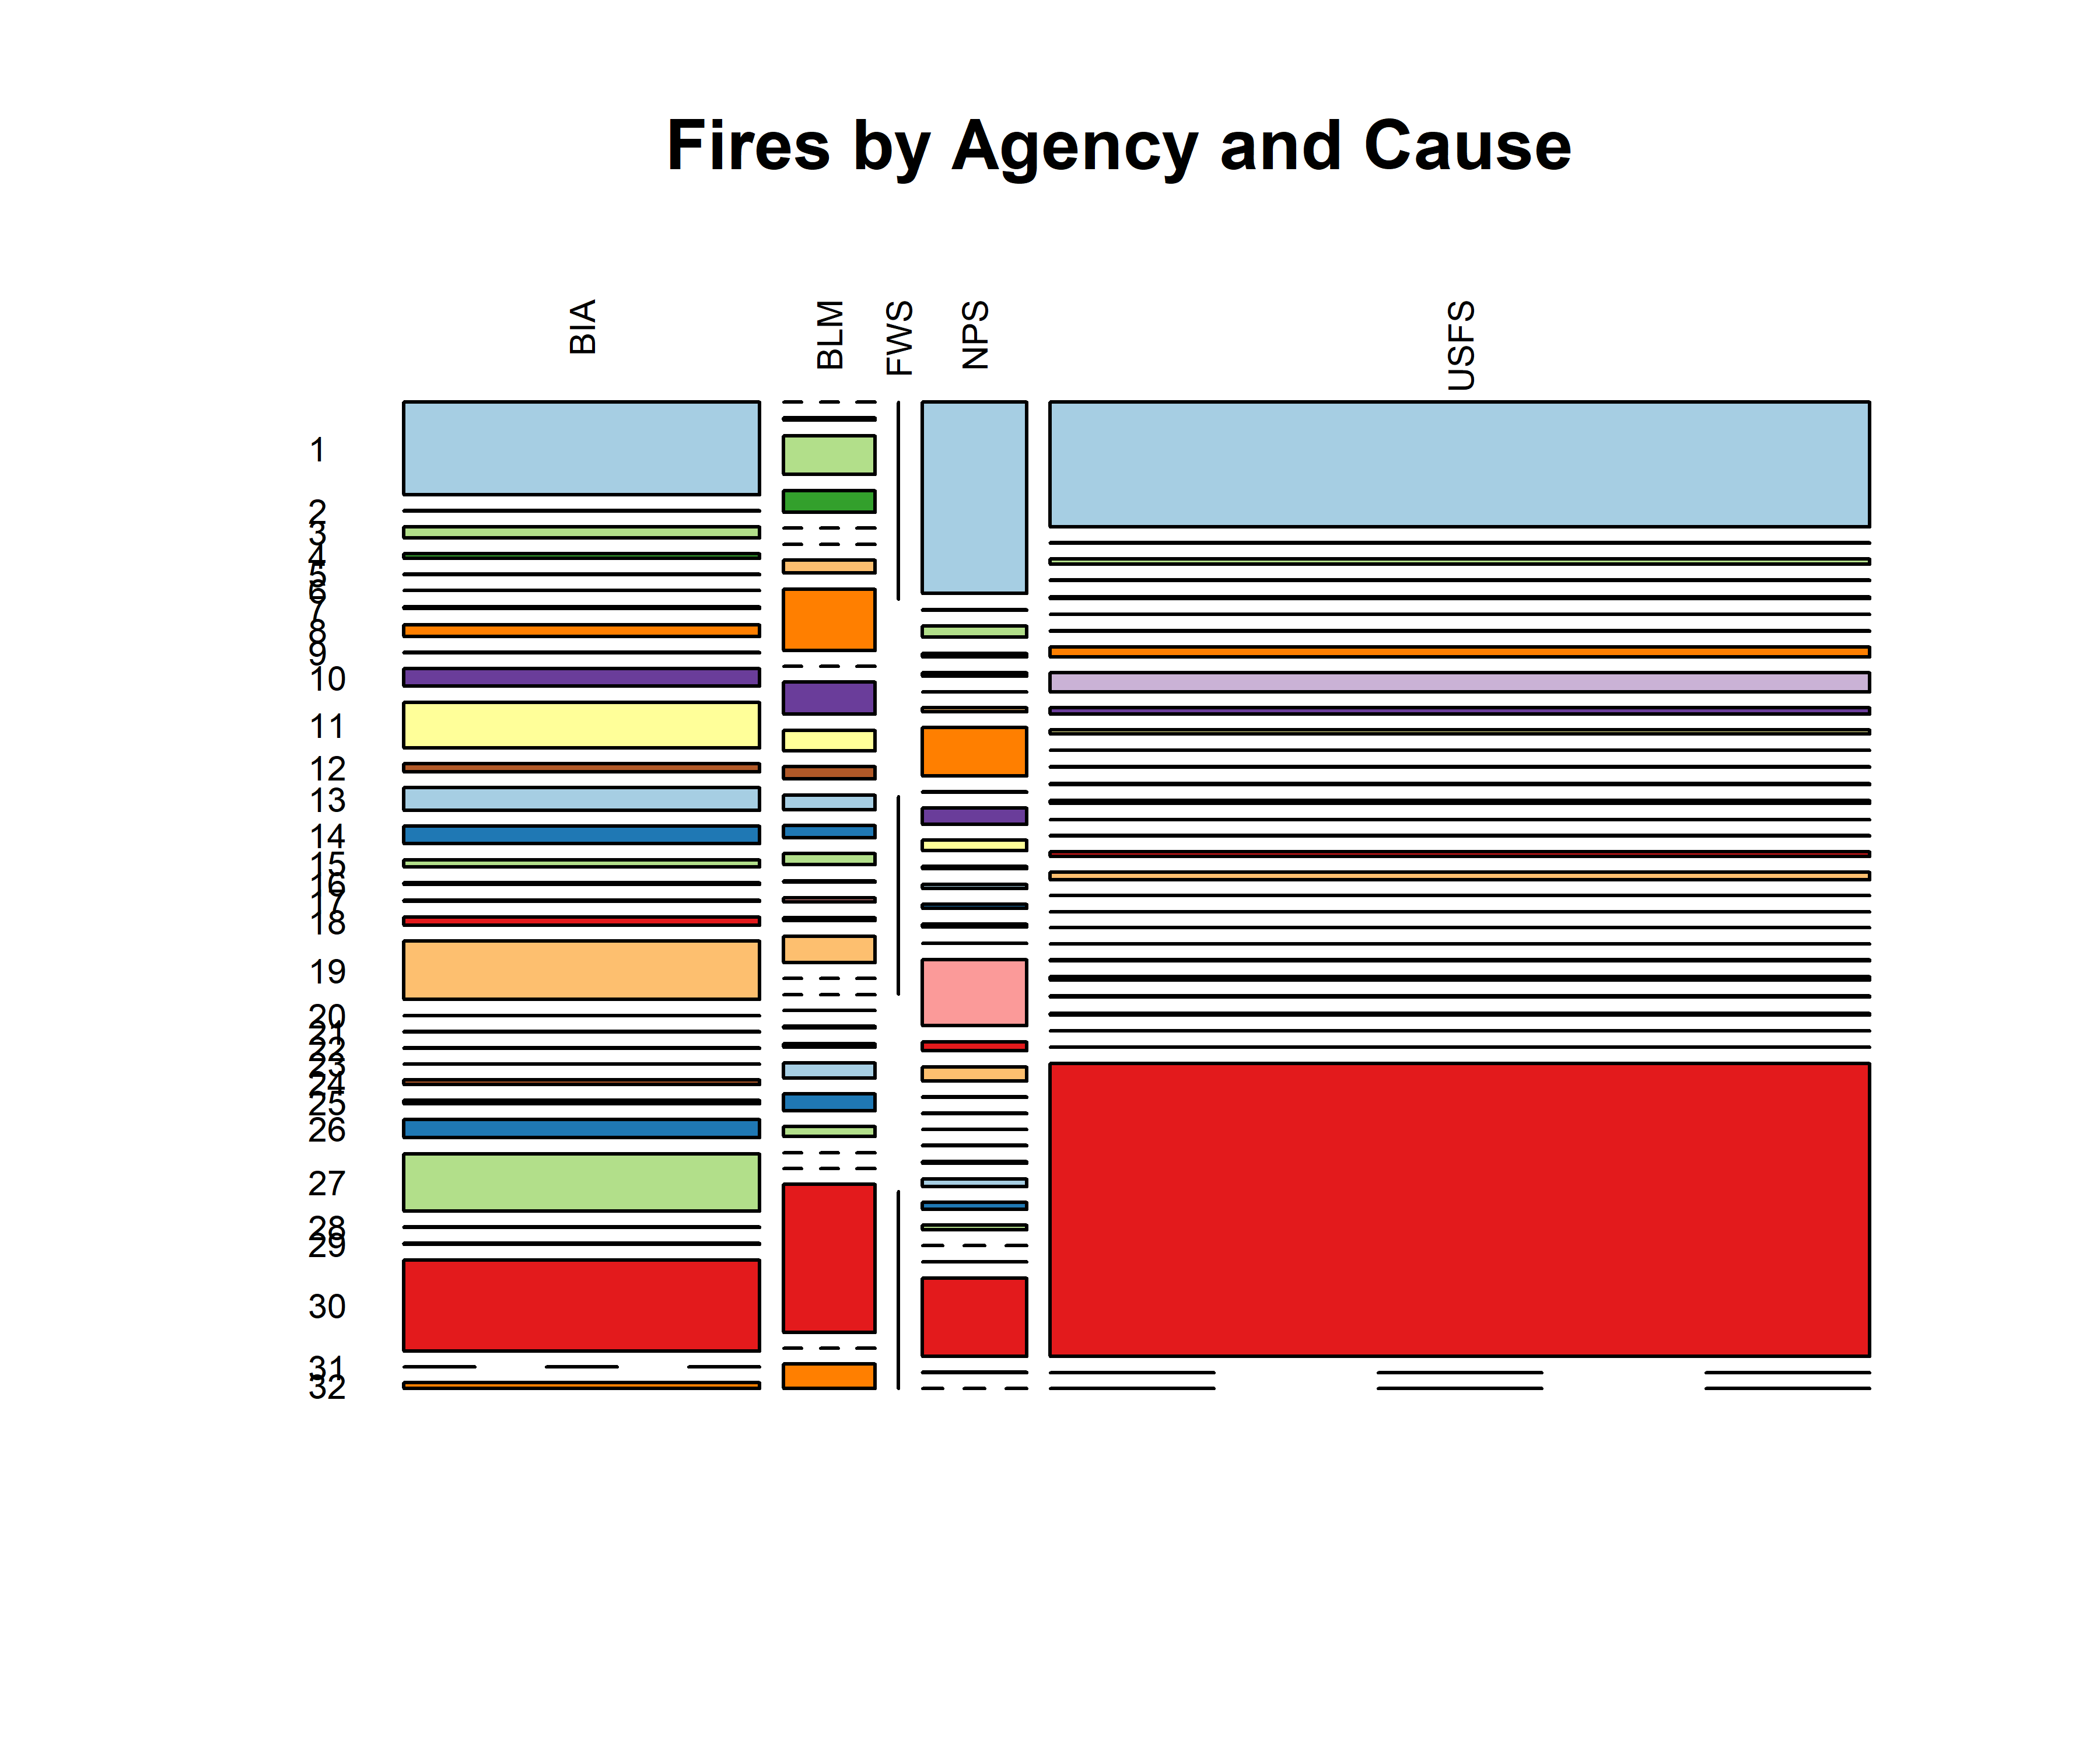
Number of fires/year (FS and FWS)
hist(nifc$YEAR[nifc$AGENCY_COD =="USFS"], xlim=c(1980,2015), ylim=c(0,40000),
  breaks=seq(1979.5,2014.5,by=1))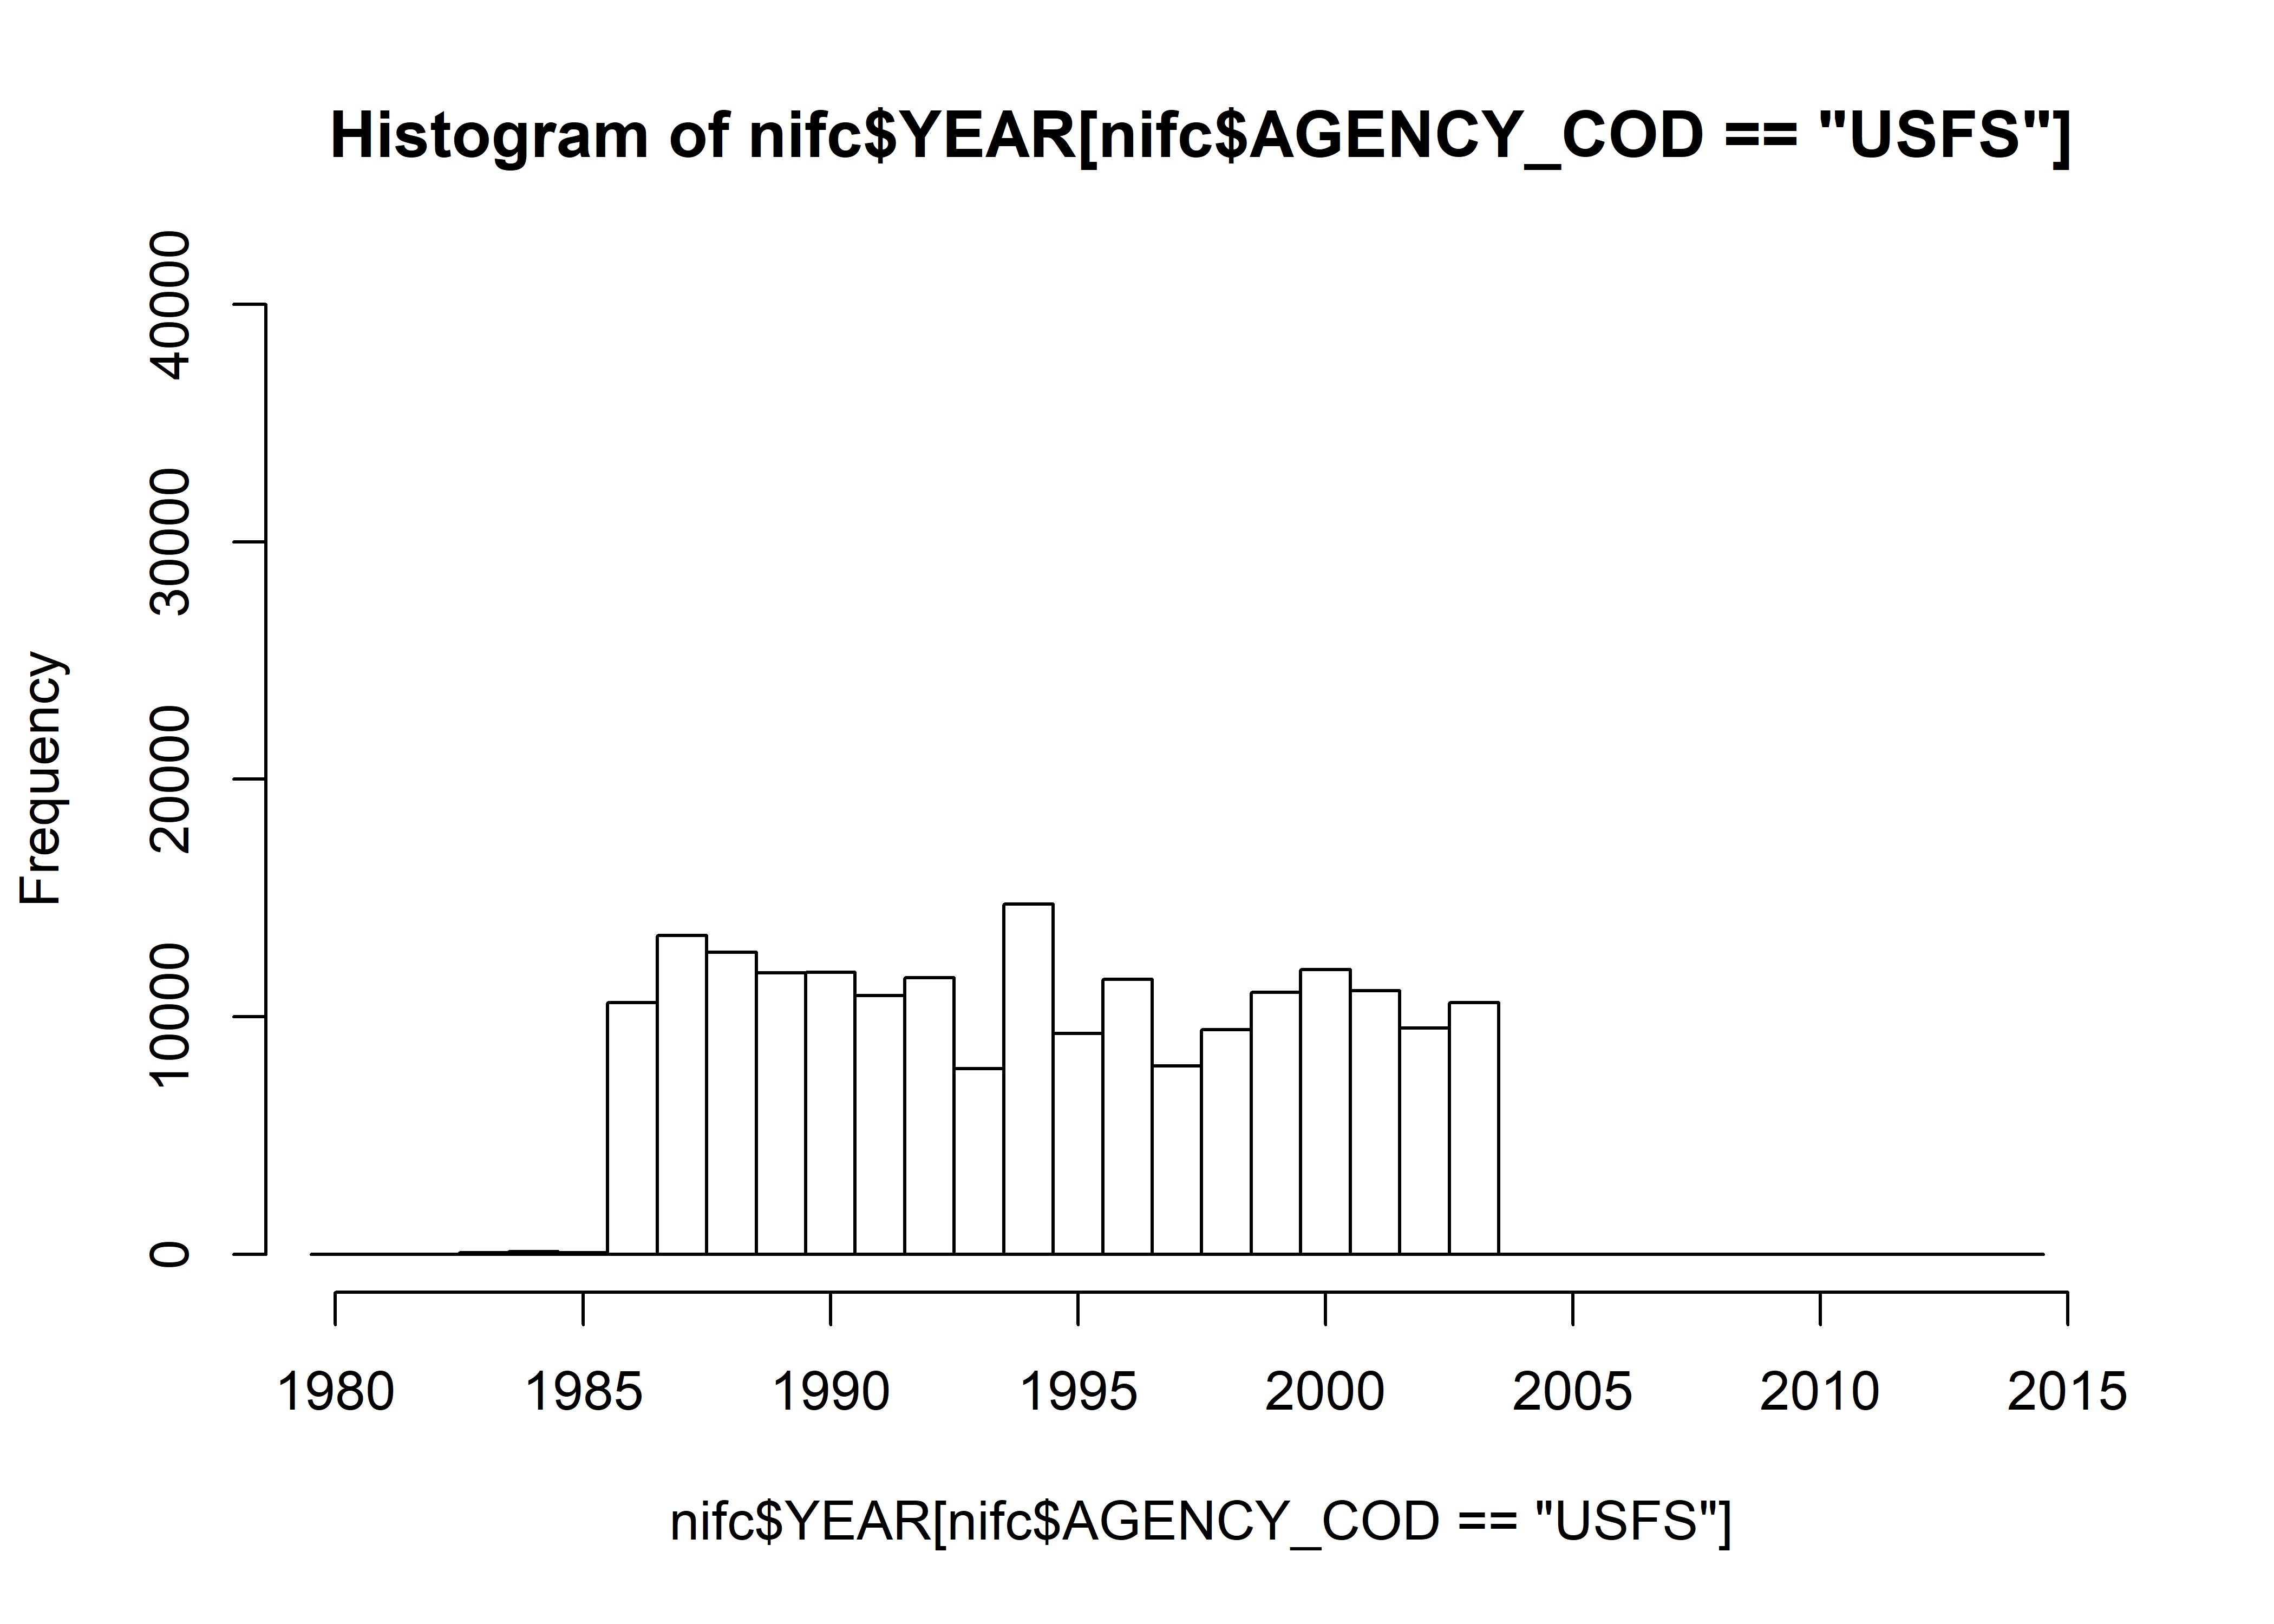
hist(nifc$YEAR[nifc$AGENCY_COD =="FWS"], xlim=c(1980,2015), ylim=c(0,40000),
  breaks=seq(1979.5,2014.5,by=1))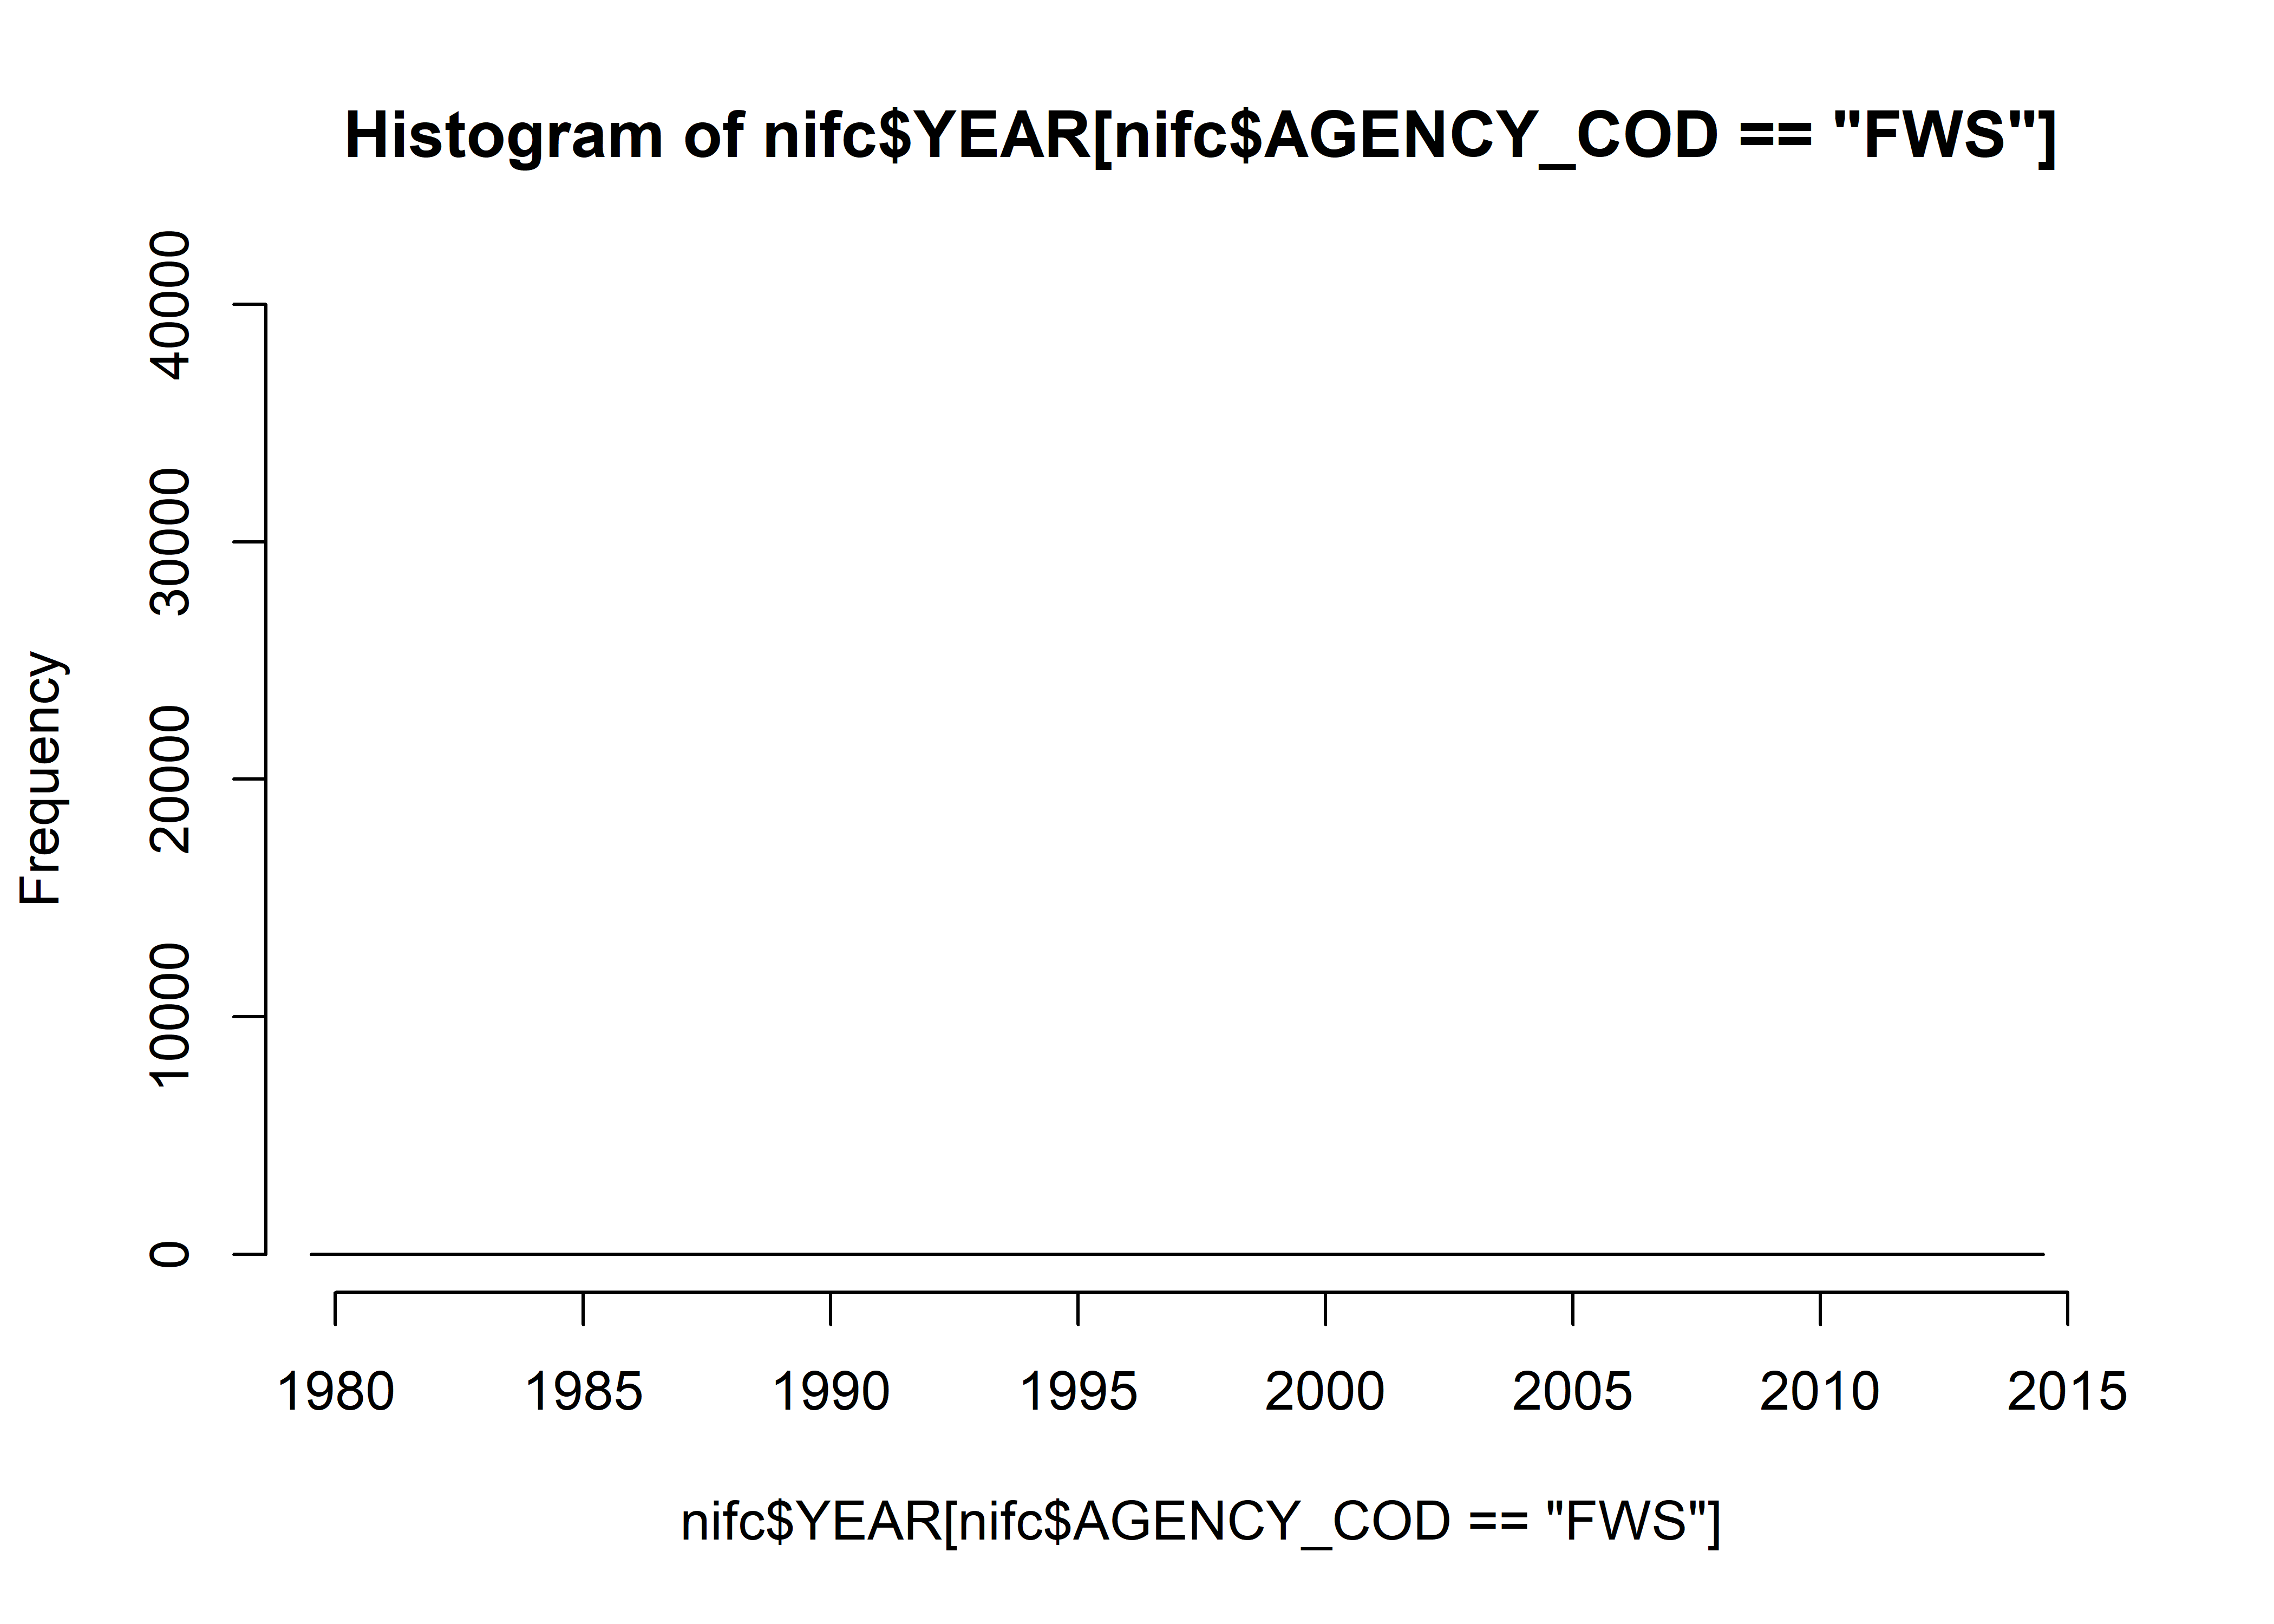
Mosaic plots by agency (FS and FWS)
table(nifc$AGENCY_COD)##
## BIA BLM FWS NPS USFS
## 91480 88307 0 26809 198437nifc.tablemon <- table(nifc$YEAR[nifc$AGENCY_COD == "USFS"],
nifc$startmon[nifc$AGENCY_COD == "USFS"])
mosaicplot(nifc.tablemon, color=monthcolors, cex.axis=0.6, las=3, main="All Fires -- FS")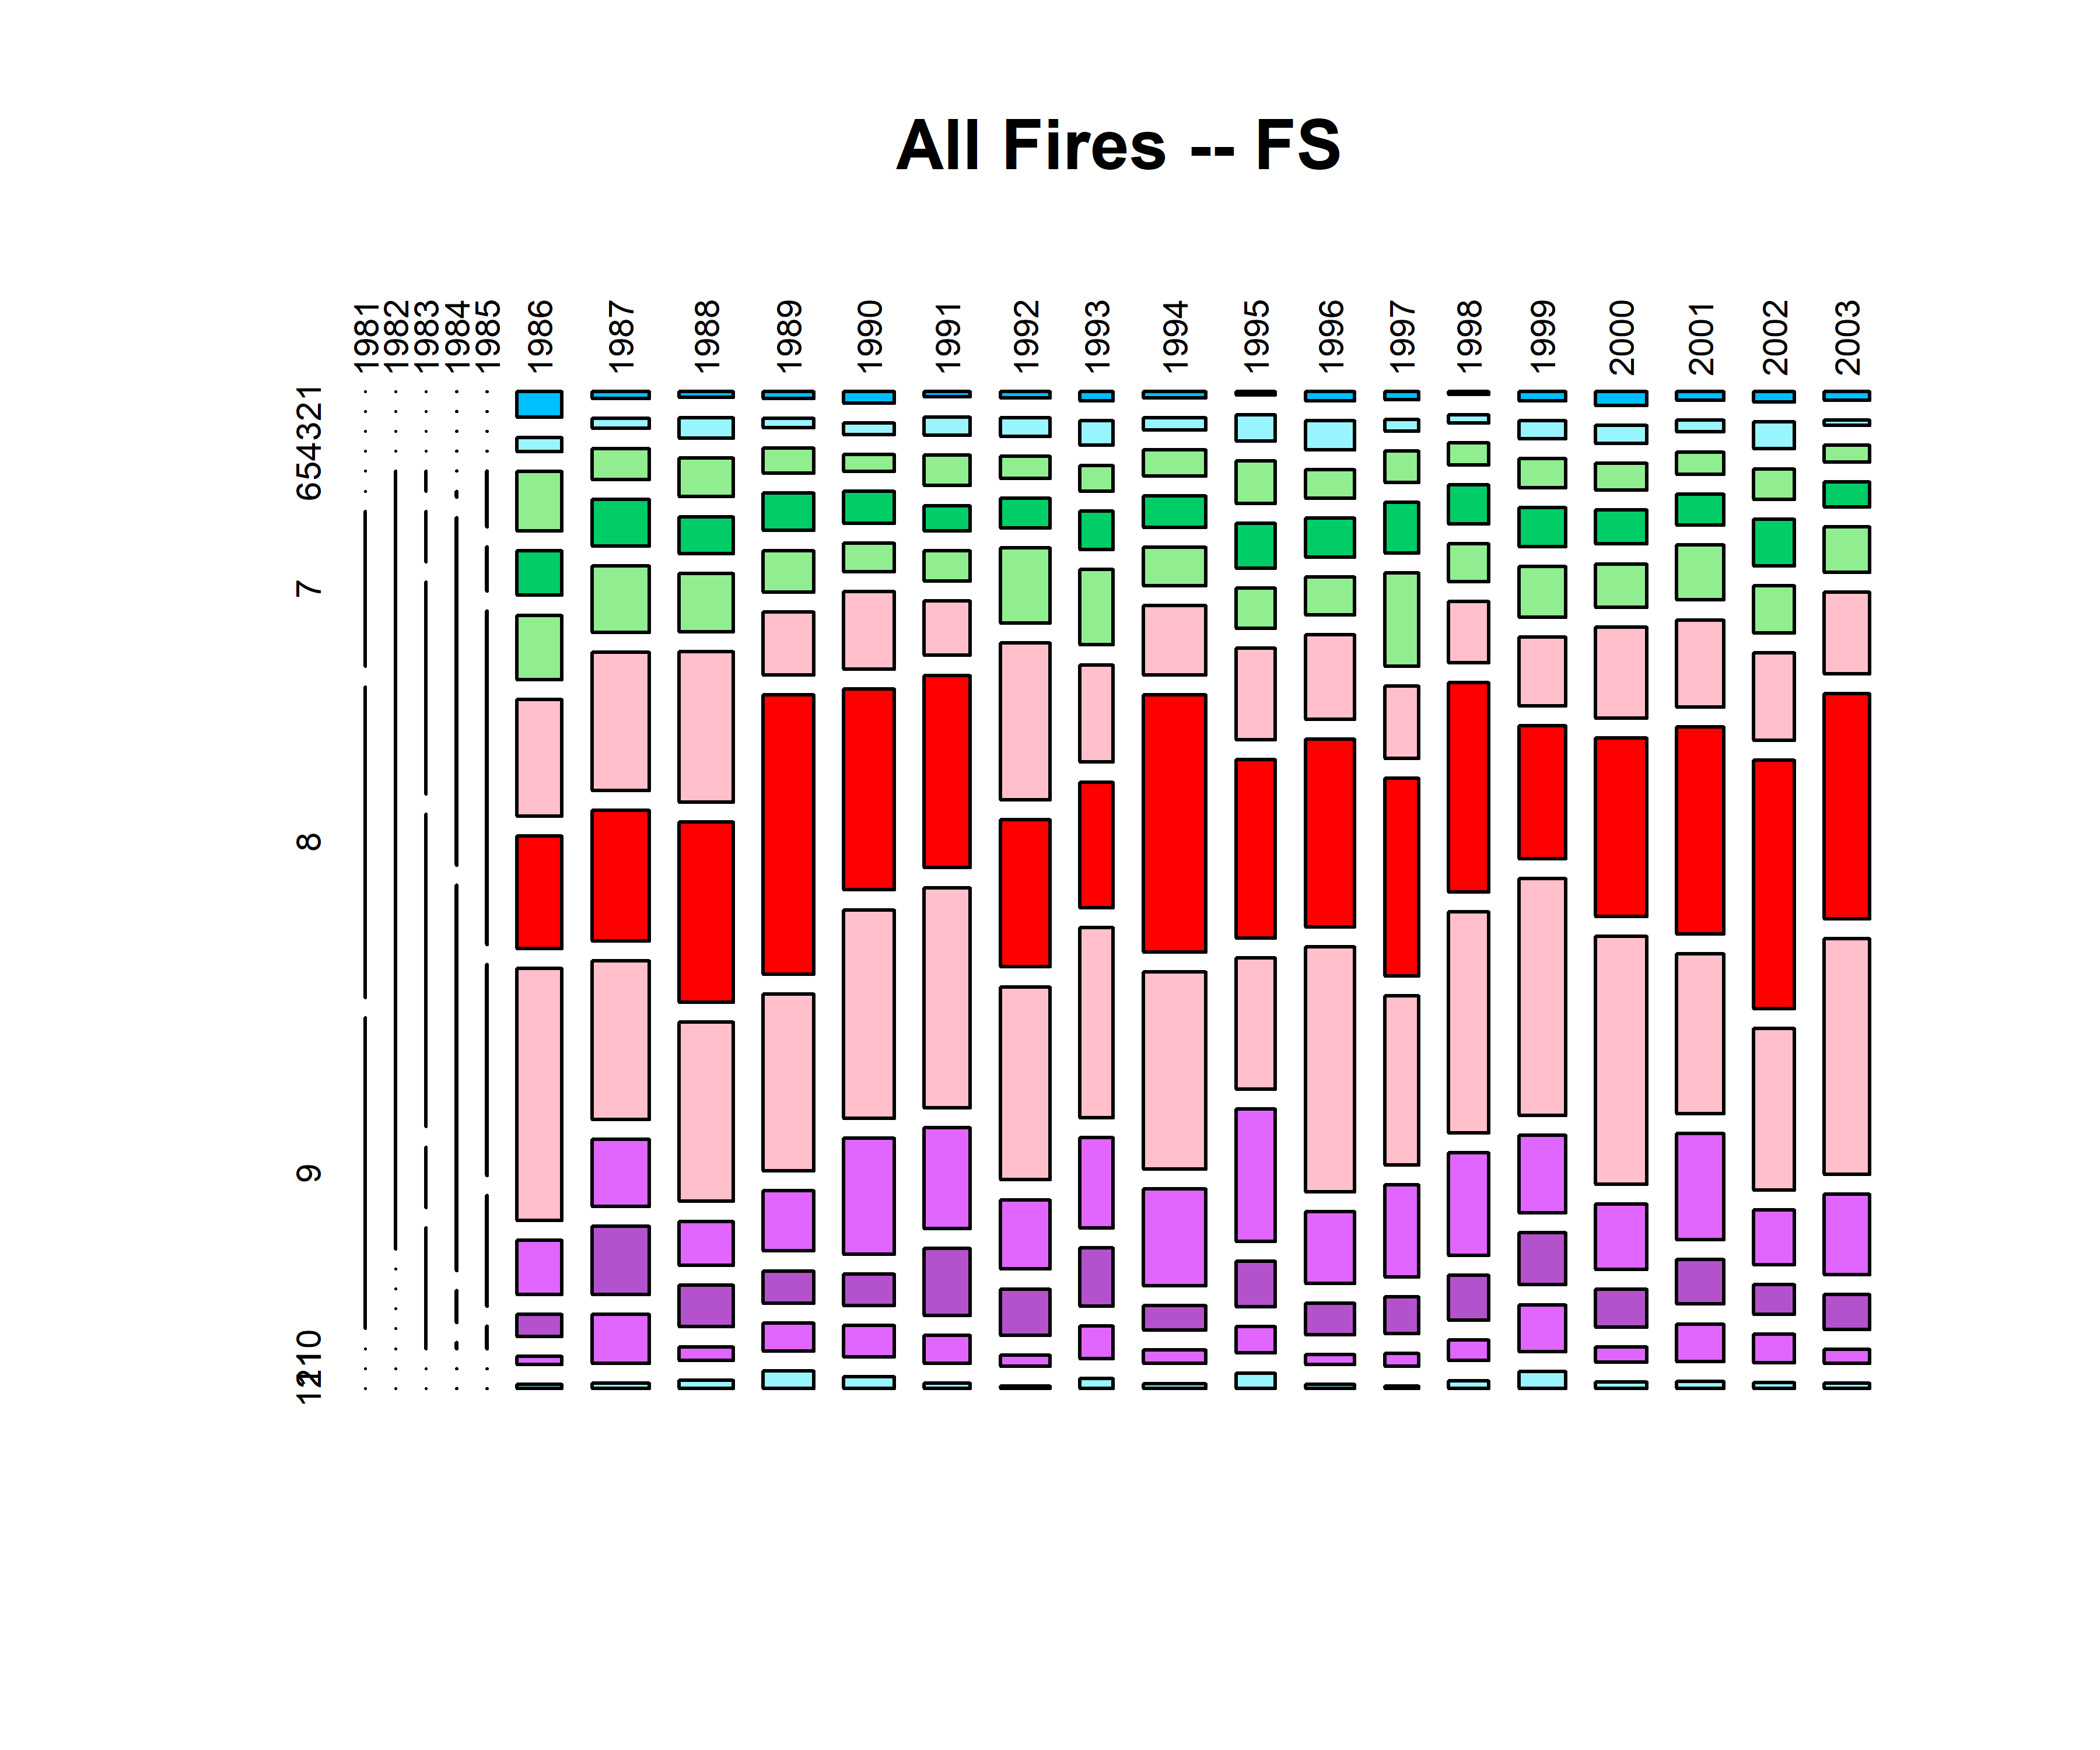
1.2 Western U.S. Subset
This subset corresponds to the data set used in Bartlein et al. (2008) (i.e. fires with longitudes <= -102.0)
nifc.wus <- nifc[nifc$LONGITUDE <= -102.0 & nifc$LONGITUDE >= -126.0,]
length(nifc.wus[,1])
## [1] 324843table(nifc.wus$CAUSE)##
## 0 1 2
## 20131 173145 131476Map the data
plot(nifc.wus$LATITUDE ~ nifc.wus$LONGITUDE, ylim=c(27.5,50), xlim=c(-125,-100), type="n",
  xlab="Longitude", ylab="Latitude")
map("world", add=TRUE, lwd=2, col="gray")
map("state", add=TRUE, lwd=2, col="gray")
points(nifc.wus$LATITUDE ~ nifc.wus$LONGITUDE, pch=16, cex=0.2, col="red")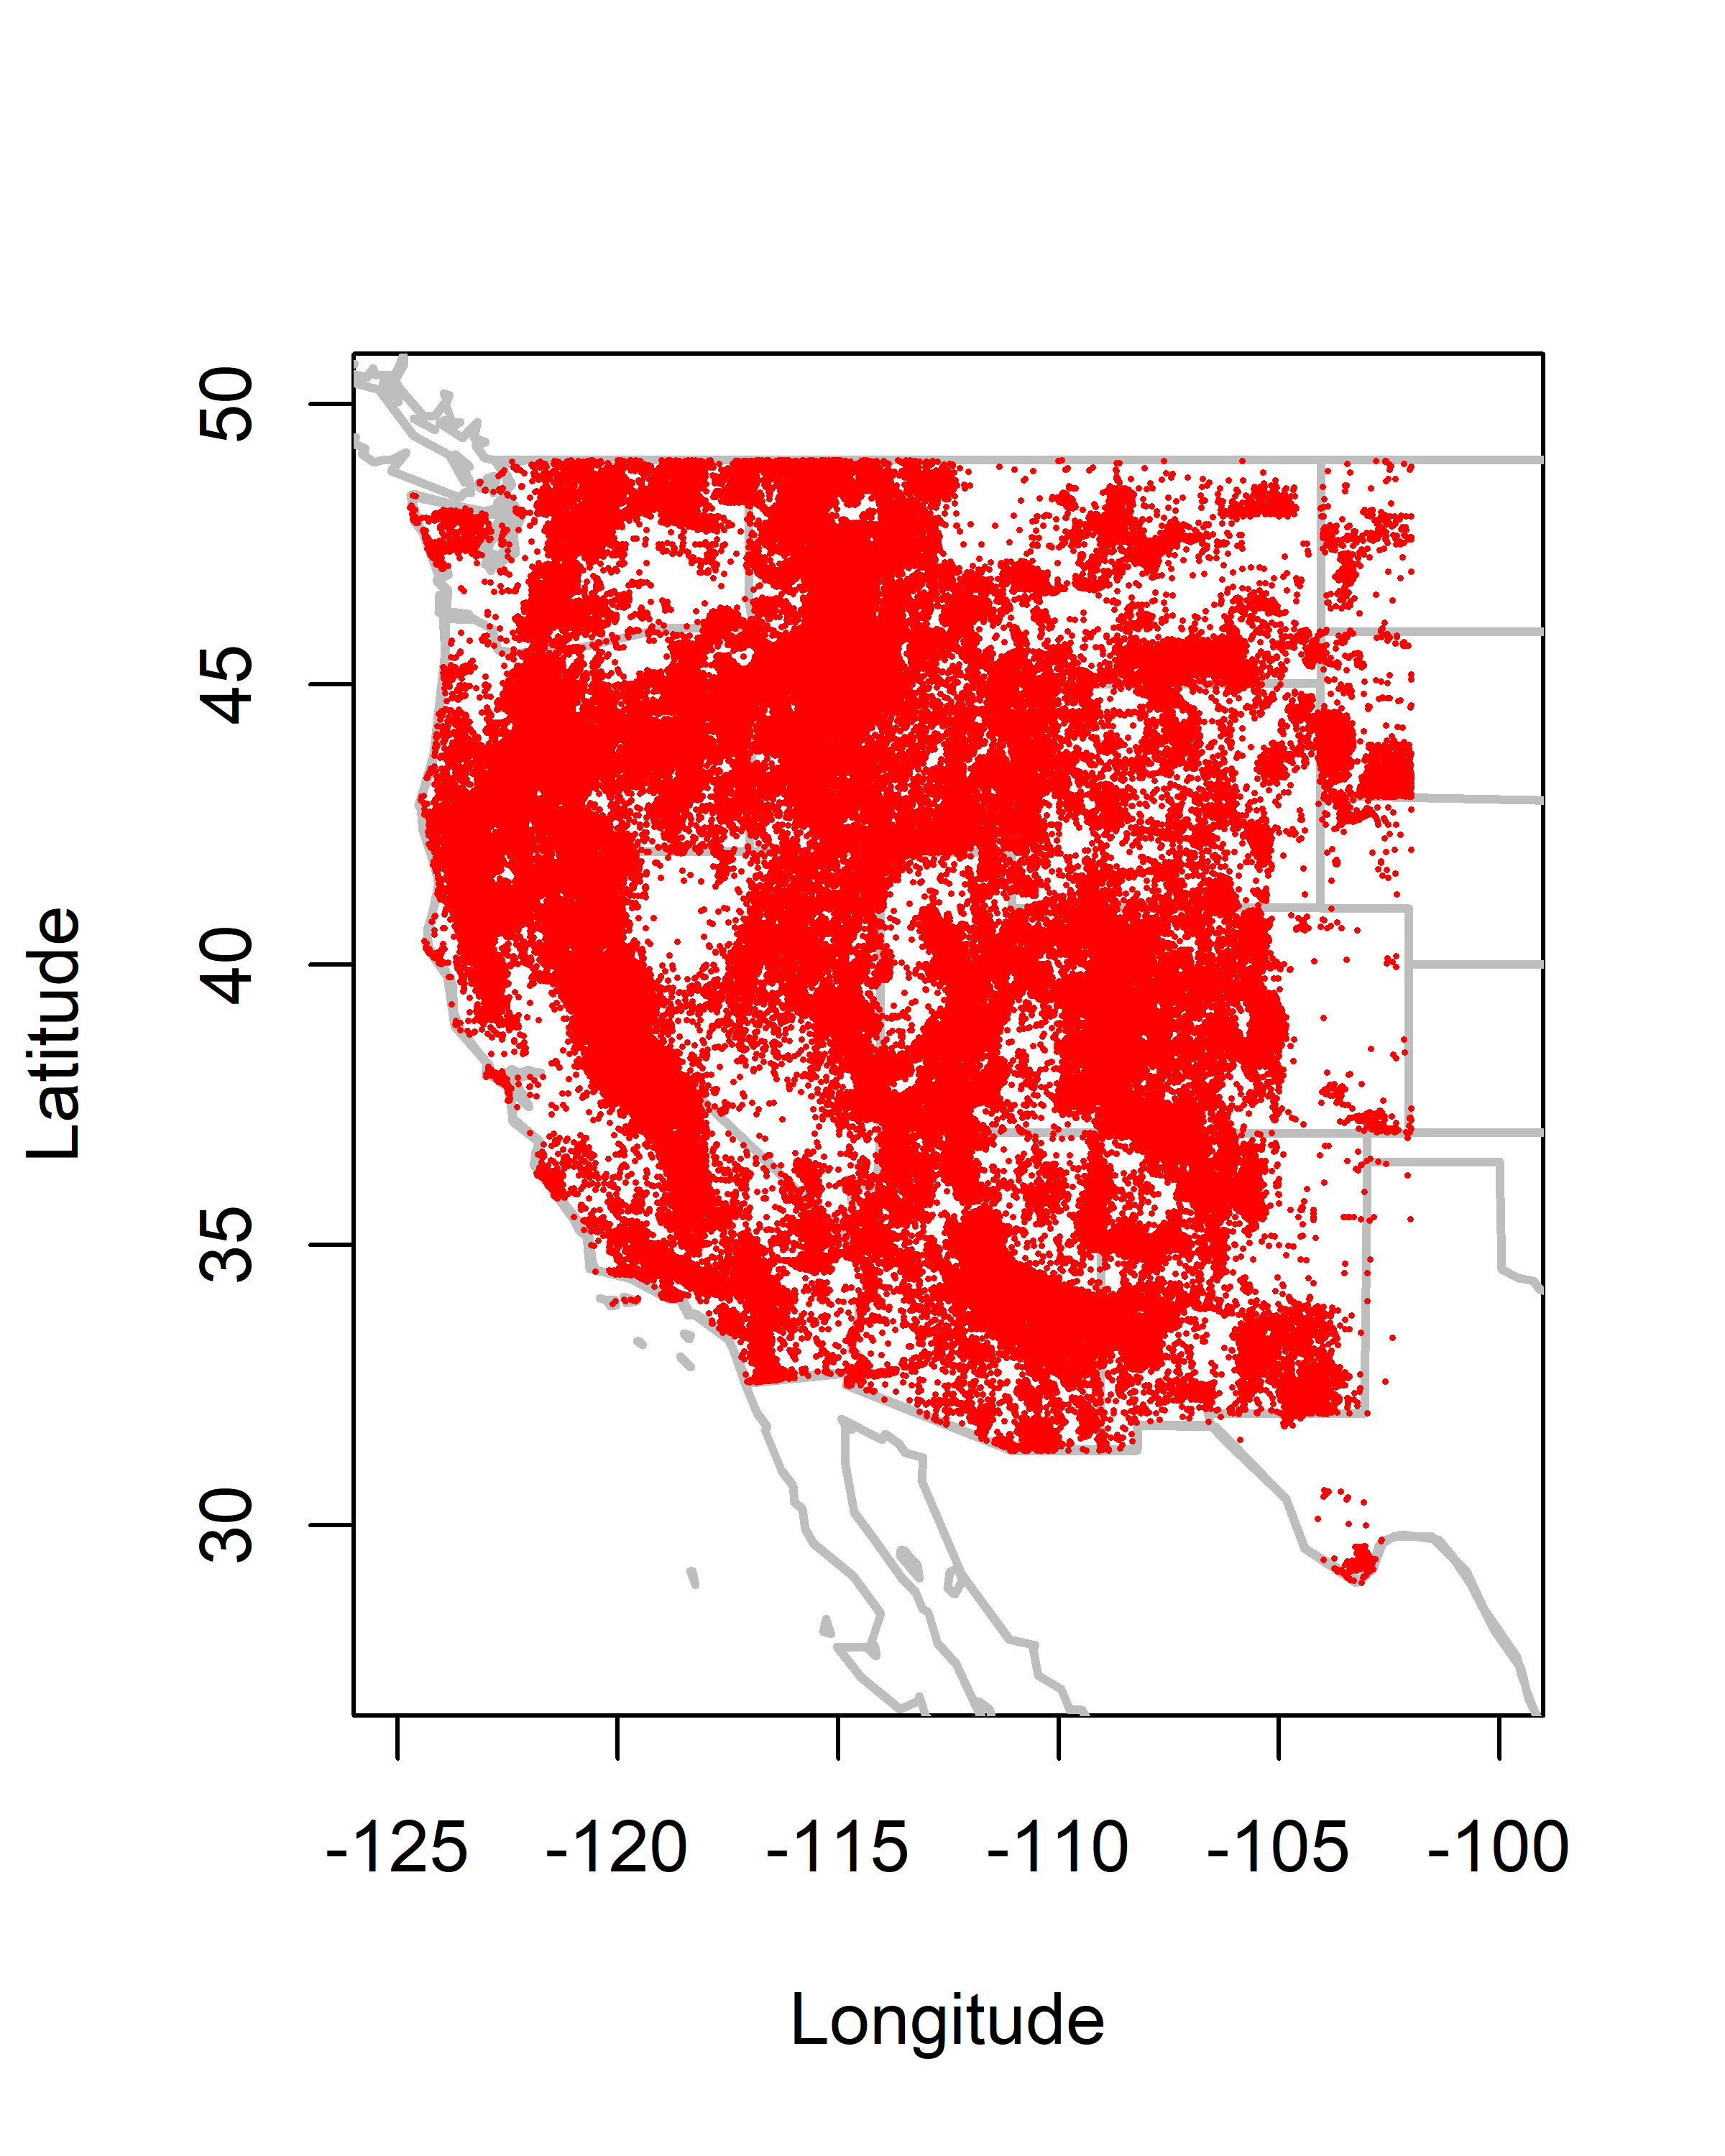
Histograms Western U.S.
hist(nifc.wus$startdaynum, breaks=seq(-0.5,366.5,by=1), freq=-TRUE, ylim=c(0,6000), xlim=c(0,400))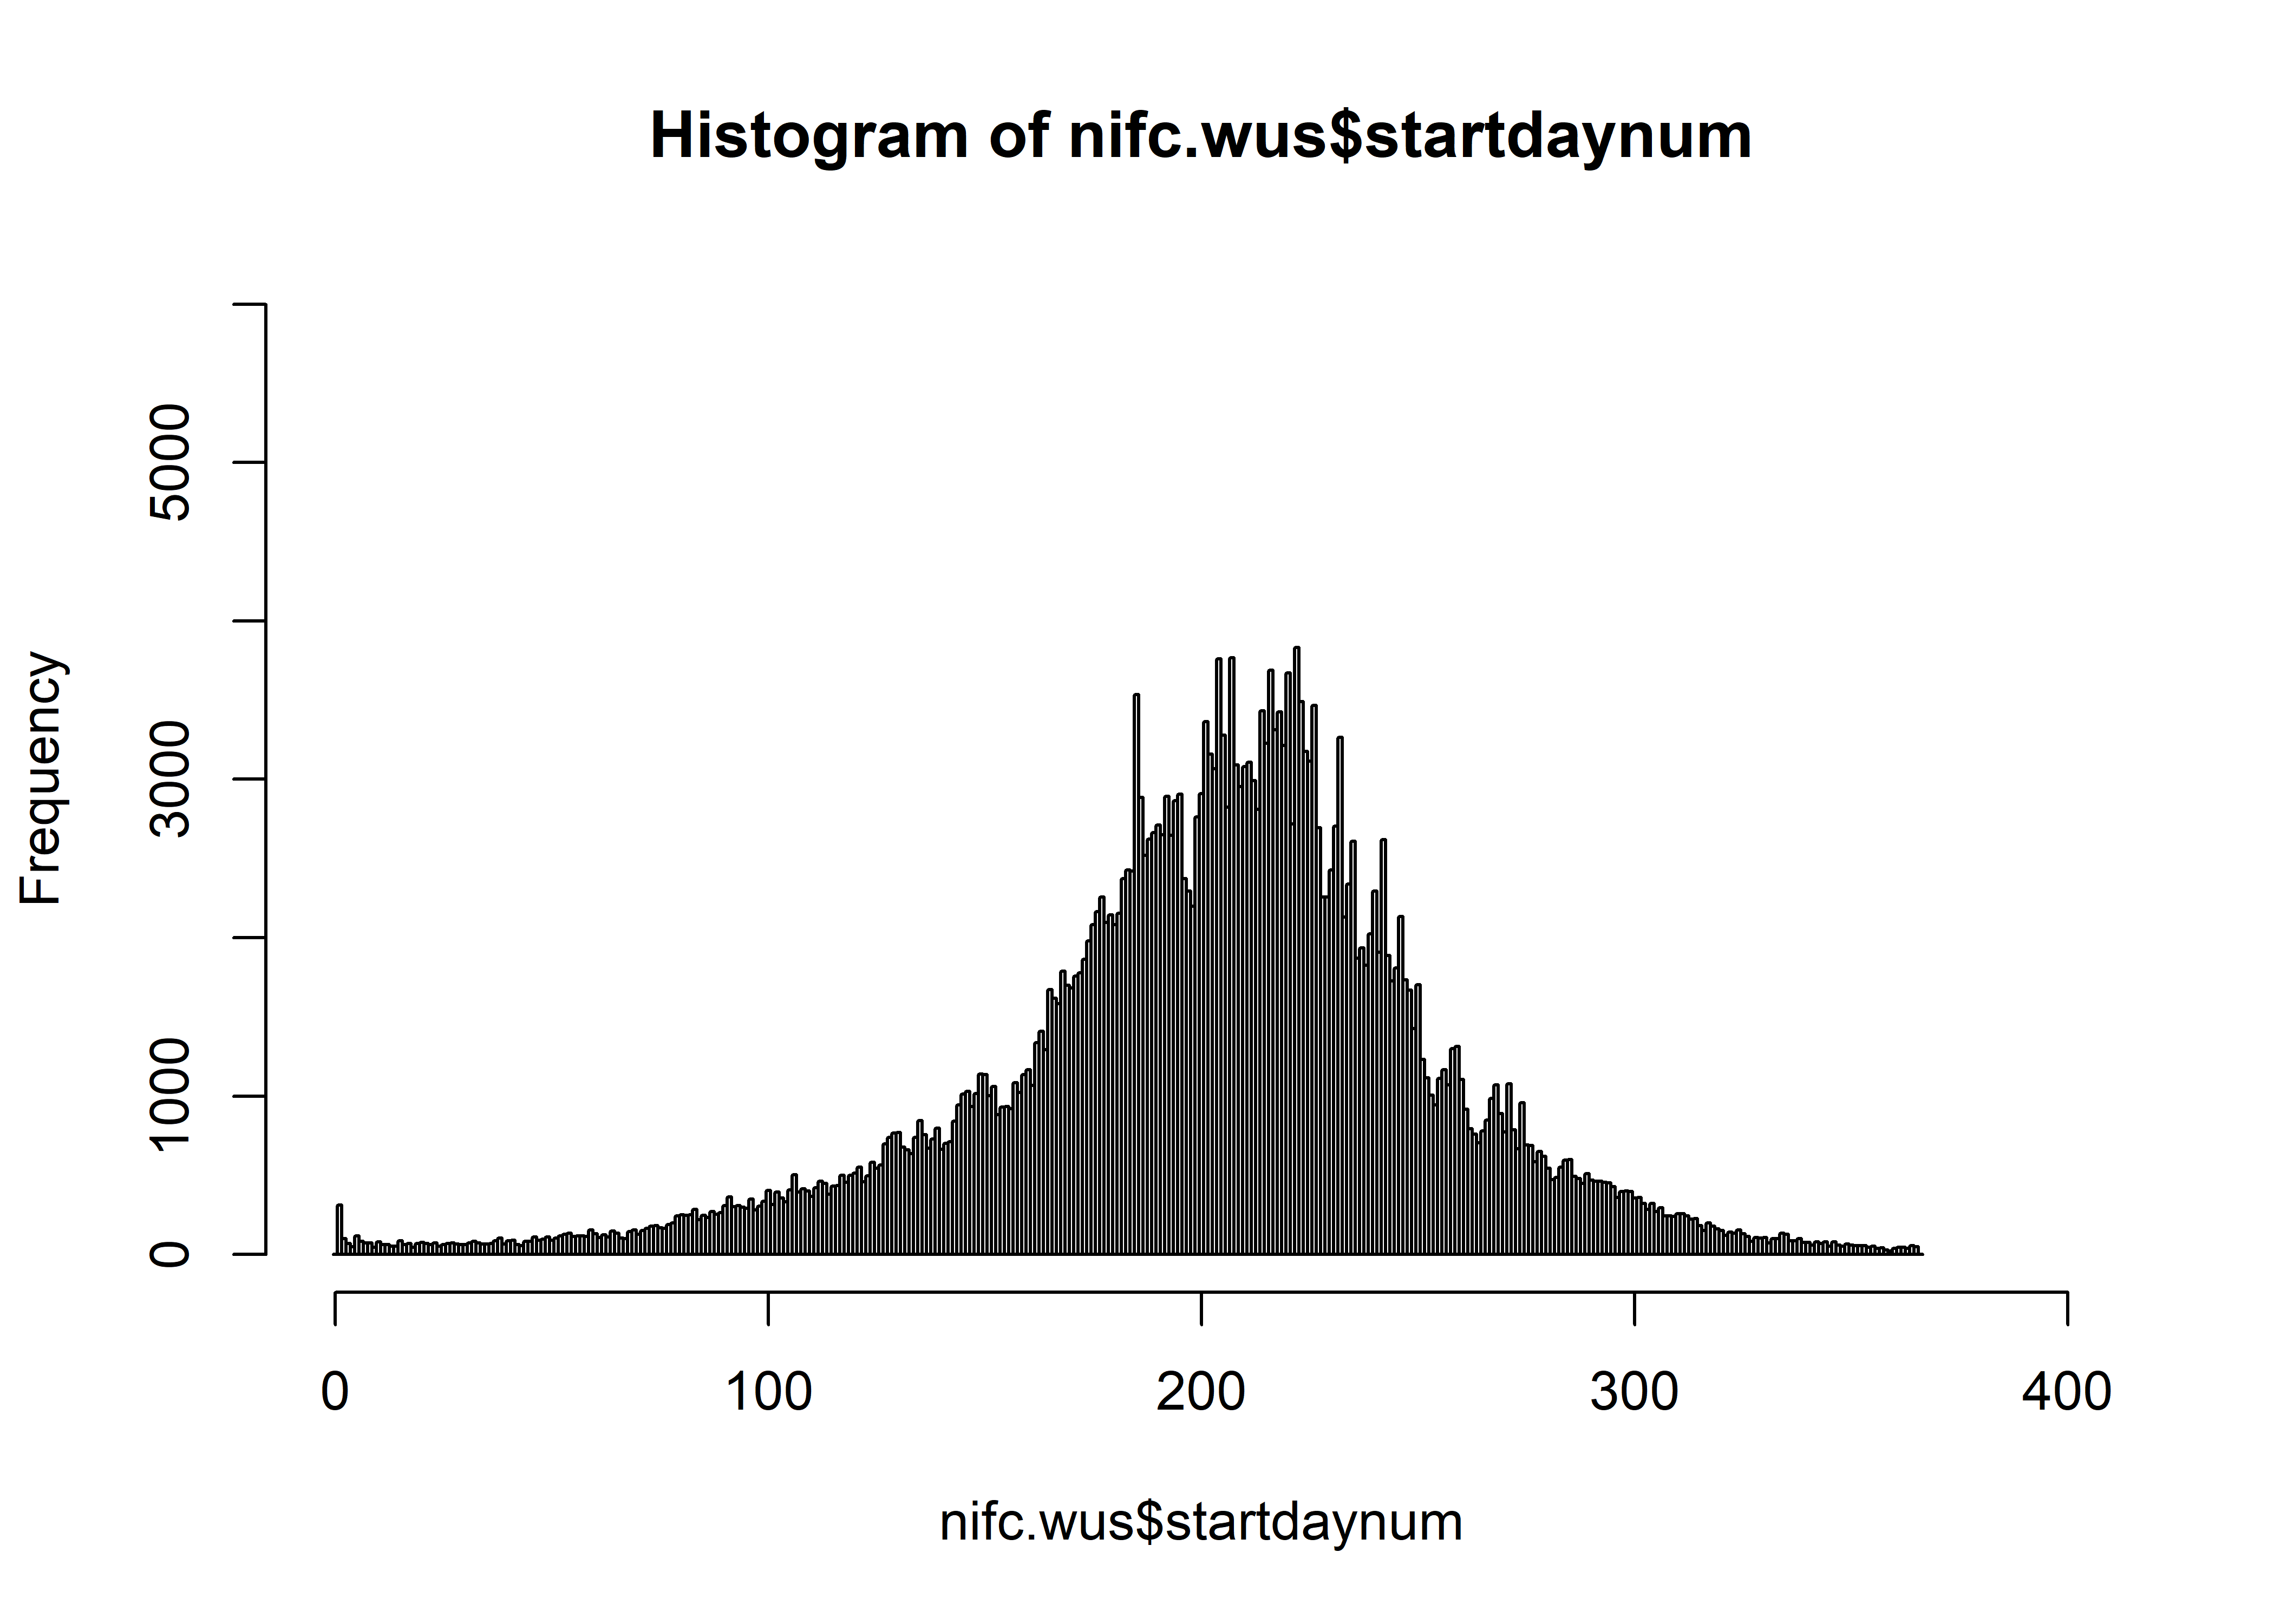
hist(nifc.wus$startdaynum[nifc.wus$CAUSE==1], breaks=seq(-0.5,366.5,by=1), freq=-TRUE,
  xlim=c(0,400), ylim=c(0,6000), main="nifc.wus Natural")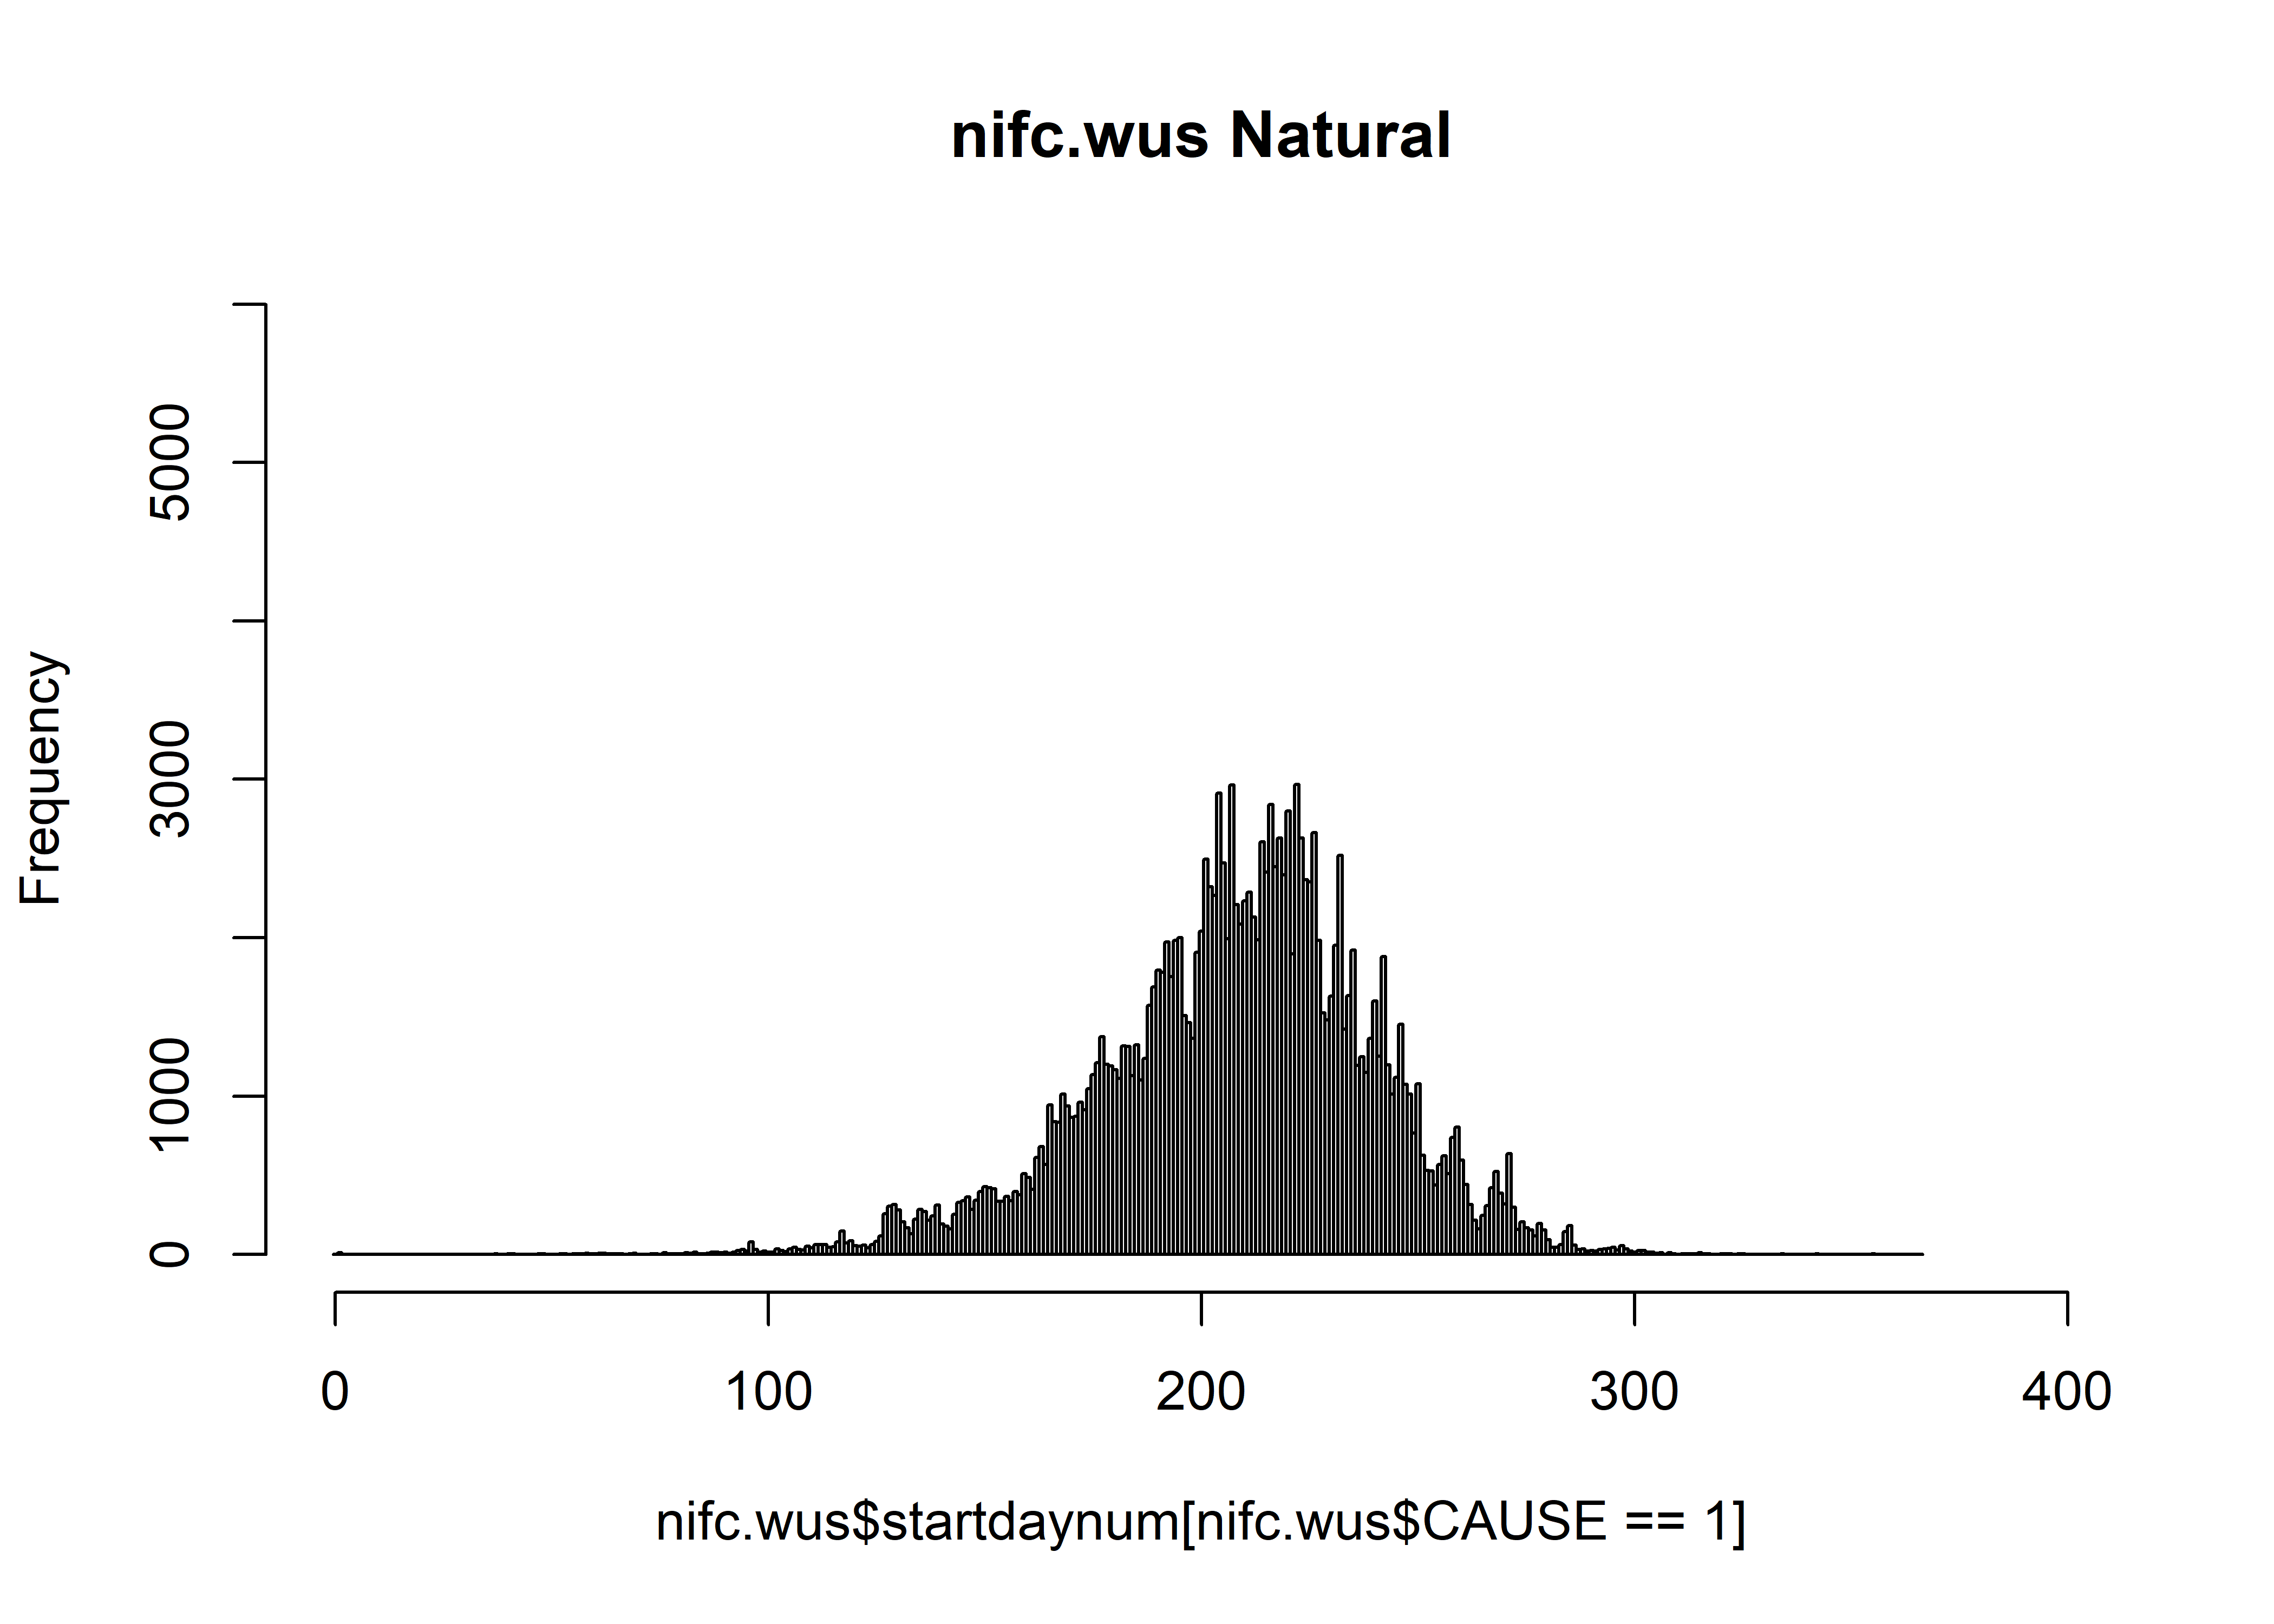
hist(nifc.wus$startdaynum[nifc.wus$CAUSE==2], breaks=seq(-0.5,366.5,by=1), freq=-TRUE,
  xlim=c(0,400), ylim=c(0,6000), main="nifc.wus Human")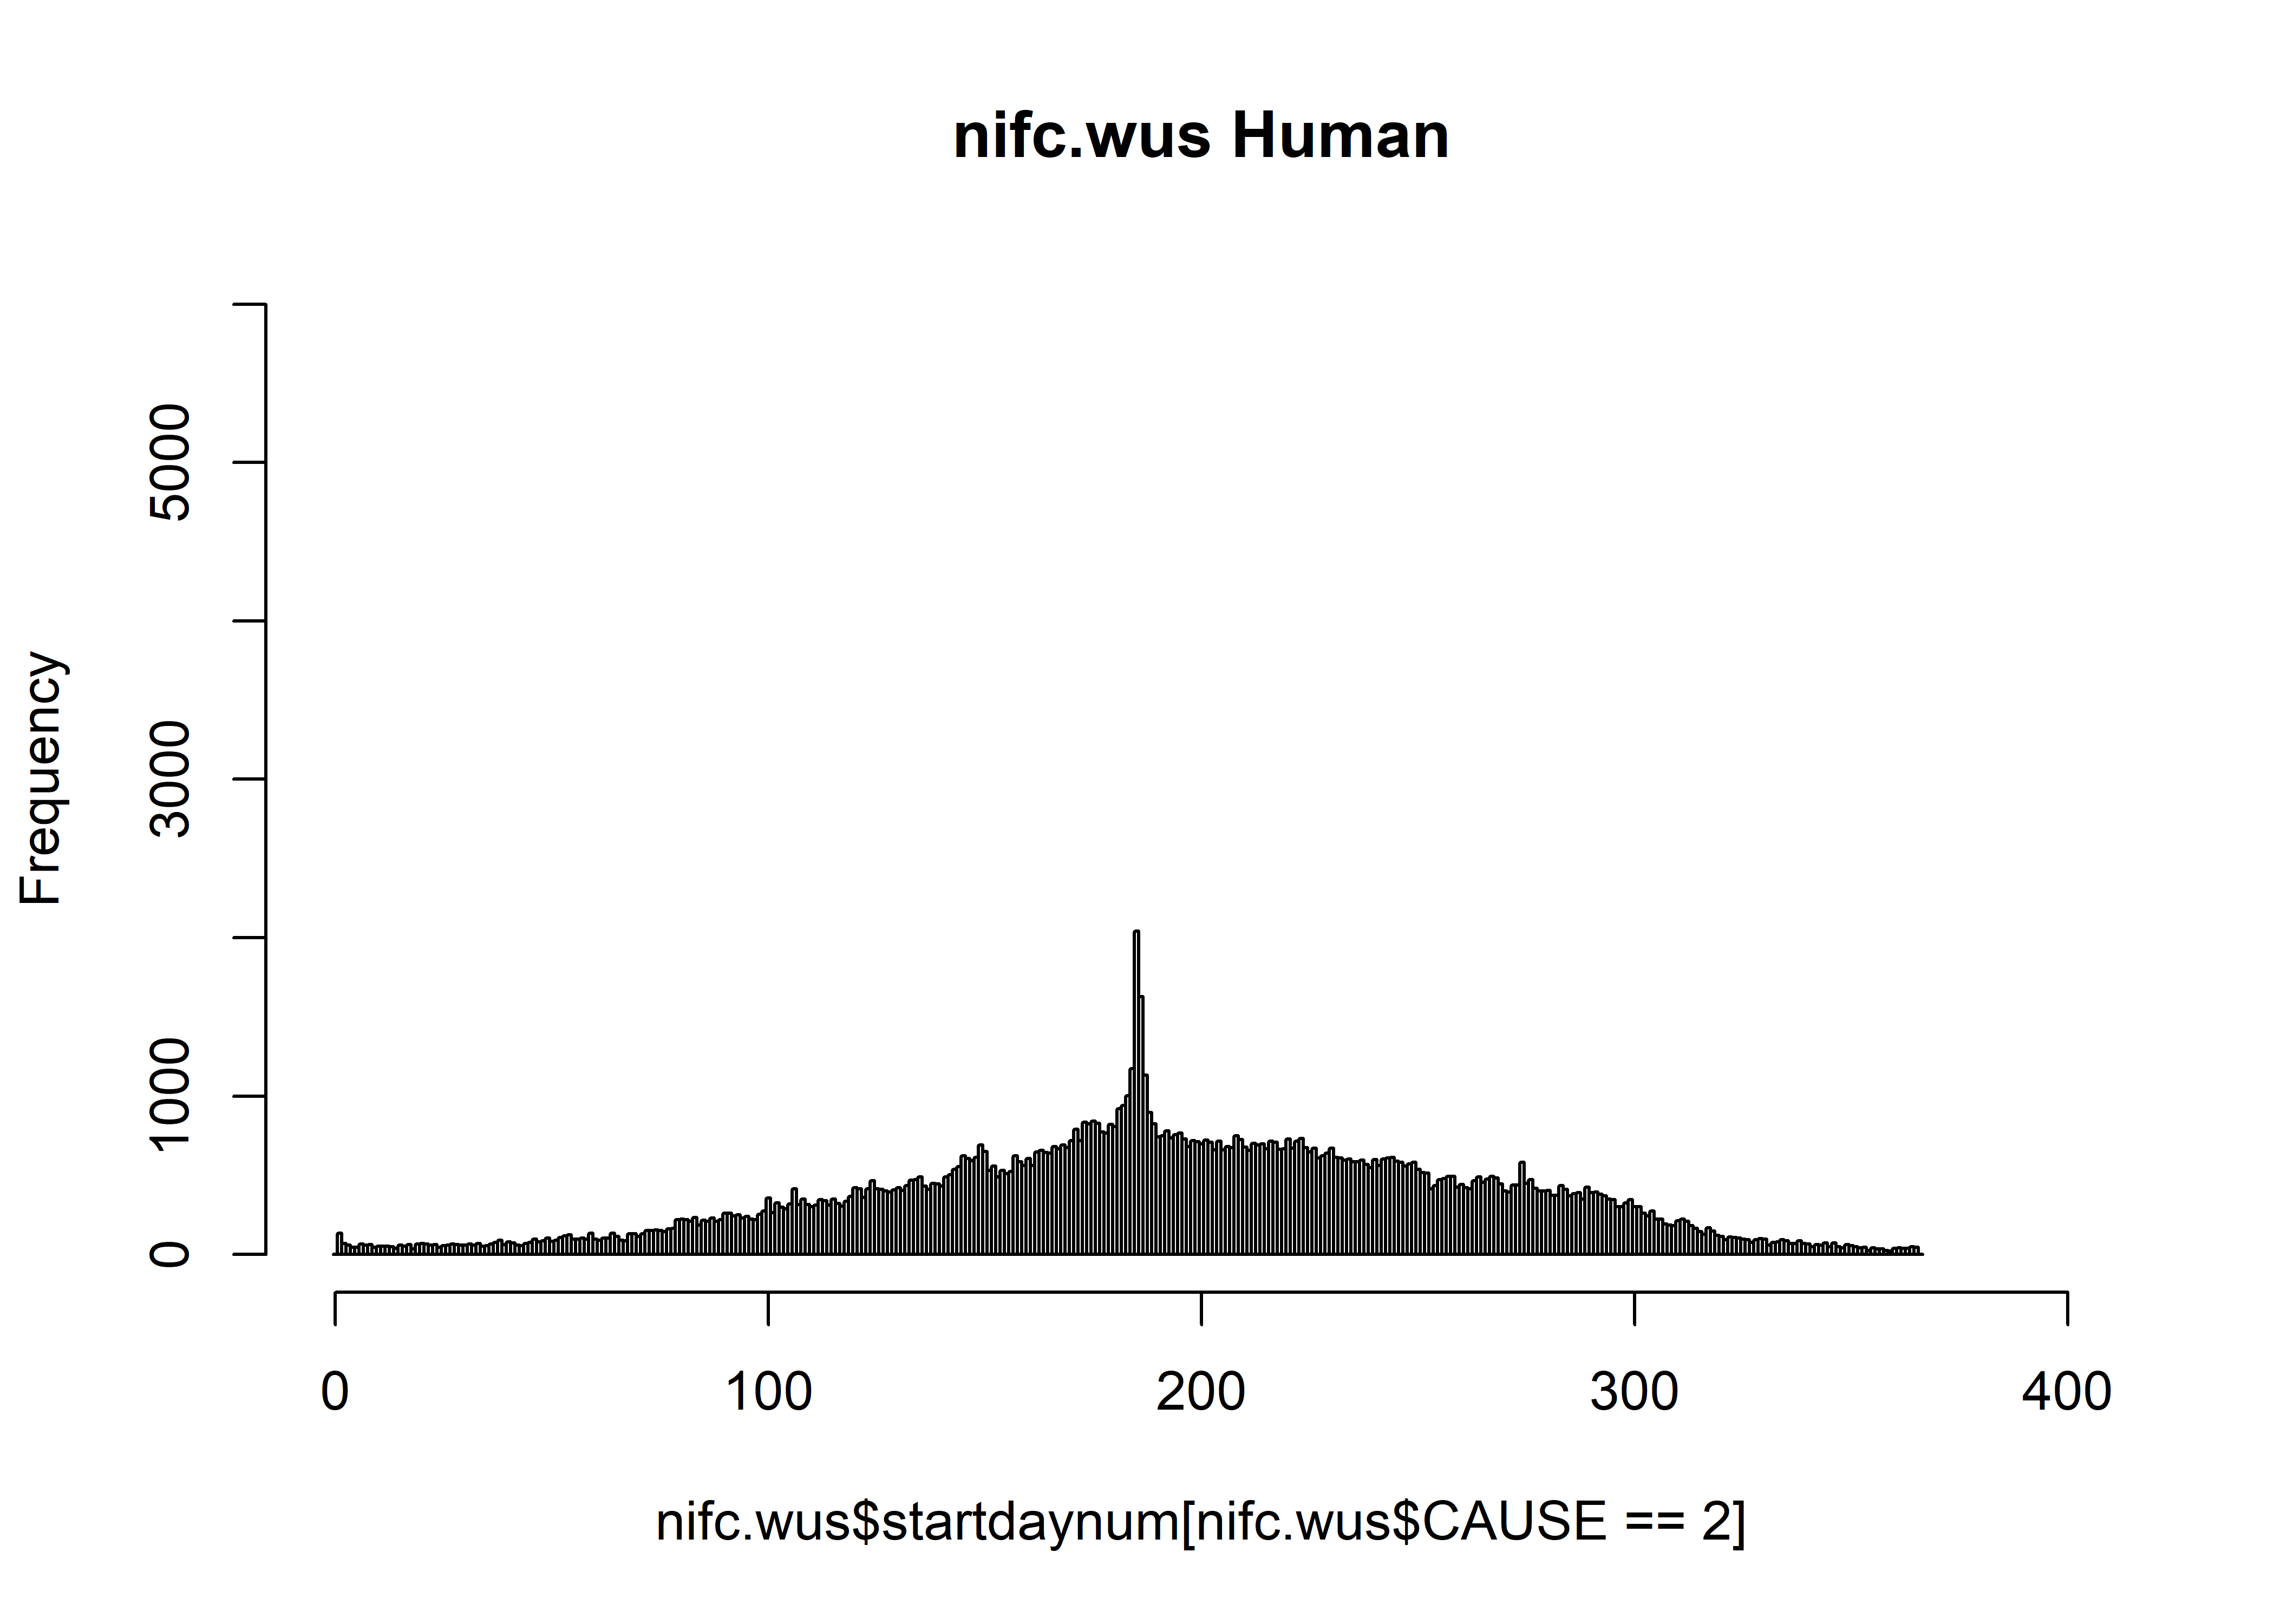
1.3 Alaska Subset
Alaska data
nifcak <- nifc[nifc$LATITUDE >= 55.0 ,]
length(nifcak[,1])
## [1] 7014table(nifcak$CAUSE)##
## 0 1 2
## 895 4012 2016Map the data
plot(nifcak$LATITUDE ~ nifcak$LONGITUDE, ylim=c(50,80), xlim=c(-180,-125), type="n",
  xlab="Longitude", ylab="Latitude")
map("world", add=TRUE, lwd=2, col="gray")
map("state", add=TRUE, lwd=2, col="gray")
points(nifcak$LATITUDE ~ nifcak$LONGITUDE, pch=16, cex=0.2, col="red")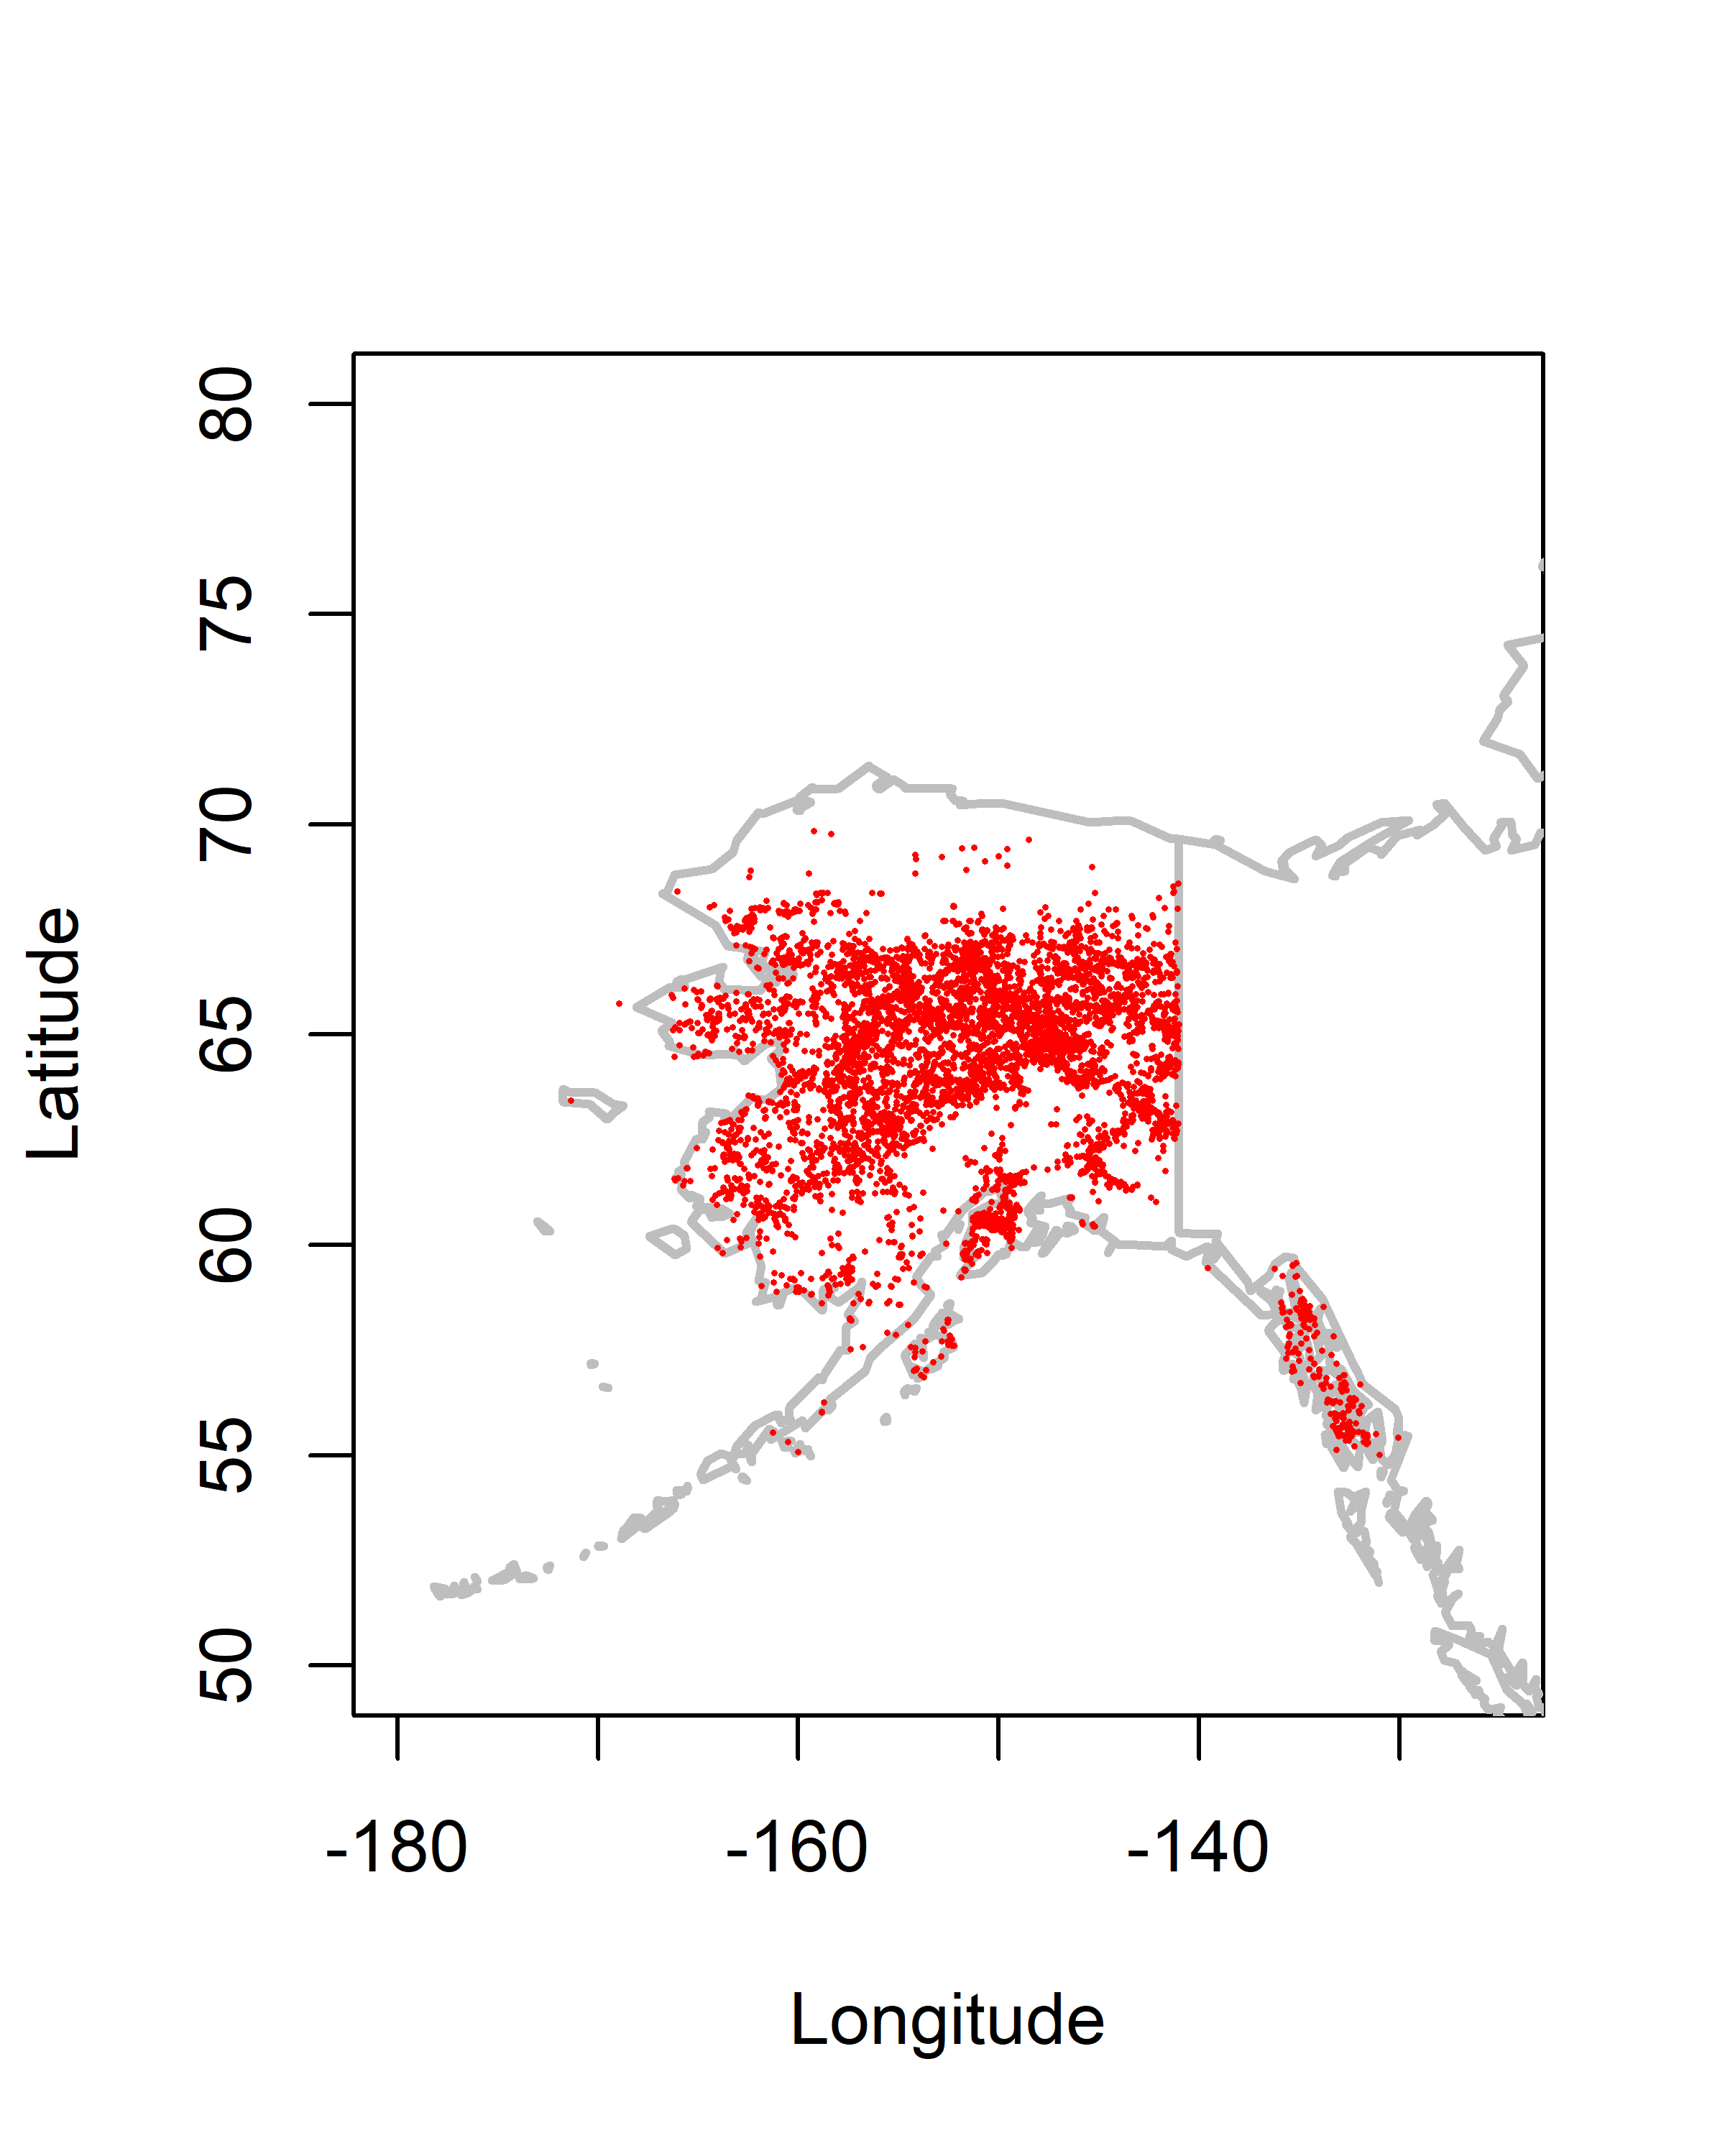
Histograms Alaska U.S.
hist(nifcak$startdaynum, breaks=seq(-0.5,366.5,by=1), freq=-TRUE, ylim=c(0,400), xlim=c(0,400))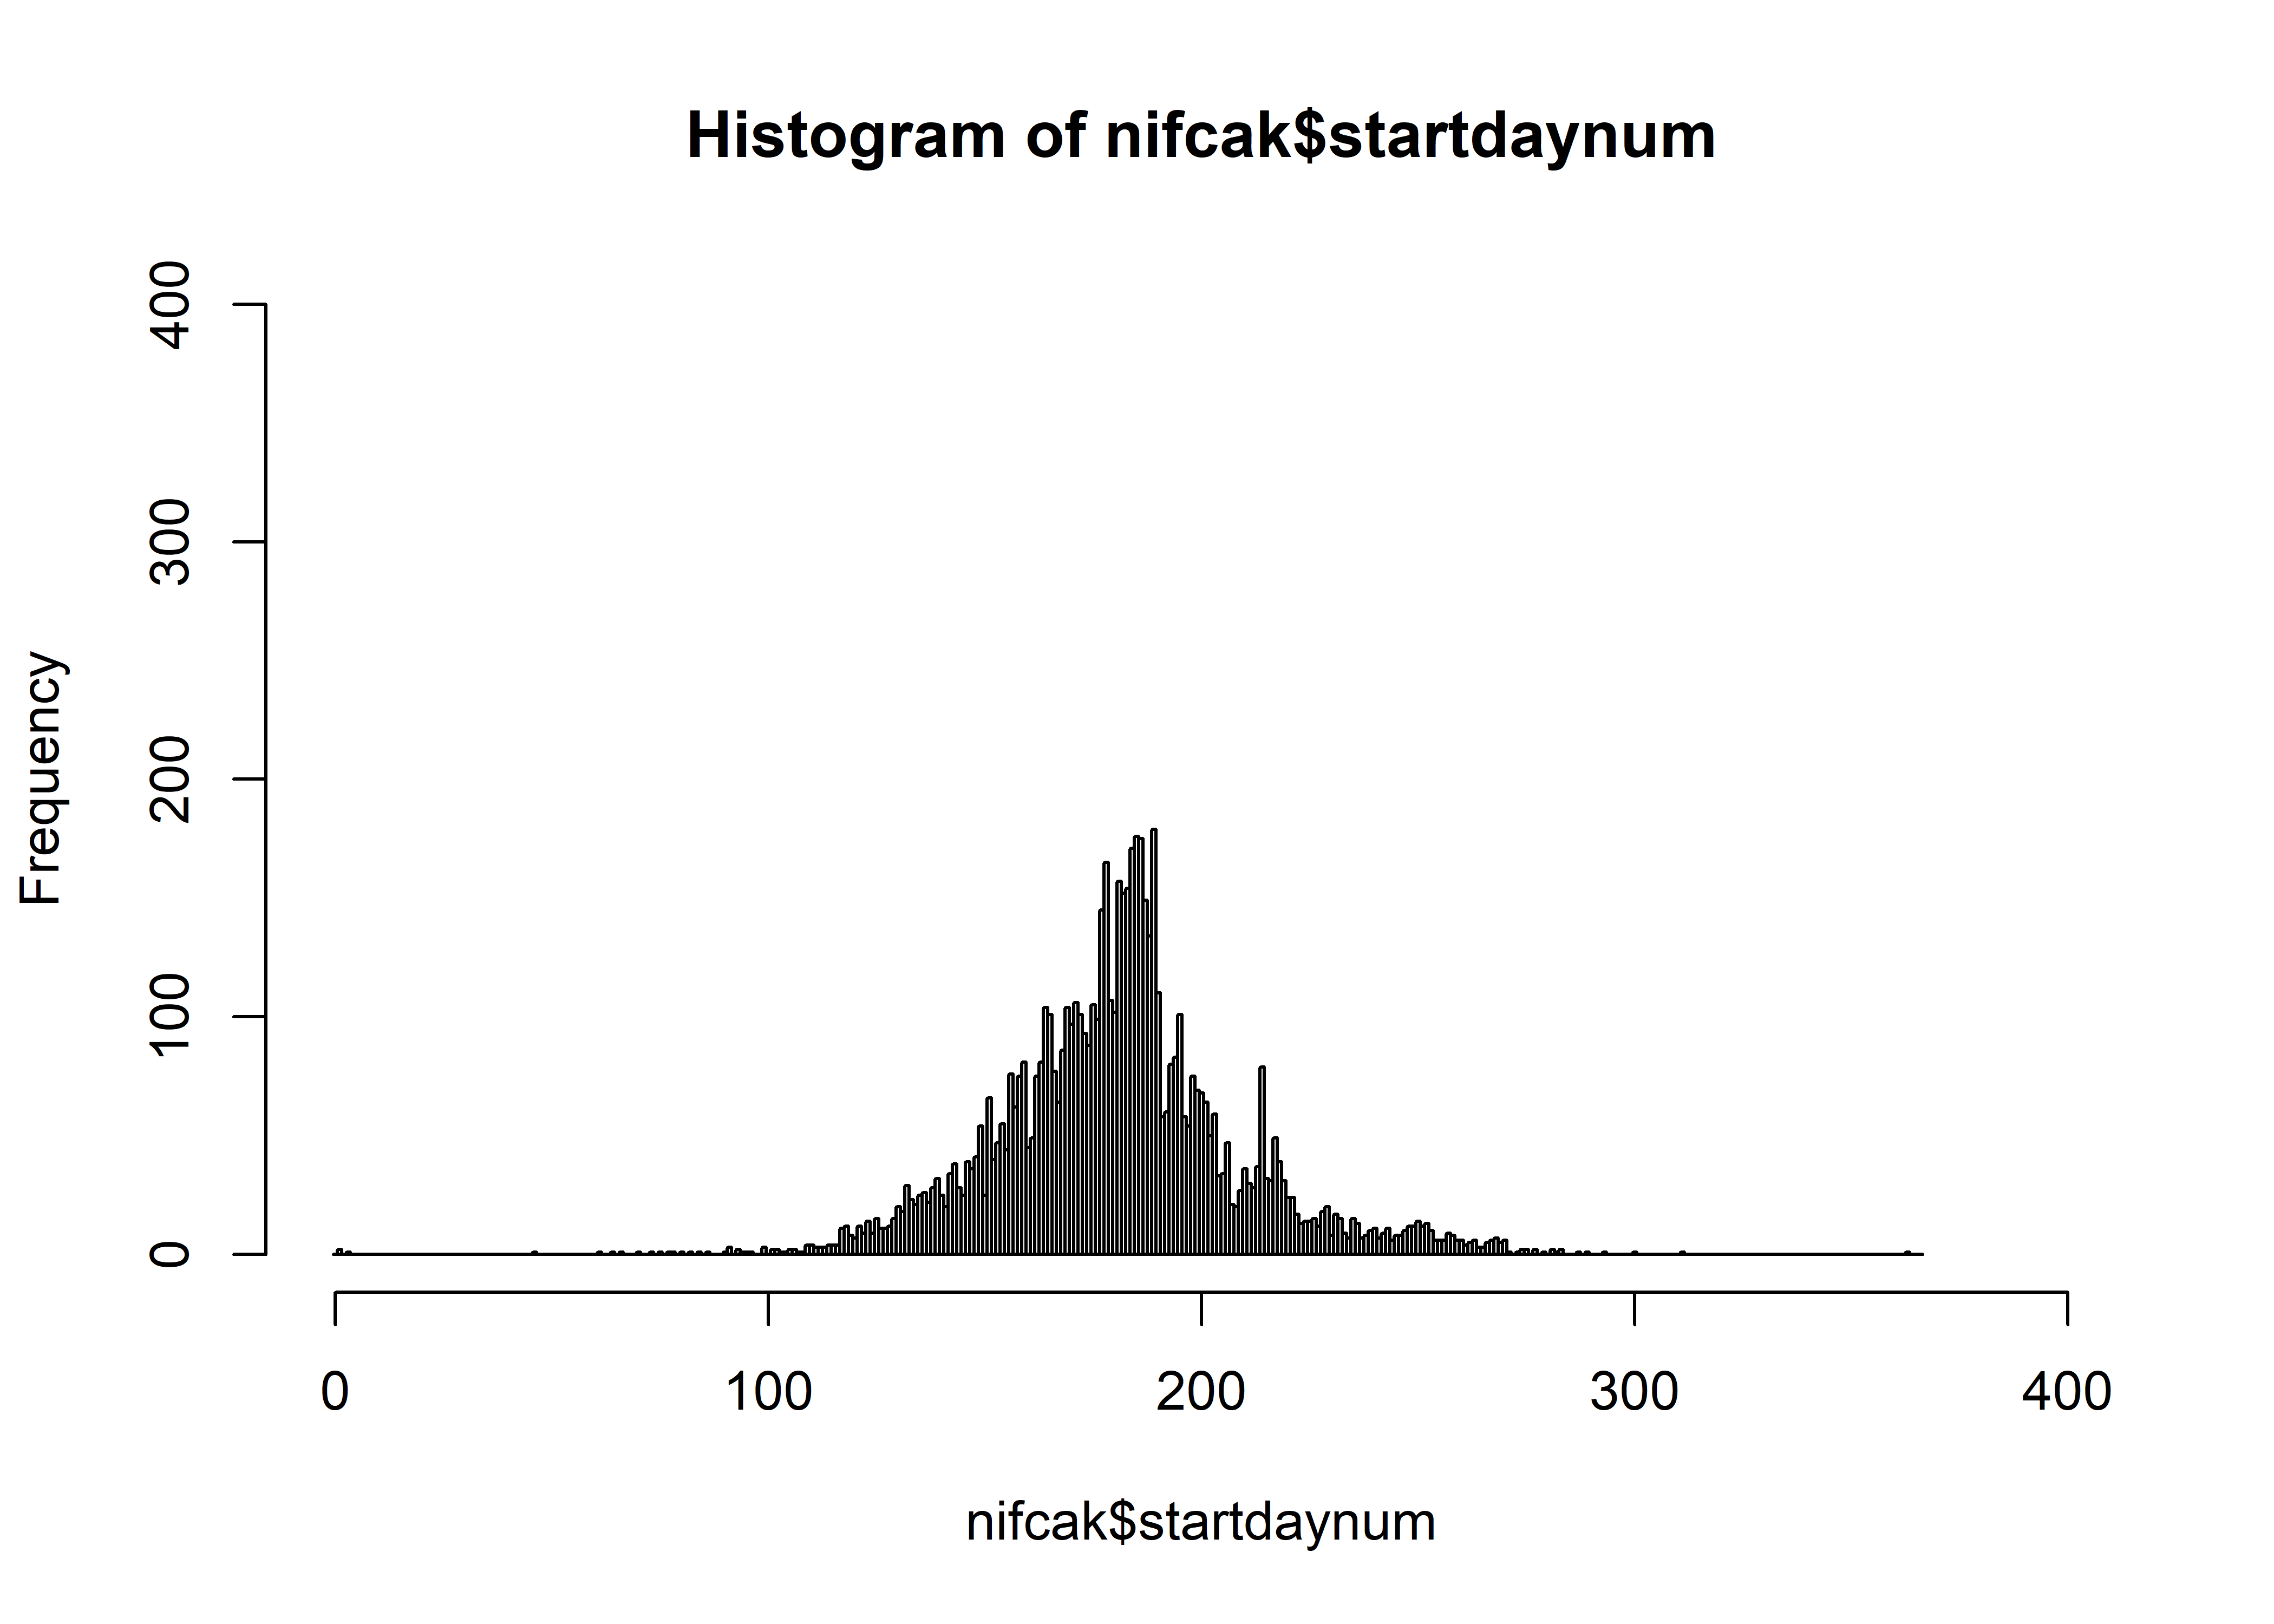
hist(nifcak$startdaynum[nifcak$CAUSE==1], breaks=seq(-0.5,366.5,by=1), freq=-TRUE,
  xlim=c(0,400), ylim=c(0,400), main="nifcak Natural")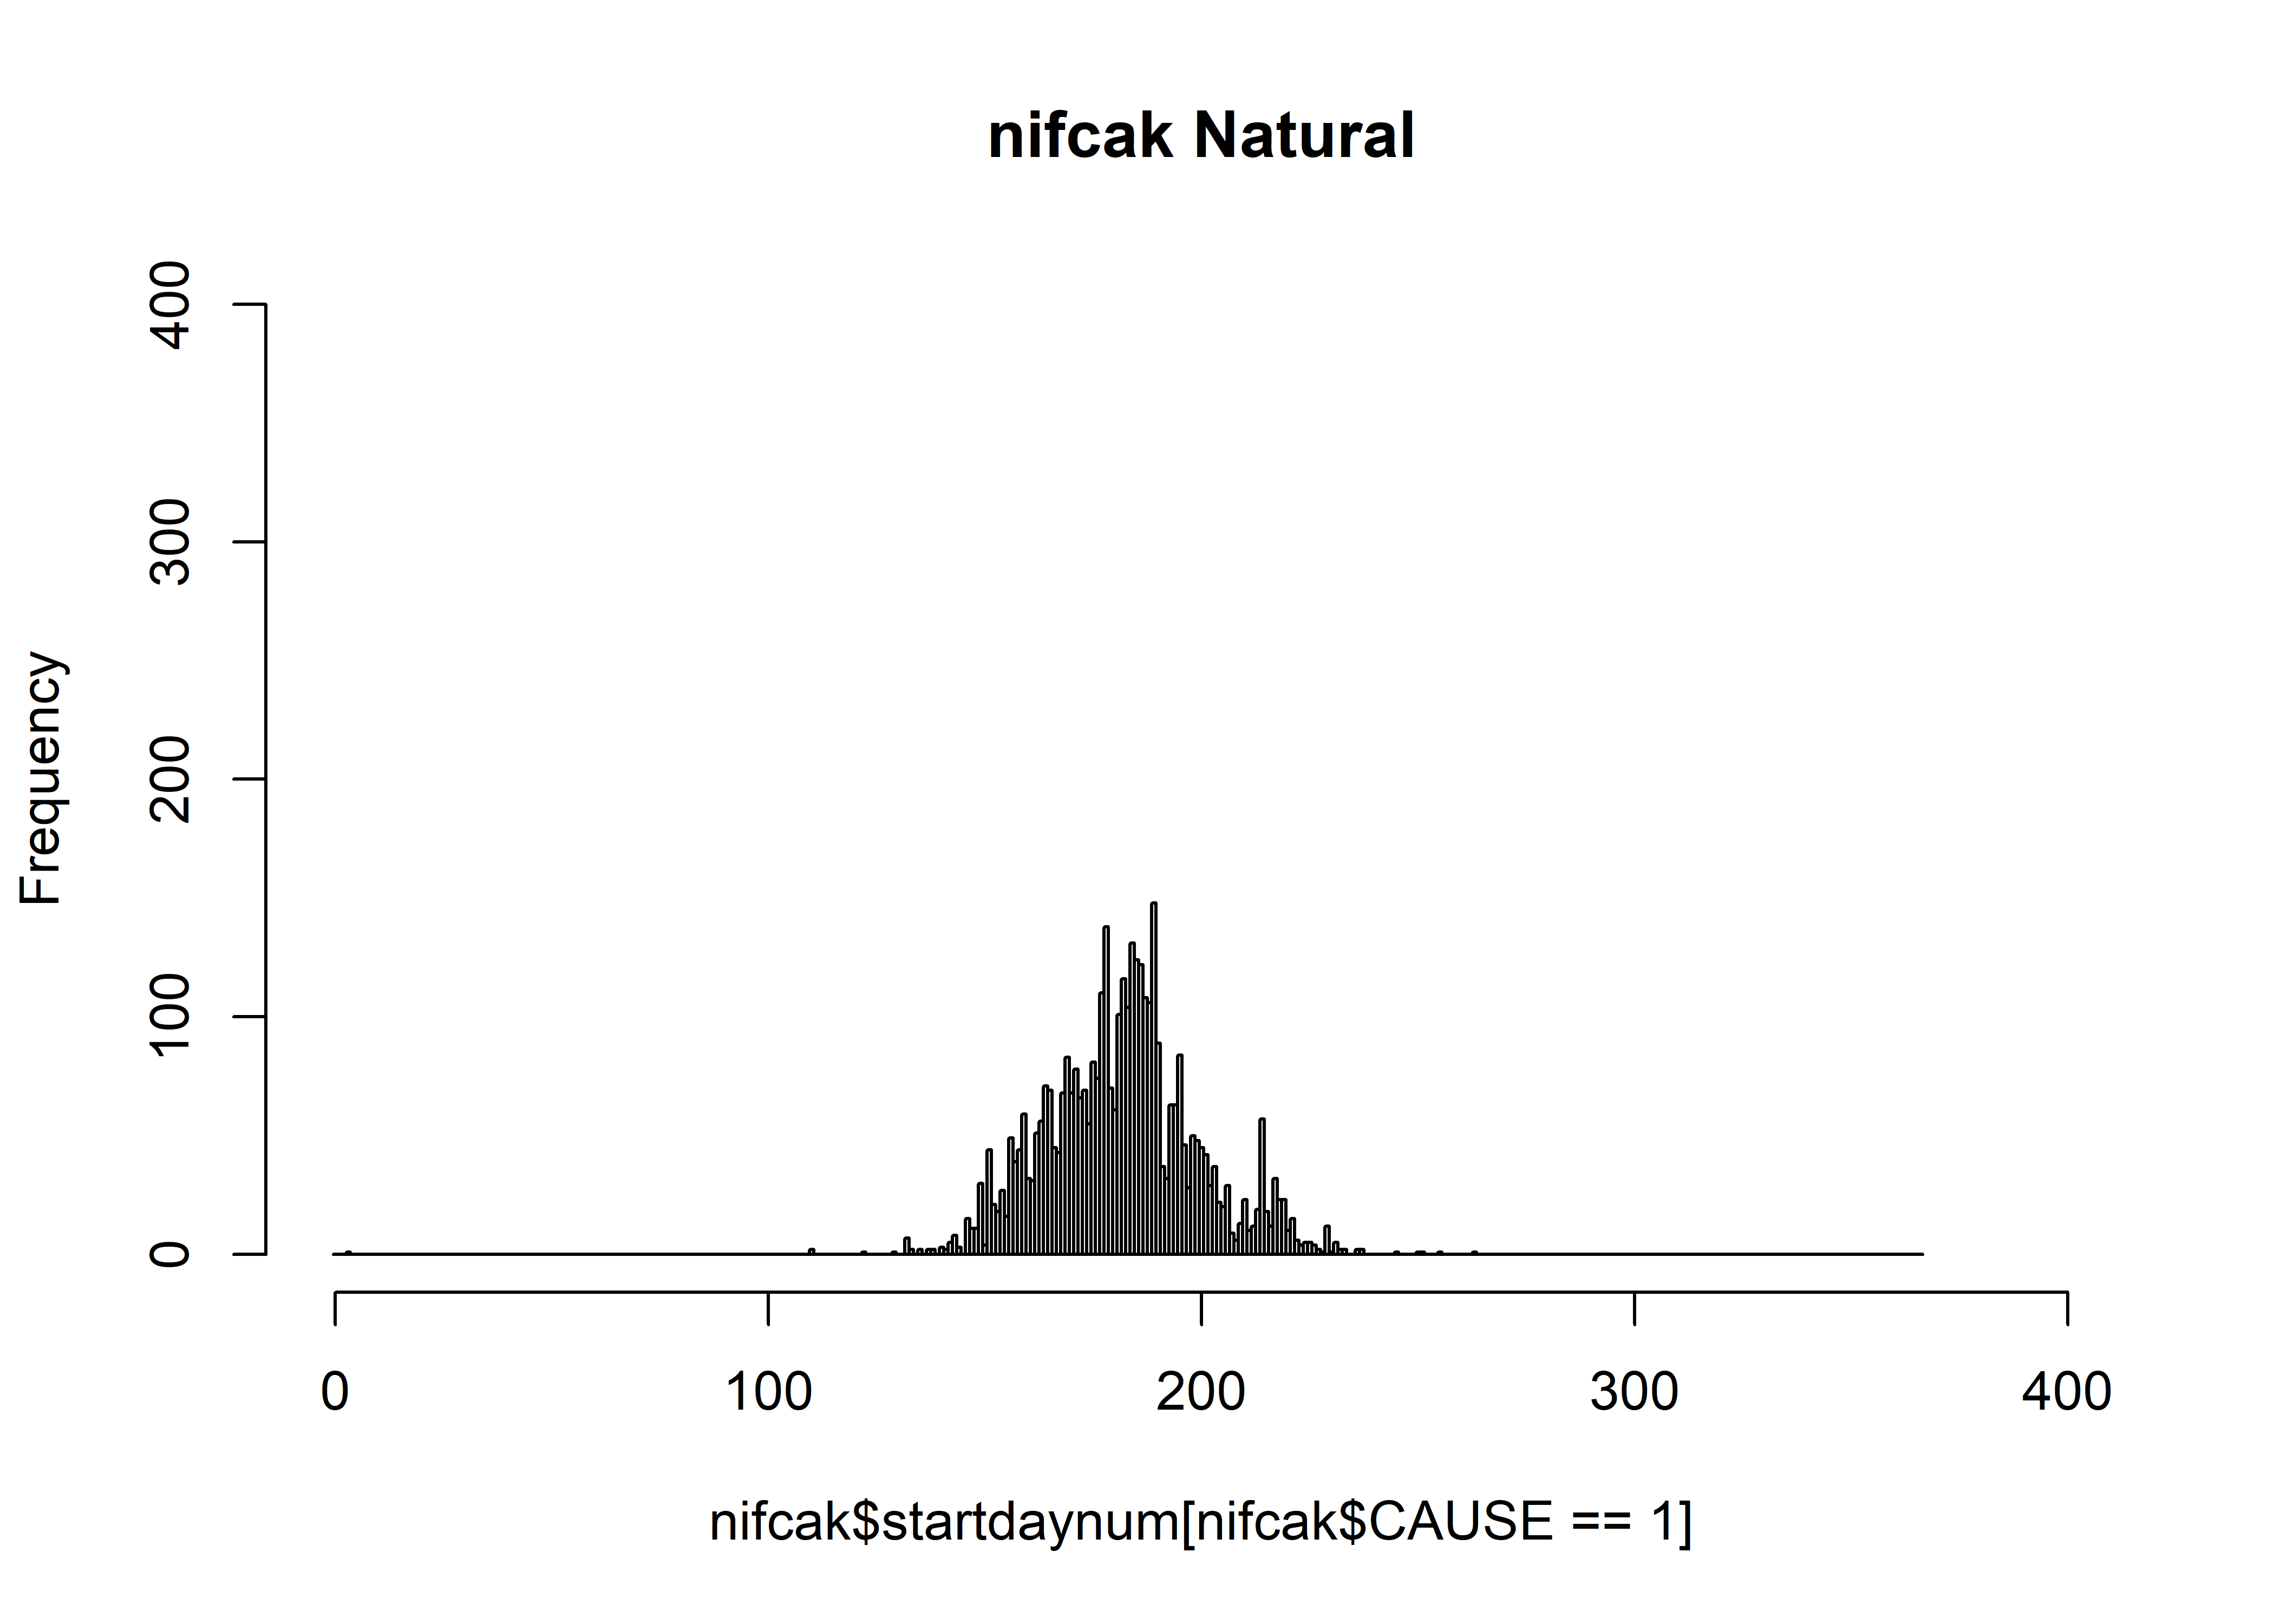
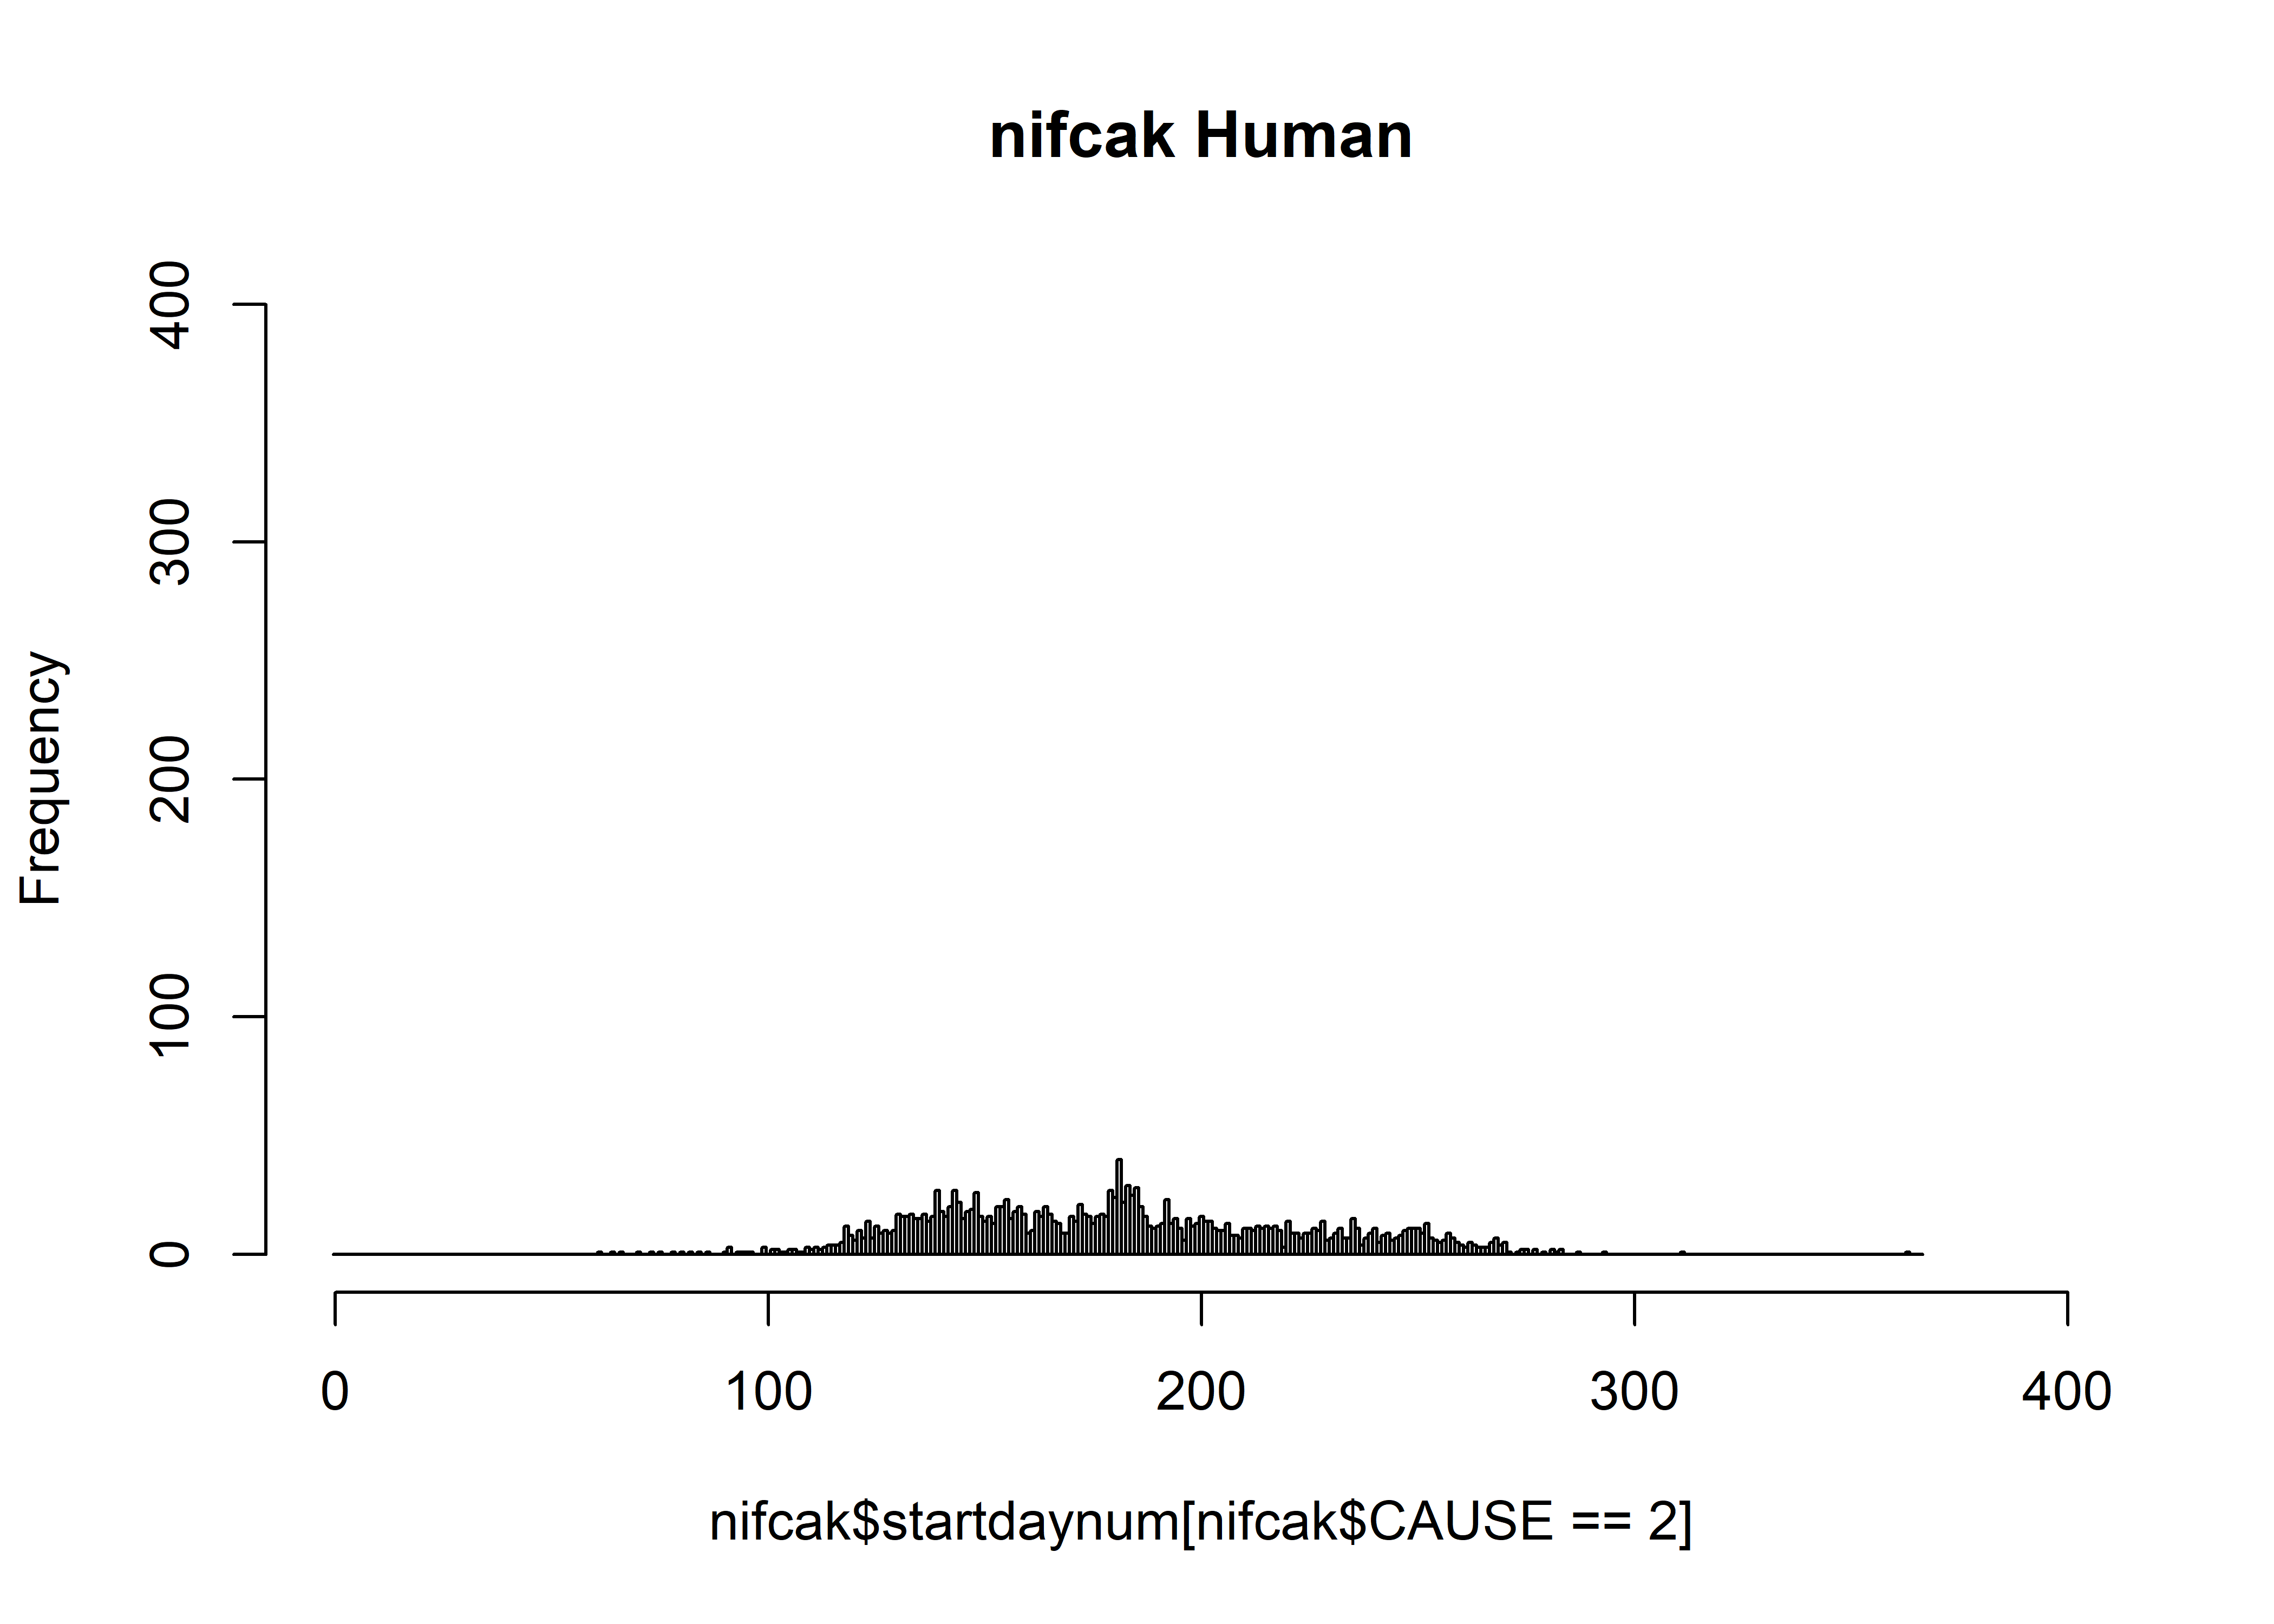
hist(nifcak$startdaynum[nifcak$CAUSE==2], breaks=seq(-0.5,366.5,by=1), freq=-TRUE,
  xlim=c(0,400), ylim=c(0,400), main="nifcak Human")