U.S. and Canada Fire-Size Distribution Comparisons
1 Fire size distributions of U.S. and Canada lightning-started fires
1.1 Small-size fires in general
load("e:/Projects/fire/DailyFireStarts/data/RData/fpafod.RData")
load("e:/Projects/fire/DailyFireStarts/data/RData/cnfdb.RData")
Some statistics on small fires:
- number of Canada fires = 0.0 ha:
35780 - number of Canada fires = 0.001:
395 - number of U.S. fires = 0.001:
120 - number of Canada fires = 0.01
19582 - number of U.S. fires = 0.01
27027
2 Size distributions of lightning-started fires
Examine the size distributions of lighting-started fires in the FPA-FOD adn Canadian data sets, restricted to the the temporal coverage of the FPA-FOD data. The idea here is to compare the low-end of the distributions to examine the impact of the different recording units (acres, hectares) and the practical precision of each.
Trim Canadian data to 1992-2013
cnfdb <- cnfdb[cnfdb$YEAR >= 1992 & cnfdb$YEAR <= 2013, ]
max(cnfdb$YEAR); min(cnfdb$YEAR)
## [1] 2013## [1] 1992Get lightning fires
fpafod_lt <- fpafod[fpafod$STAT_CAUSE_CODE == 1 ,]
fpafod_nfires <- length(fpafod_lt[,1])
fpafod_nfires
## [1] 260311cnfdb_lt <- cnfdb[cnfdb$CAUSE=="L" ,]
cnfdb_nfires <- length(cnfdb_lt[,1])
cnfdb_nfires## [1] 74823Sort the data by fire size
fpafod.index <-order(fpafod_lt$AREA_HA, na.last=FALSE)
head(fpafod_lt$AREA_HA[fpafod.index])
## [1] 0.0000404686 0.0000404686 0.0000809372 0.0001857509 0.0004046860 0.0004046860tail(fpafod_lt$AREA_HA[fpafod.index])## [1] 195576.7 202320.7 209254.2 217570.1 225895.0 245622.1fpafod_lt <- fpafod_lt[fpafod.index ,]
fpafod_lt$rank <- seq(fpafod_nfires,1)
head(cbind(fpafod_lt$AREA_HA,fpafod_lt$rank))## [,1] [,2]
## [1,] 0.0000404686 260311
## [2,] 0.0000404686 260310
## [3,] 0.0000809372 260309
## [4,] 0.0001857509 260308
## [5,] 0.0004046860 260307
## [6,] 0.0004046860 260306tail(cbind(fpafod_lt$AREA_HA,fpafod_lt$rank))## [,1] [,2]
## [260306,] 195576.7 6
## [260307,] 202320.7 5
## [260308,] 209254.2 4
## [260309,] 217570.1 3
## [260310,] 225895.0 2
## [260311,] 245622.1 1cnfdb.index <-order(cnfdb_lt$SIZE_HA, na.last=FALSE)
head(cnfdb_lt$SIZE_HA[cnfdb.index])## [1] NA NA NA NA NA NAtail(cnfdb_lt$SIZE_HA[cnfdb.index])## [1] 428100.0 438000.0 453144.0 466420.3 501689.1 553680.0cnfdb_lt <- cnfdb_lt[cnfdb.index ,]
cnfdb_lt$rank <- seq(cnfdb_nfires,1)
head(cbind(cnfdb_lt$SIZE_HA,cnfdb_lt$rank))## [,1] [,2]
## [1,] NA 74823
## [2,] NA 74822
## [3,] NA 74821
## [4,] NA 74820
## [5,] NA 74819
## [6,] NA 74818#plot(log10(fpafod_lt$AREA_HA), log10(fpafod_lt$rank/fpafod_nfires), cex=0.5, col="red", xlim=c(-4,6))
#points(log10(cnfdb_lt$SIZE_HA), log10(cnfdb_lt$rank/cnfdb_nfires), cex=0.5, col="blue")
plot(log10(fpafod_lt$AREA_HA), log10(fpafod_lt$rank/fpafod_nfires), type="l", col="red", xlim=c(0,6))
lines(log10(cnfdb_lt$SIZE_HA), log10(cnfdb_lt$rank/cnfdb_nfires), cex=0.5, col="blue")## Warning in lines(log10(cnfdb_lt$SIZE_HA), log10(cnfdb_lt$rank/cnfdb_nfires), : NaNs producedlegend("bottomleft", legend=c("FPA-FOD","CNFDB"), lwd=2, col=c("red","blue"))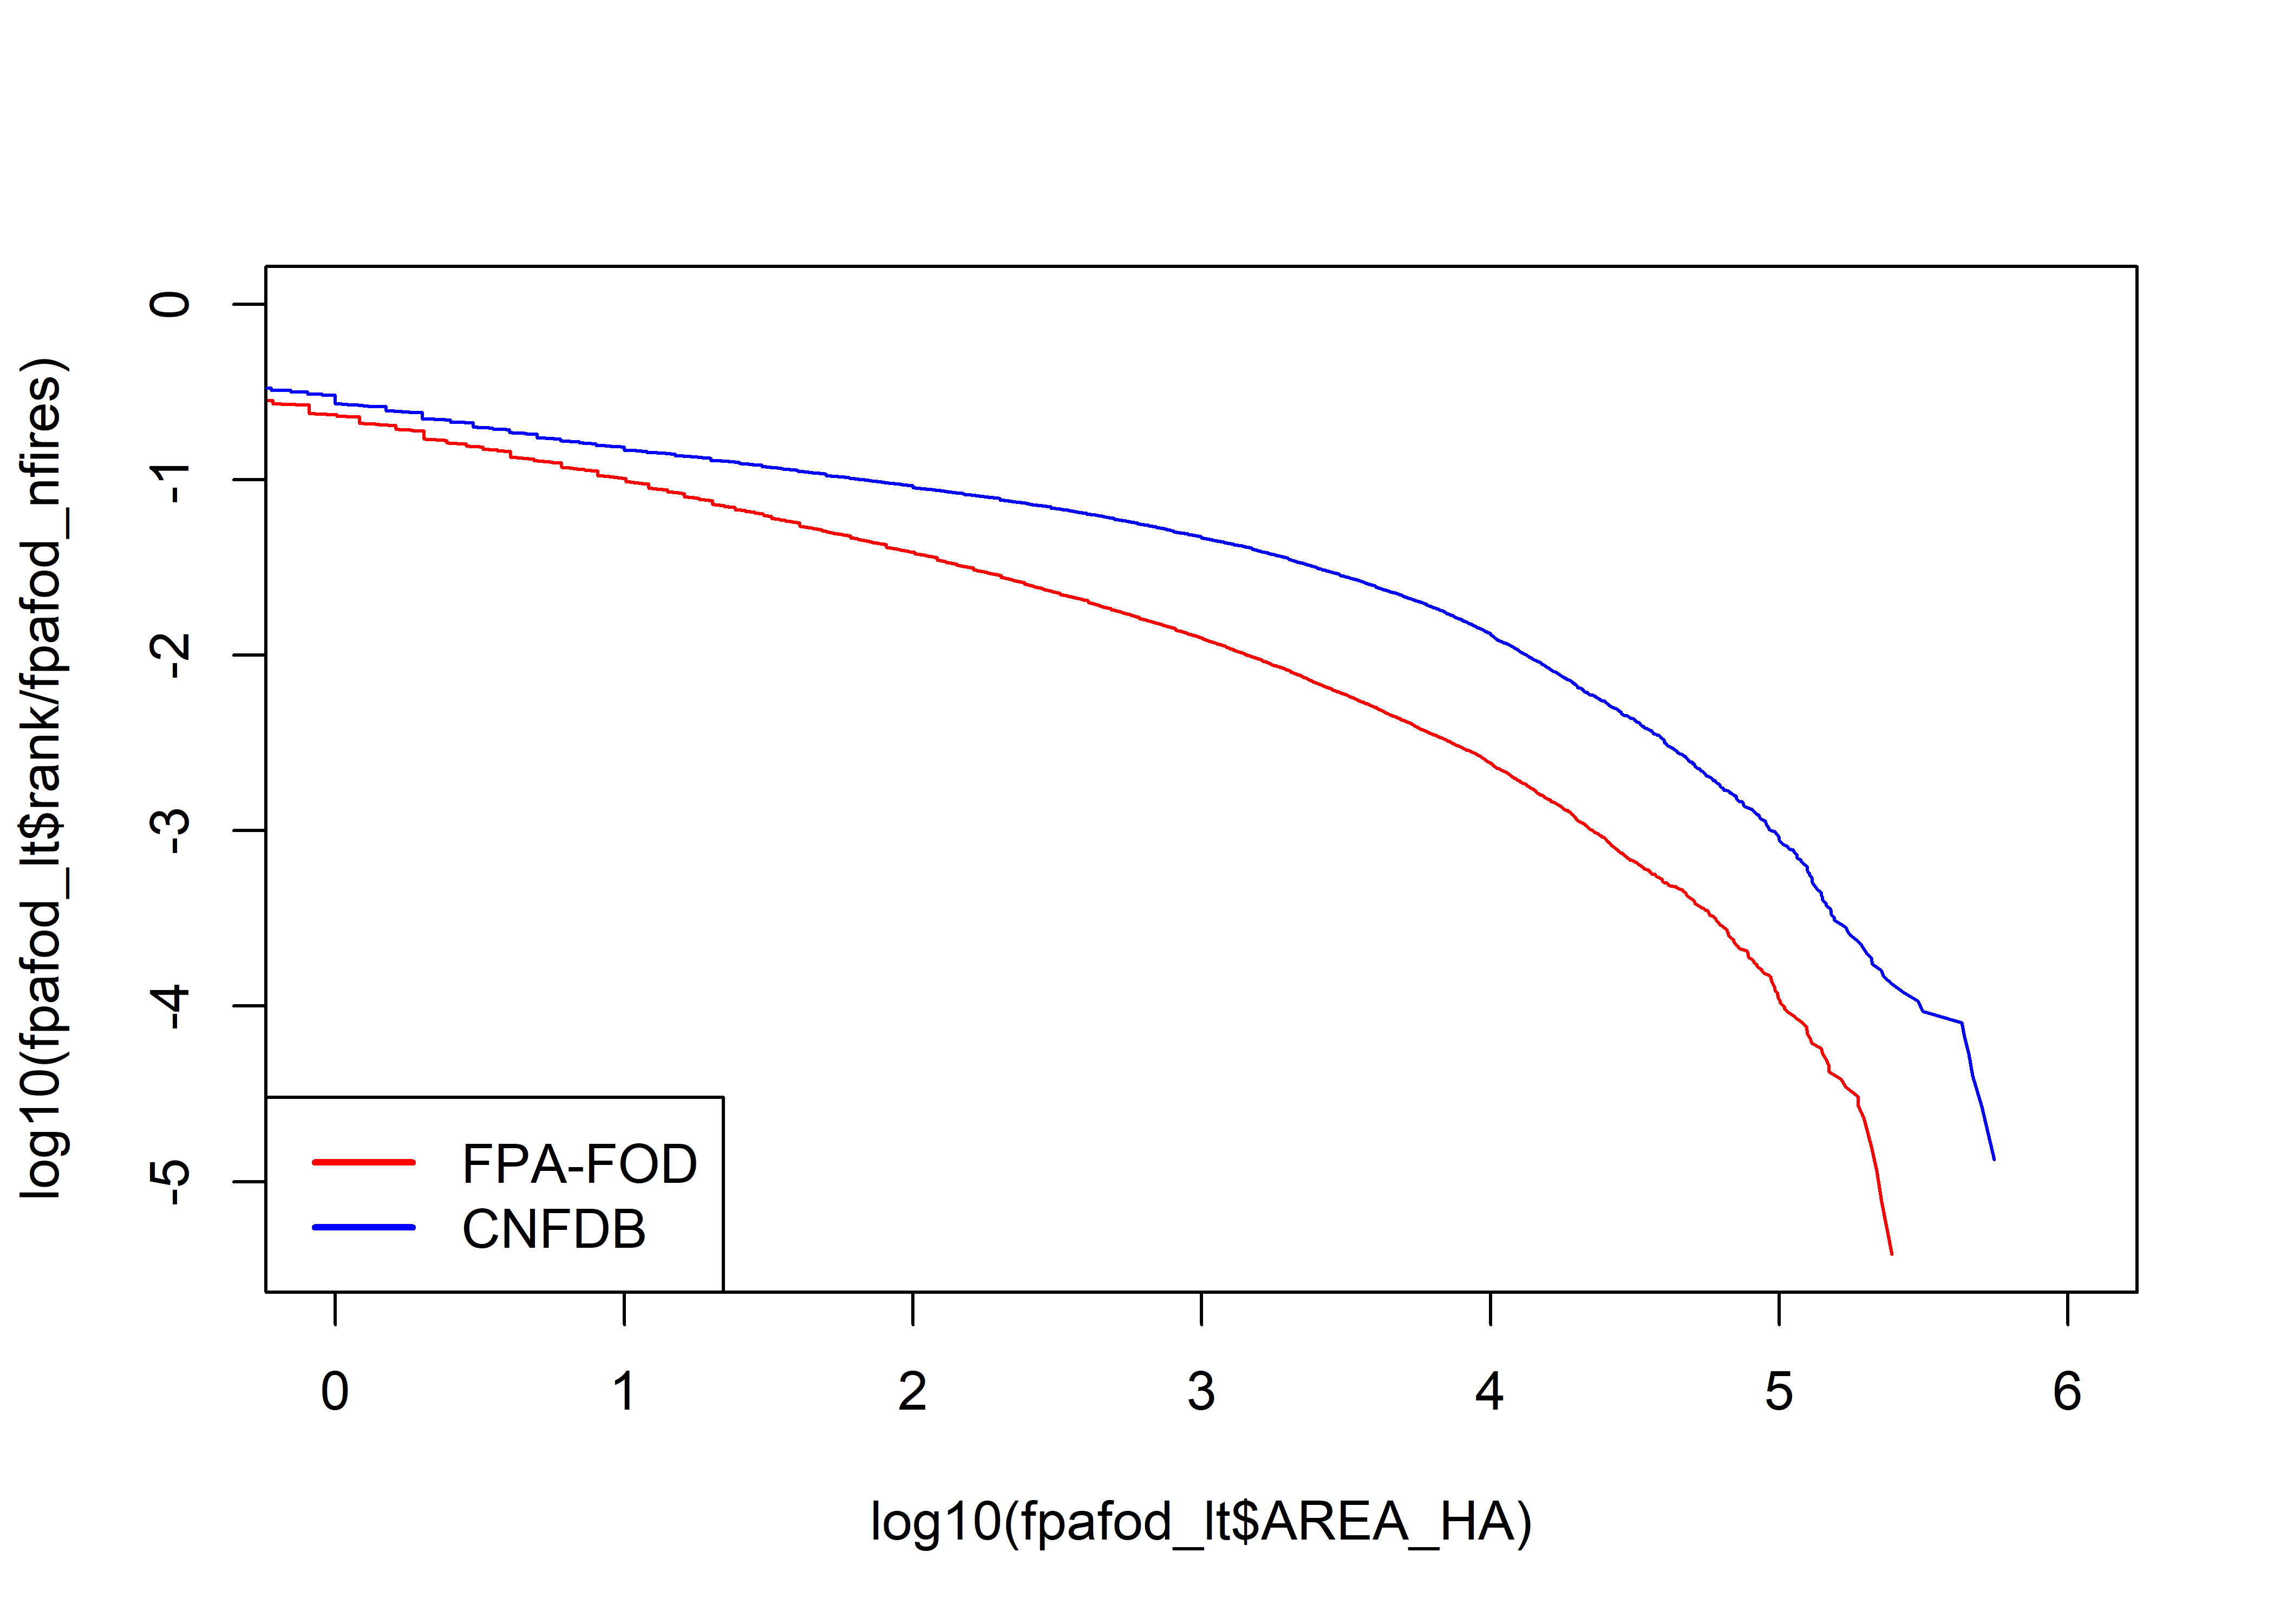
Check for zeros and missing data
length(fpafod_lt$AREA_HA[fpafod_lt$AREA_HA <= 0])## [1] 0length(cnfdb_lt$SIZE_HA[cnfdb_lt$SIZE_HA <= 0])## [1] 6056There are 6056 observations with 0.0 ha areas in the CNFDB.
Canadian fires 0.0 ha
library(maps)
plot(0,0, ylim=c(17,80), xlim=c(-180,-55), type="n",
  xlab="Longitude", ylab="Latitude", main="All Lightning Fires = 0.0 ha")
map("world", add=TRUE, lwd=2, col="gray")
points(cnfdb_lt$LATITUDE[cnfdb_lt$SIZE_HA == 0] ~ cnfdb_lt$LONGITUDE[cnfdb_lt$SIZE_HA == 0],
  pch=16, cex=0.3, col="red")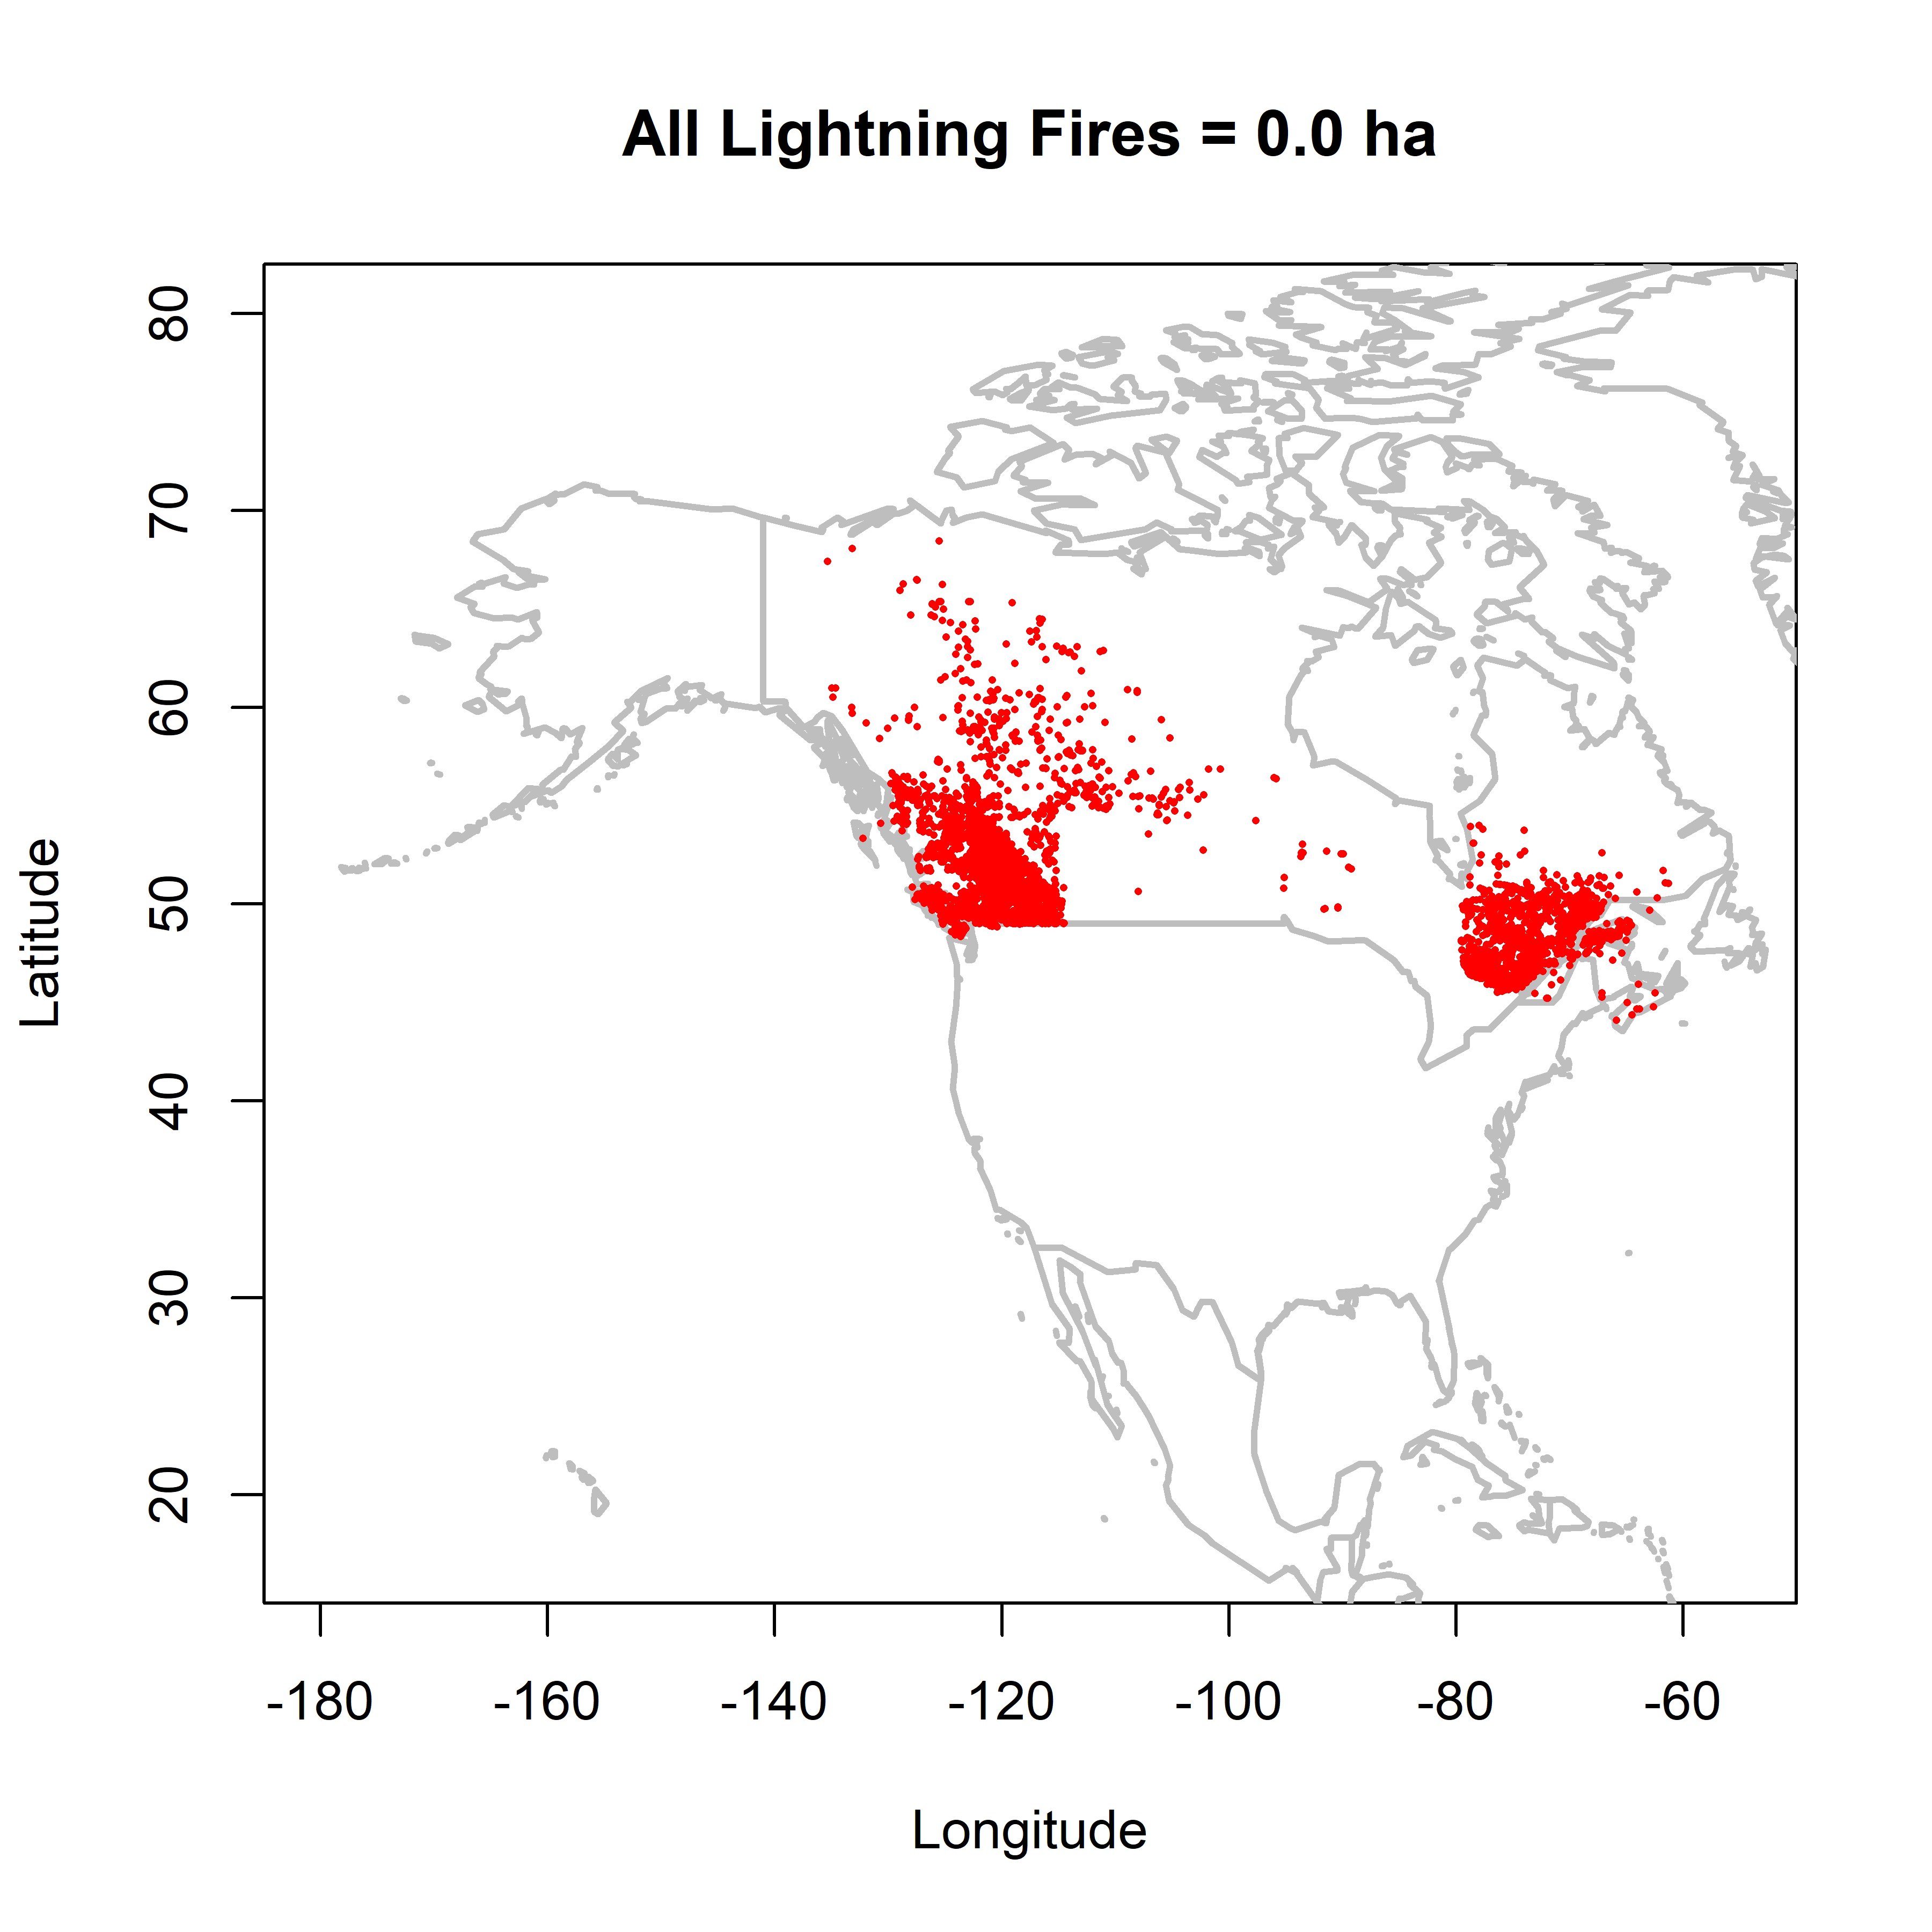
hist(cnfdb_lt$YEAR[cnfdb_lt$SIZE_HA > 0], breaks=seq(1979.5, 2014.5, by=1),
  ylim=c(0,6000), col=NULL, main="Canadian Lightning Fires", xlab="Year")
hist(cnfdb_lt$YEAR[cnfdb_lt$SIZE_HA == 0], breaks=seq(1979.5, 2014.5, by=1),
  col=NULL, border="red", add=TRUE)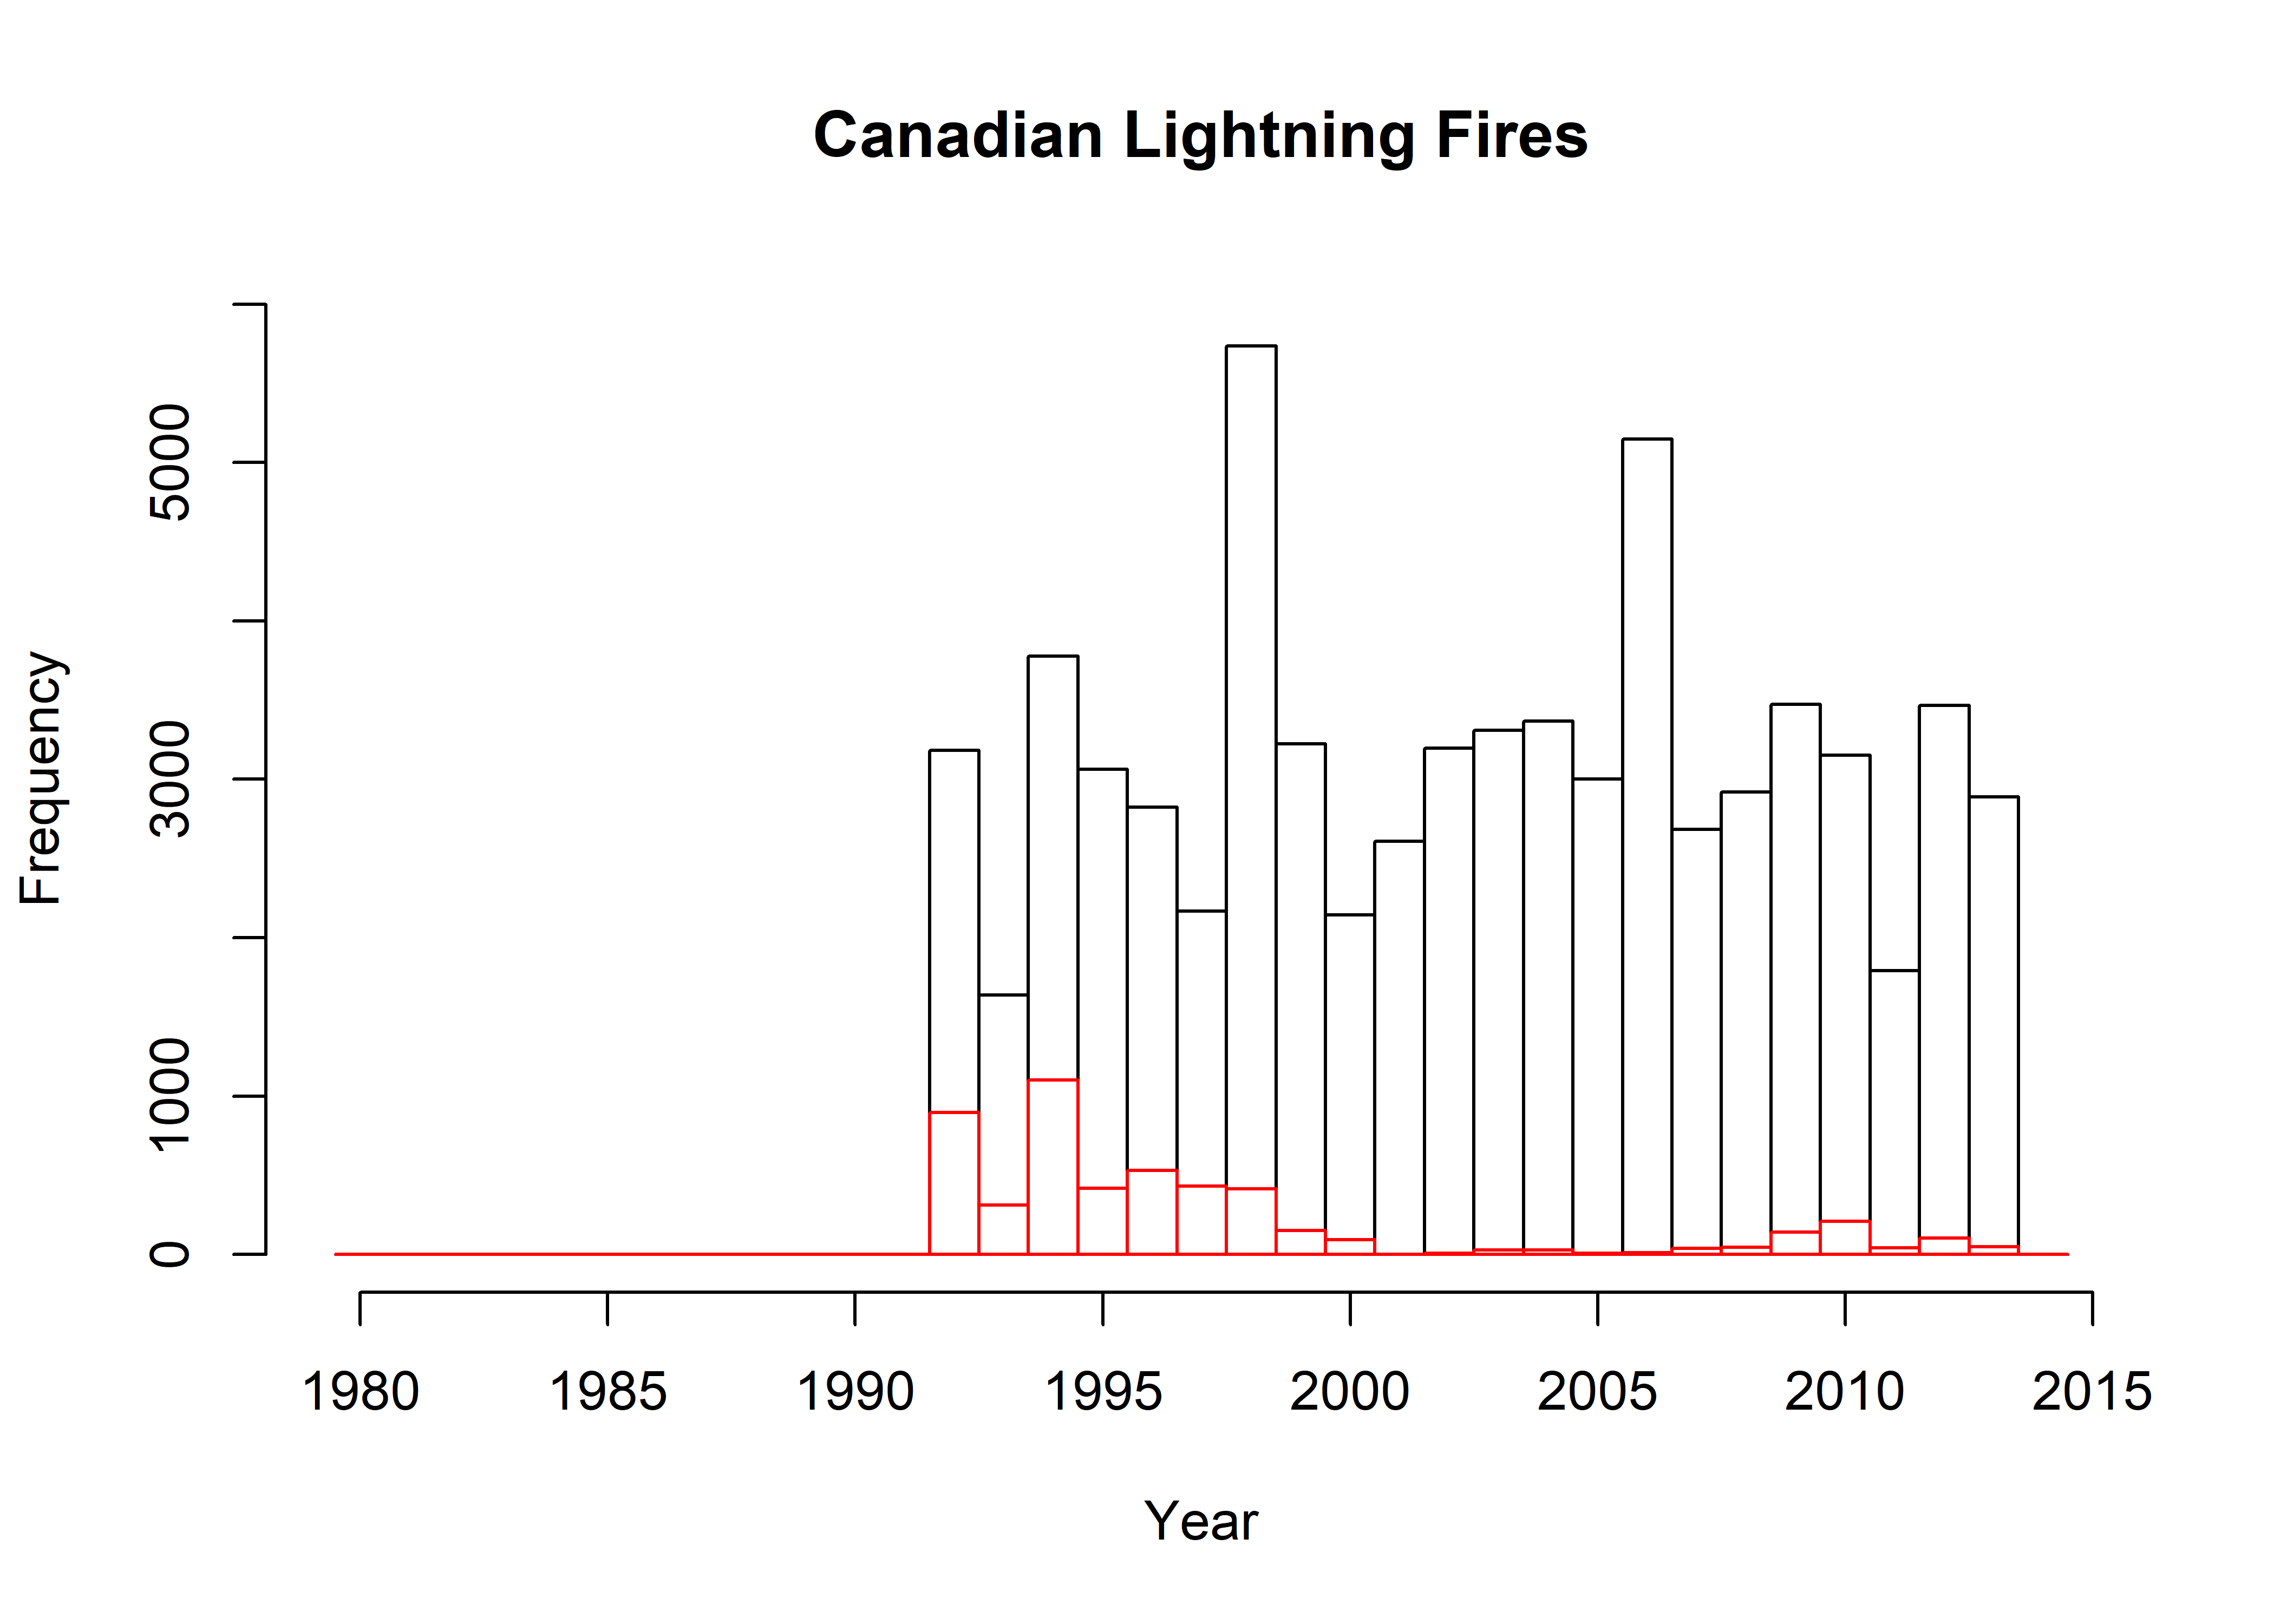
The zero-area fires are few in number in the later part of the record.
Remove the zeros and NA’s from the Canadian fires
length(cnfdb_lt$SIZE_HA)## [1] 74823cnfdb_lt <- cnfdb_lt[cnfdb_lt$SIZE_HA > 0, ]
length(cnfdb_lt$SIZE_HA)## [1] 69751length(cnfdb_lt$SIZE_HA[!is.na(cnfdb_lt$SIZE_HA)])## [1] 68767cnfdb_lt <- cnfdb_lt[!is.na(cnfdb_lt$SIZE_HA), ]
length(cnfdb_lt$SIZE_HA[cnfdb_lt$SIZE_HA == 0 ])## [1] 0Get cumulative sum of fire sizes
fpafod_lt$cumsum <- cumsum(fpafod_lt$AREA_HA)
cnfdb_lt$cumsum <- cumsum(cnfdb_lt$SIZE_HA)
Write sorted data
csvpath="e:/Projects/fire/DailyFireStarts/work/MergedFireStarts/R/"
write.table(fpafod_lt, paste(csvpath,"fpafod_lt.csv", sep=""), row.names=FALSE, sep=",")
write.table(cnfdb_lt, paste(csvpath,"cnfdb_lt.csv", sep=""), row.names=FALSE, sep=",")hist(log10(fpafod_lt$AREA_HA), xlim=c(-4,6), ylim=c(0,120000), breaks=40,
col="pink", border="red", main="Area (Lightning Fires)", xlab="log10 Area")
hist(log10(cnfdb_lt$SIZE_HA), xlim=c(-4,6), ylim=c(0,120000), breaks=40,
col=NULL, border="blue", add=TRUE)
legend("topright", legend=c("FPA-FOD","CNFDB"), lwd=2, col=c("red","blue"))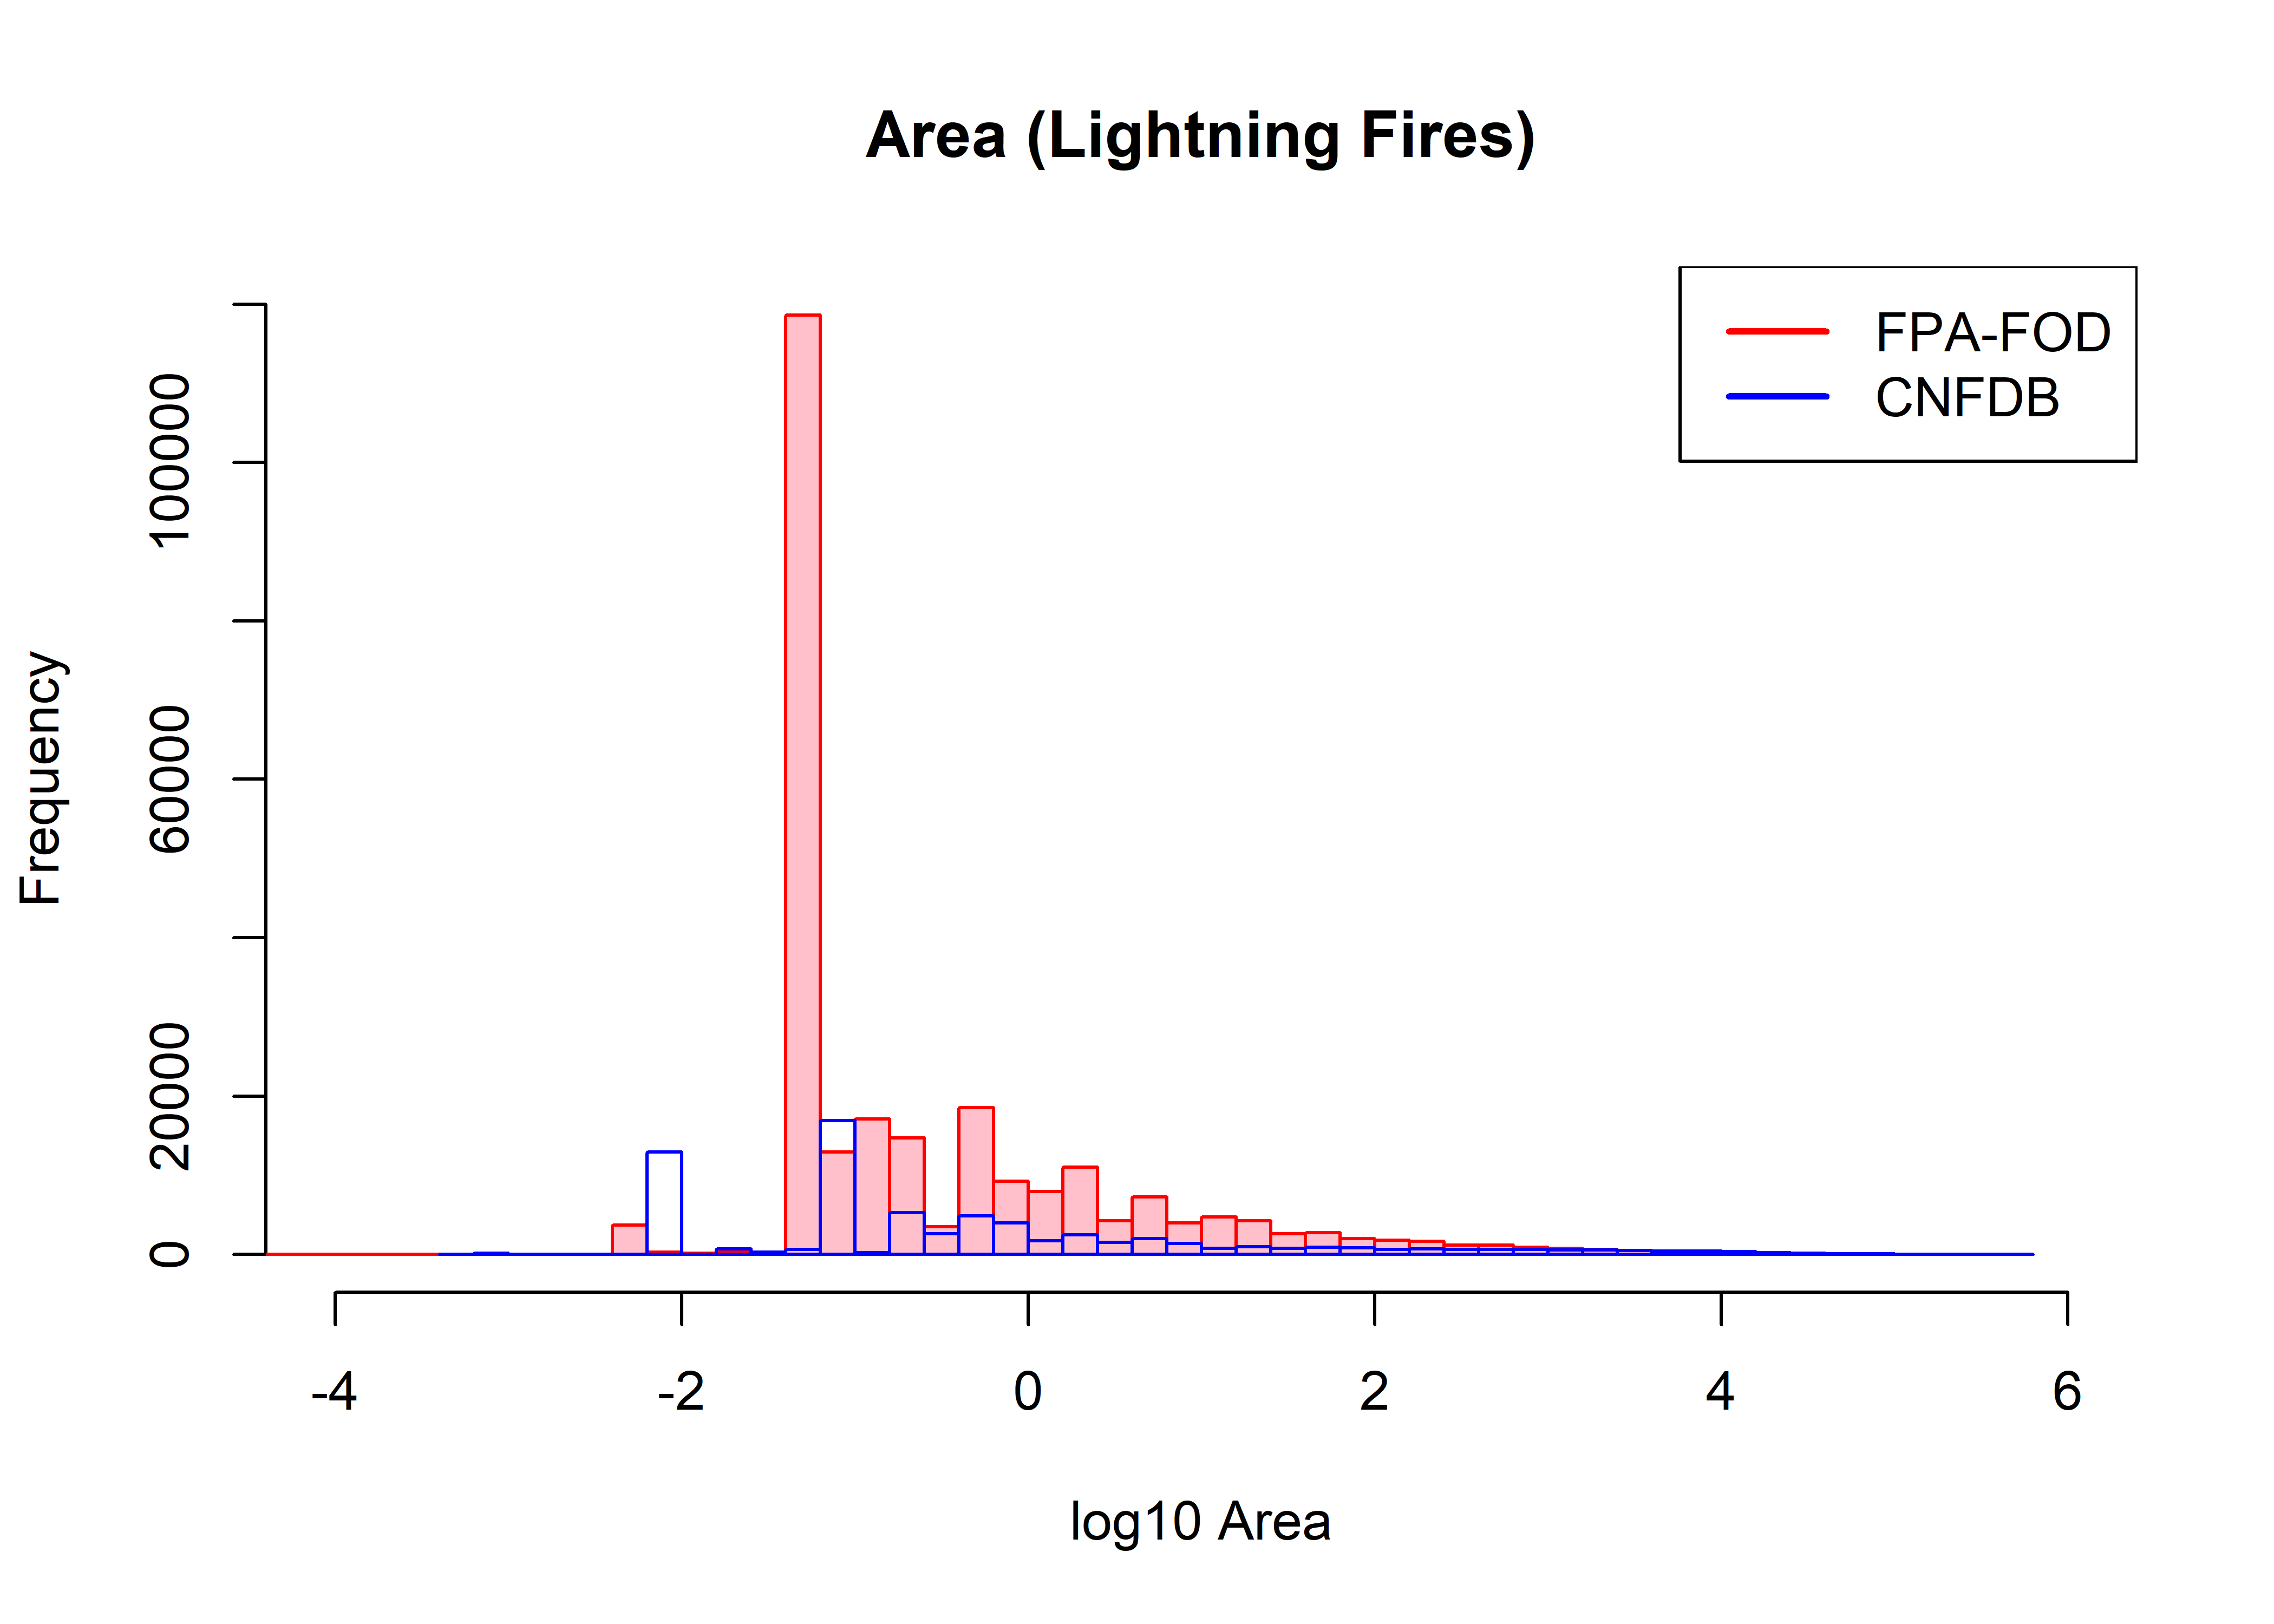
hist(log10(fpafod_lt$AREA_HA), xlim=c(-4,6), freq=FALSE, breaks=40,
  col="pink", border="red", main="Area (Lightning Fires)", xlab="log10 Area")
hist(log10(cnfdb_lt$SIZE_HA), xlim=c(-4,6), freq=FALSE,  breaks=40,
  col=NULL, border="blue", add=TRUE)
legend("topright", legend=c("FPA-FOD","CNFDB"), lwd=2, col=c("red","blue"))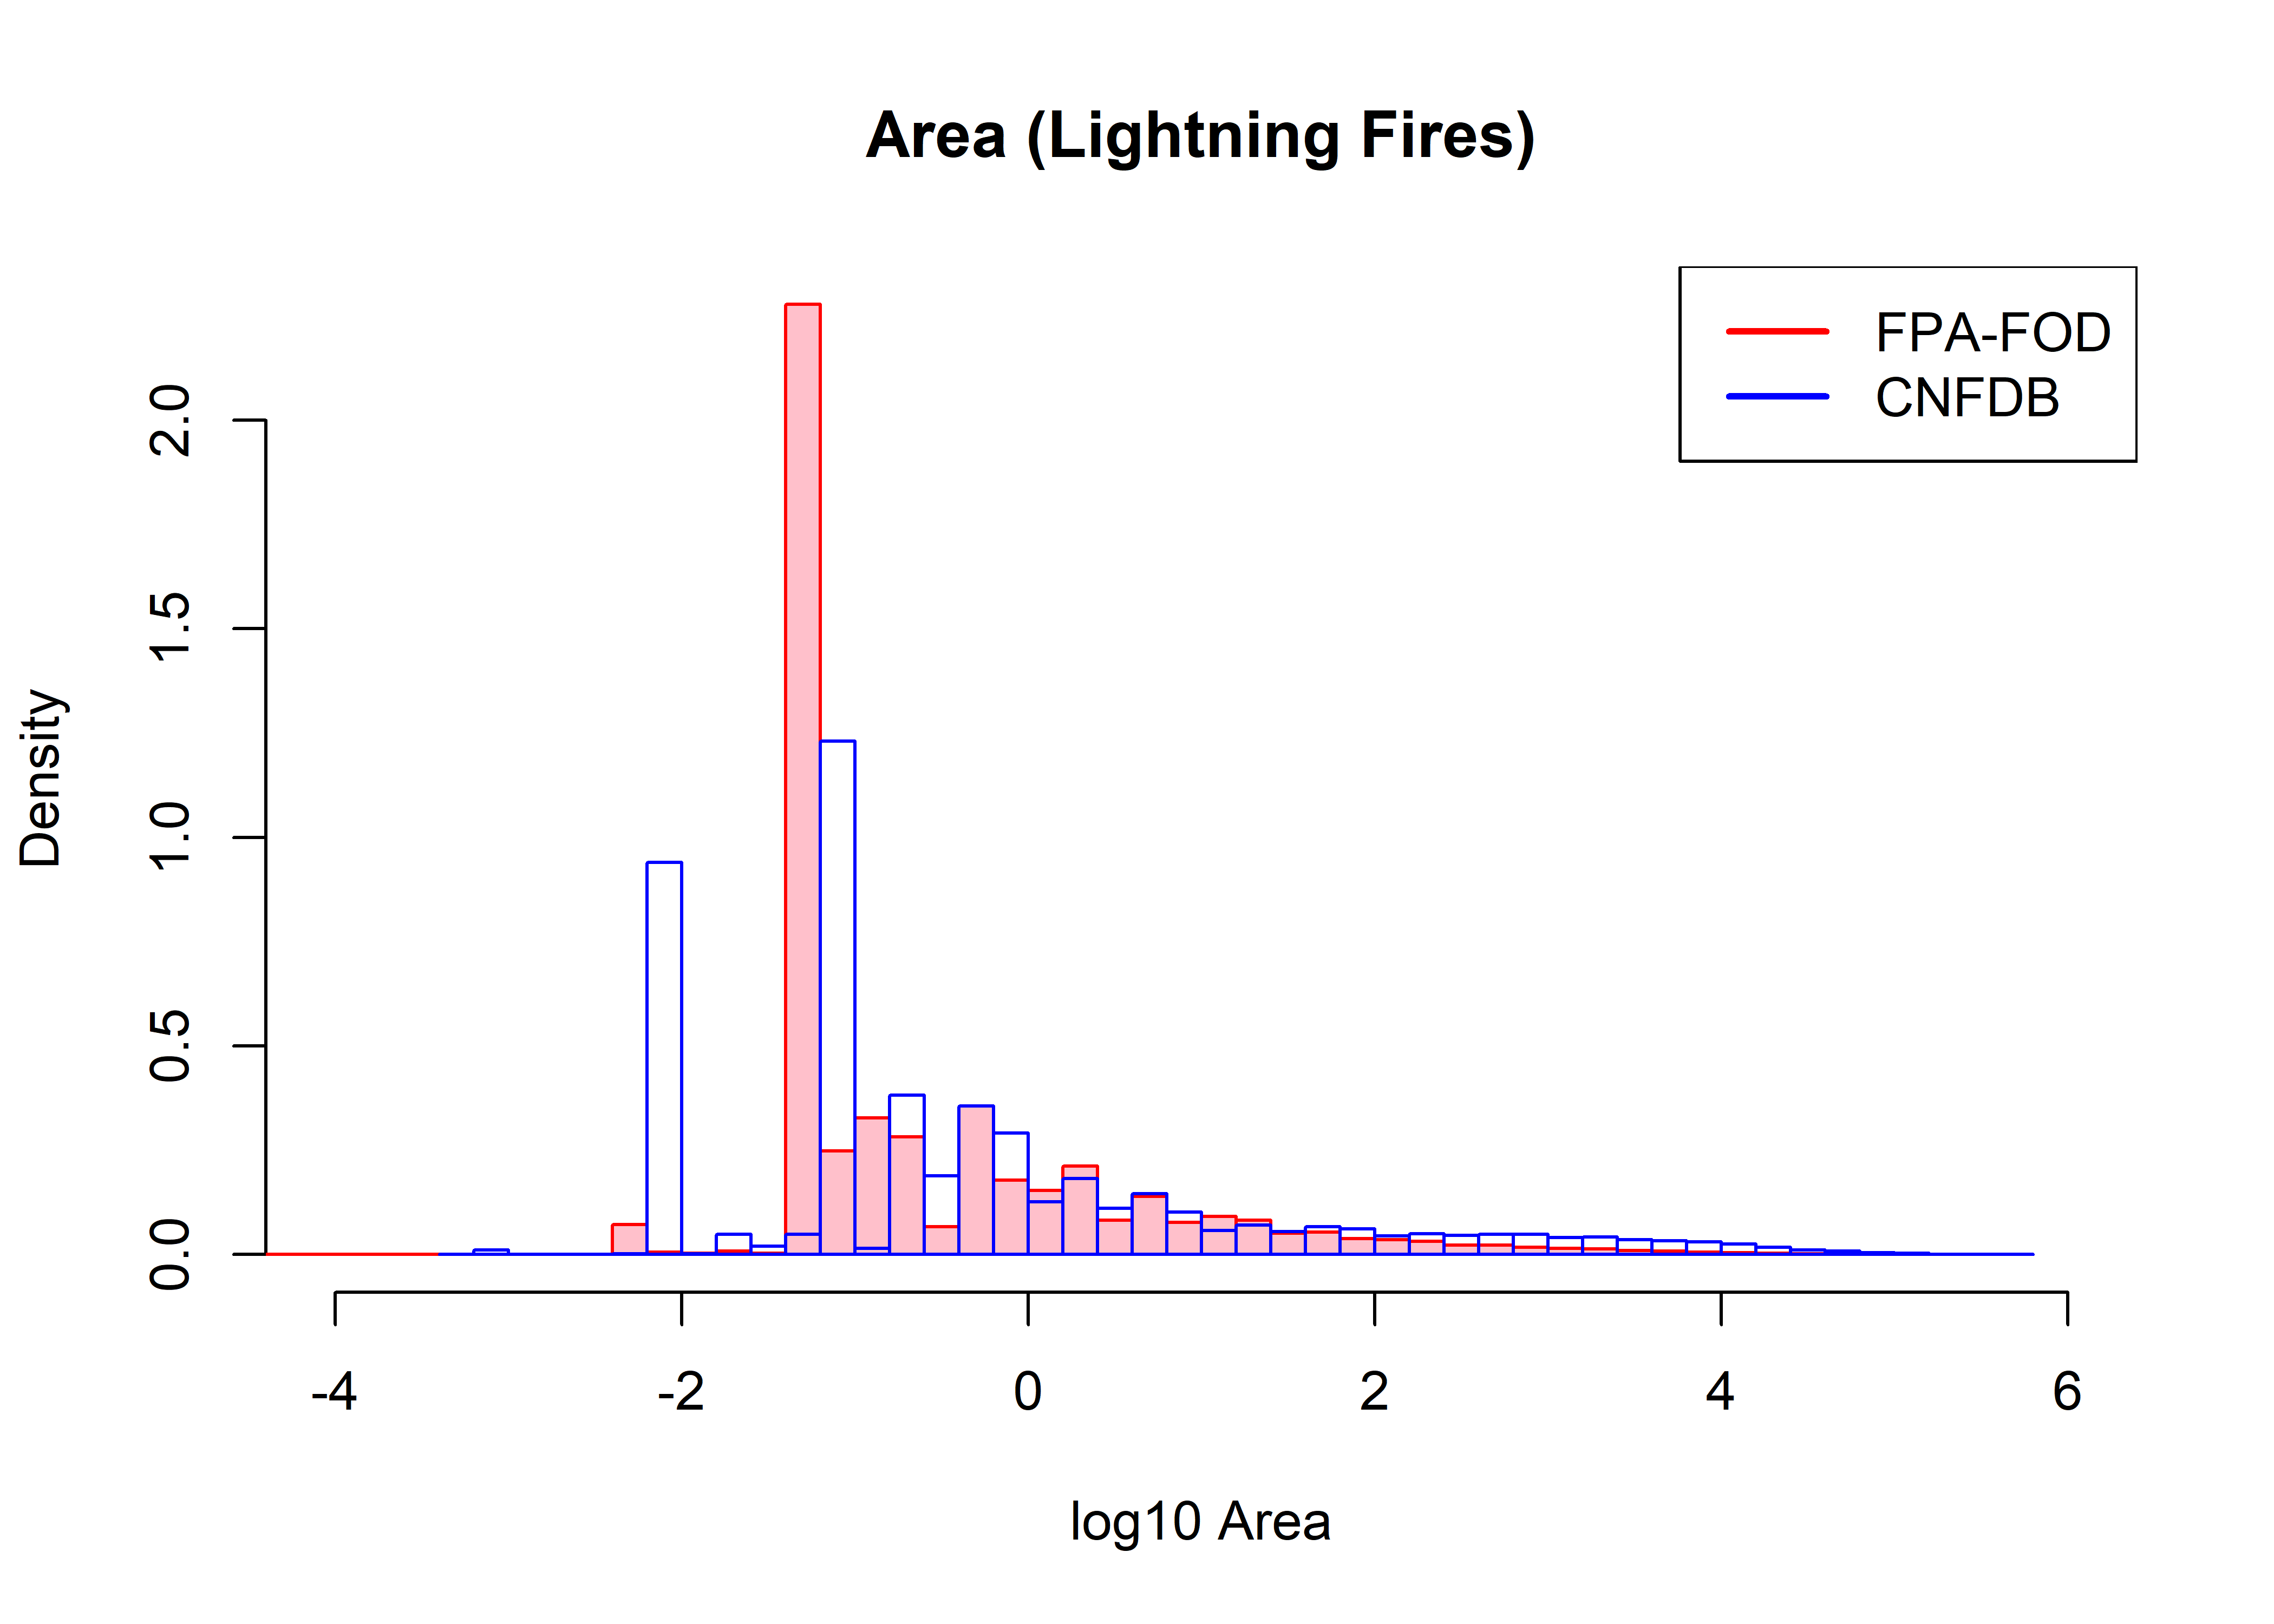
plot(fpafod_lt$AREA_HA, fpafod_lt$cumsum, pch=16, cex=0.6, col="red", xlim=c(0,700000), ylim=c(0, 70000000),
  xlab="Sorted Fire Size (ha)", ylab="Cumulative Area (ha)",
  main="Size and Cumulative Sizes of Lightning Fires")
points(cnfdb_lt$SIZE_HA, cnfdb_lt$cumsum, pch=16, cex=0.6, col="blue")
legend("topright", legend=c("FPA-FOD","CNFDB"), lwd=2, col=c("red","blue"))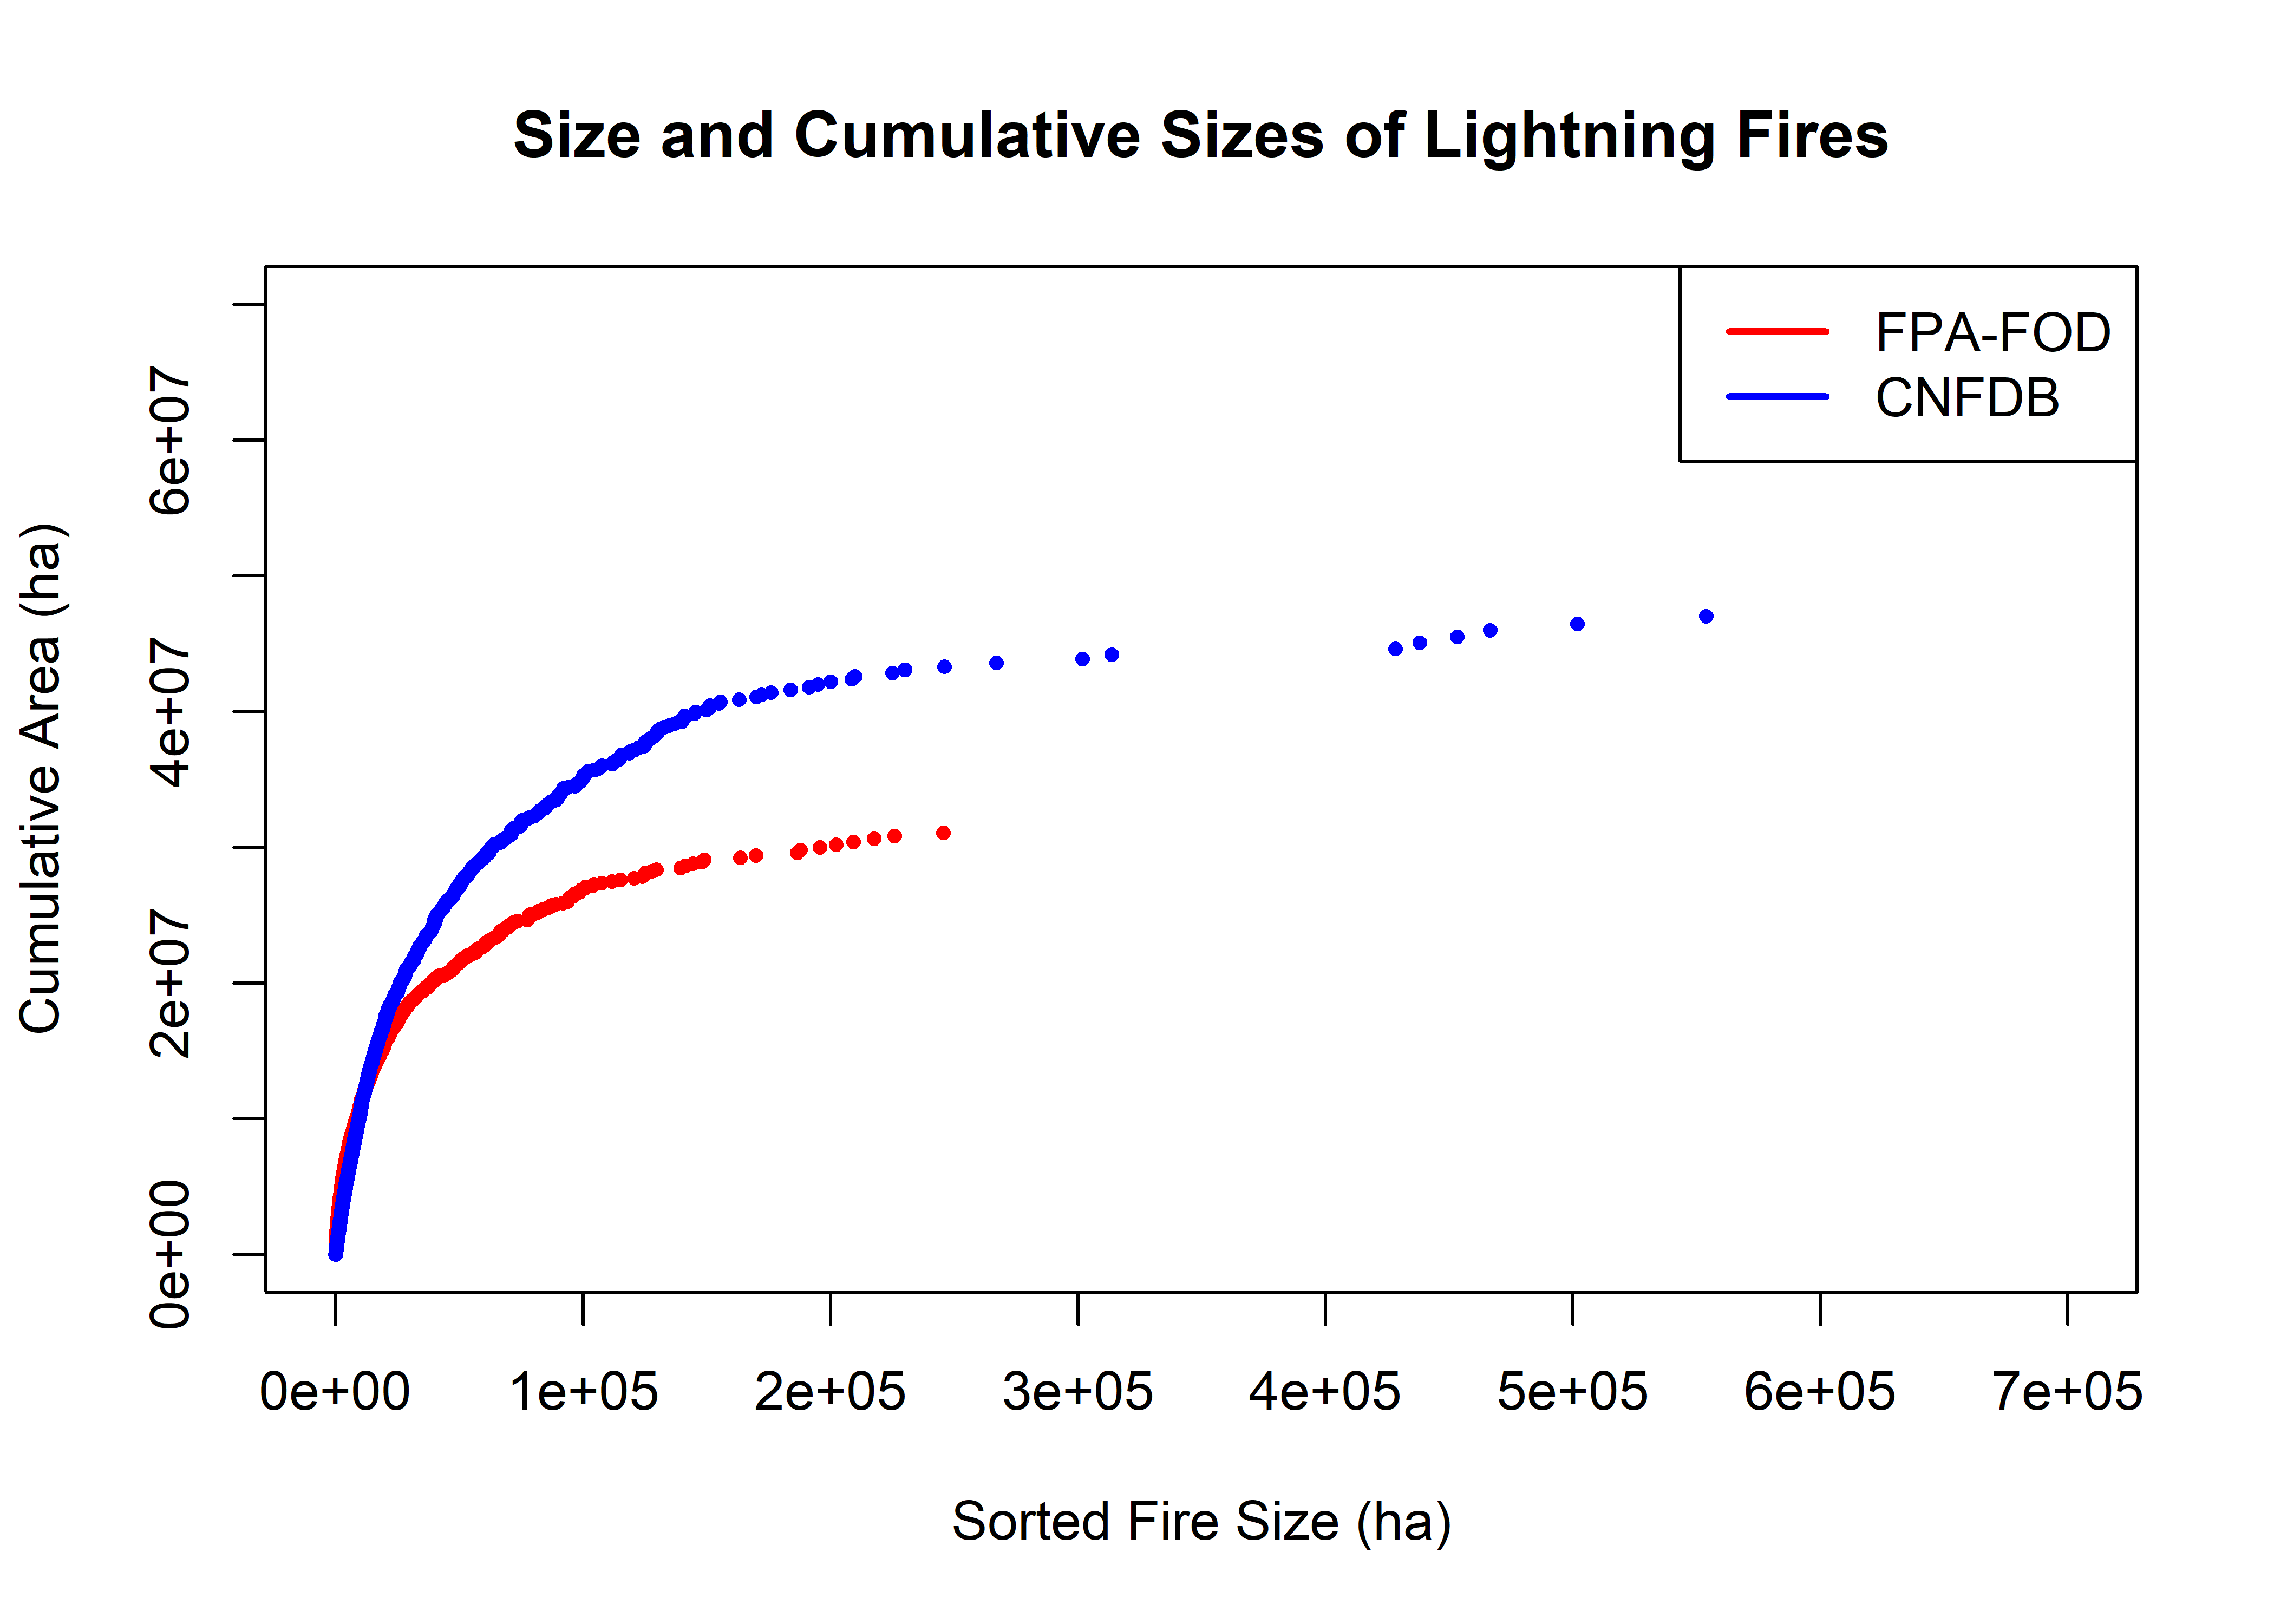
fpafod.max.sort <- max(fpafod_lt$AREA_HA); fpafod.max.cumsum <- max(fpafod_lt$cumsum)
cnfdb.max.sort <- max(cnfdb_lt$SIZE_HA); cnfdb.max.cumsum <- max(cnfdb_lt$cumsum)
fpafod.min.sort <- min(fpafod_lt$AREA_HA); fpafod.min.cumsum <- min(fpafod_lt$cumsum)
cnfdb.min.sort <- min(cnfdb_lt$SIZE_HA); cnfdb.min.cumsum <- min(cnfdb_lt$cumsum)
plot((fpafod_lt$AREA_HA-fpafod.min.sort)/(fpafod.max.sort-fpafod.min.sort),
  (fpafod_lt$cumsum-fpafod.min.cumsum)/(fpafod.max.cumsum-fpafod.min.cumsum) ,
  pch=16, cex=0.6, col="red", xlim=c(0,1), ylim=c(0, 1),
  xlab="Sorted Fire Size", ylab="Cumulative Area",
  main="(Rescaled, 0-1):  Size and Cumulative Sizes of Lightning Fires")
points(cnfdb_lt$SIZE_HA/cnfdb.max.sort, cnfdb_lt$cumsum/cnfdb.max.cumsum,
  pch=16, cex=0.6, col="blue")
legend("topleft", legend=c("FPA-FOD","CNFDB"), lwd=2, col=c("red","blue"))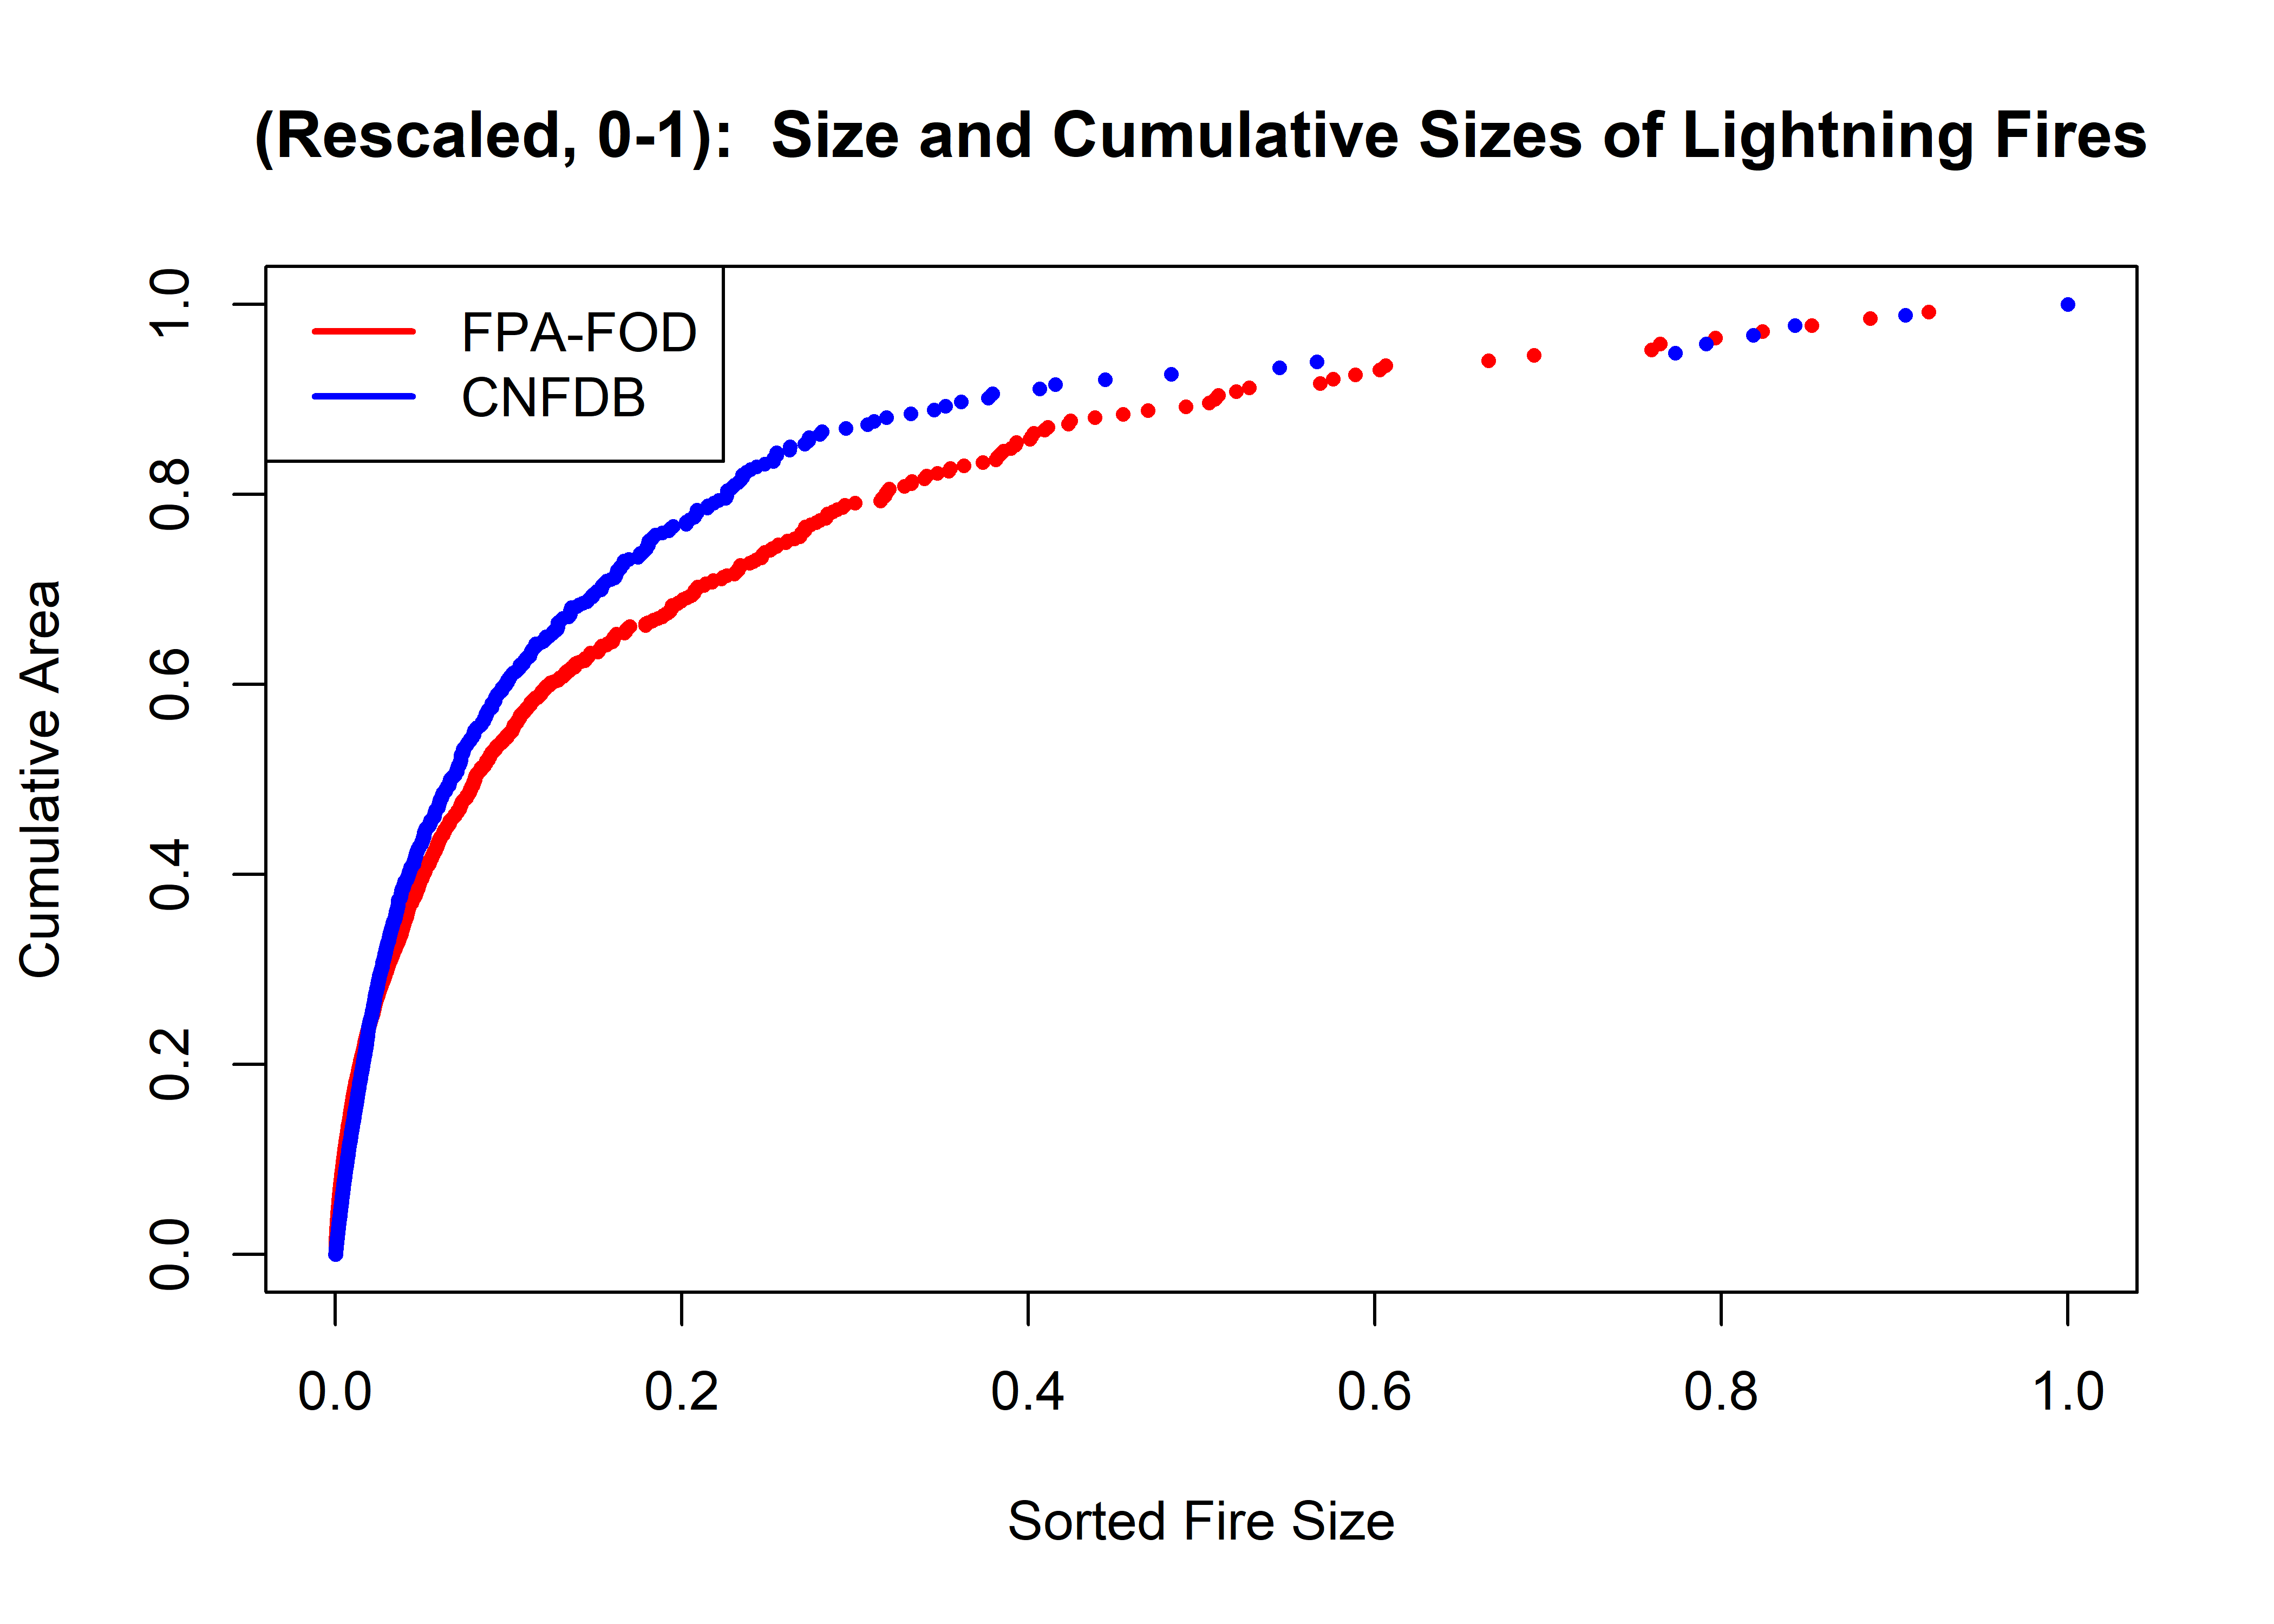
Do for log10 transform
plot(log10(fpafod_lt$AREA_HA), log10(fpafod_lt$cumsum), pch=16, cex=0.6, col="red", xlim=c(-4,8), ylim=c(-4,8),
  xlab="log10 Sorted Fire Size (ha)", ylab="log10 Cumulative Area (ha)",
  main="Size and Cumulative Sizes of Lightning Fires")
points(log10(cnfdb_lt$SIZE_HA), log10(cnfdb_lt$cumsum), pch=16, cex=0.6, col="blue")
legend("topleft", legend=c("FPA-FOD","CNFDB"), lwd=2, col=c("red","blue"))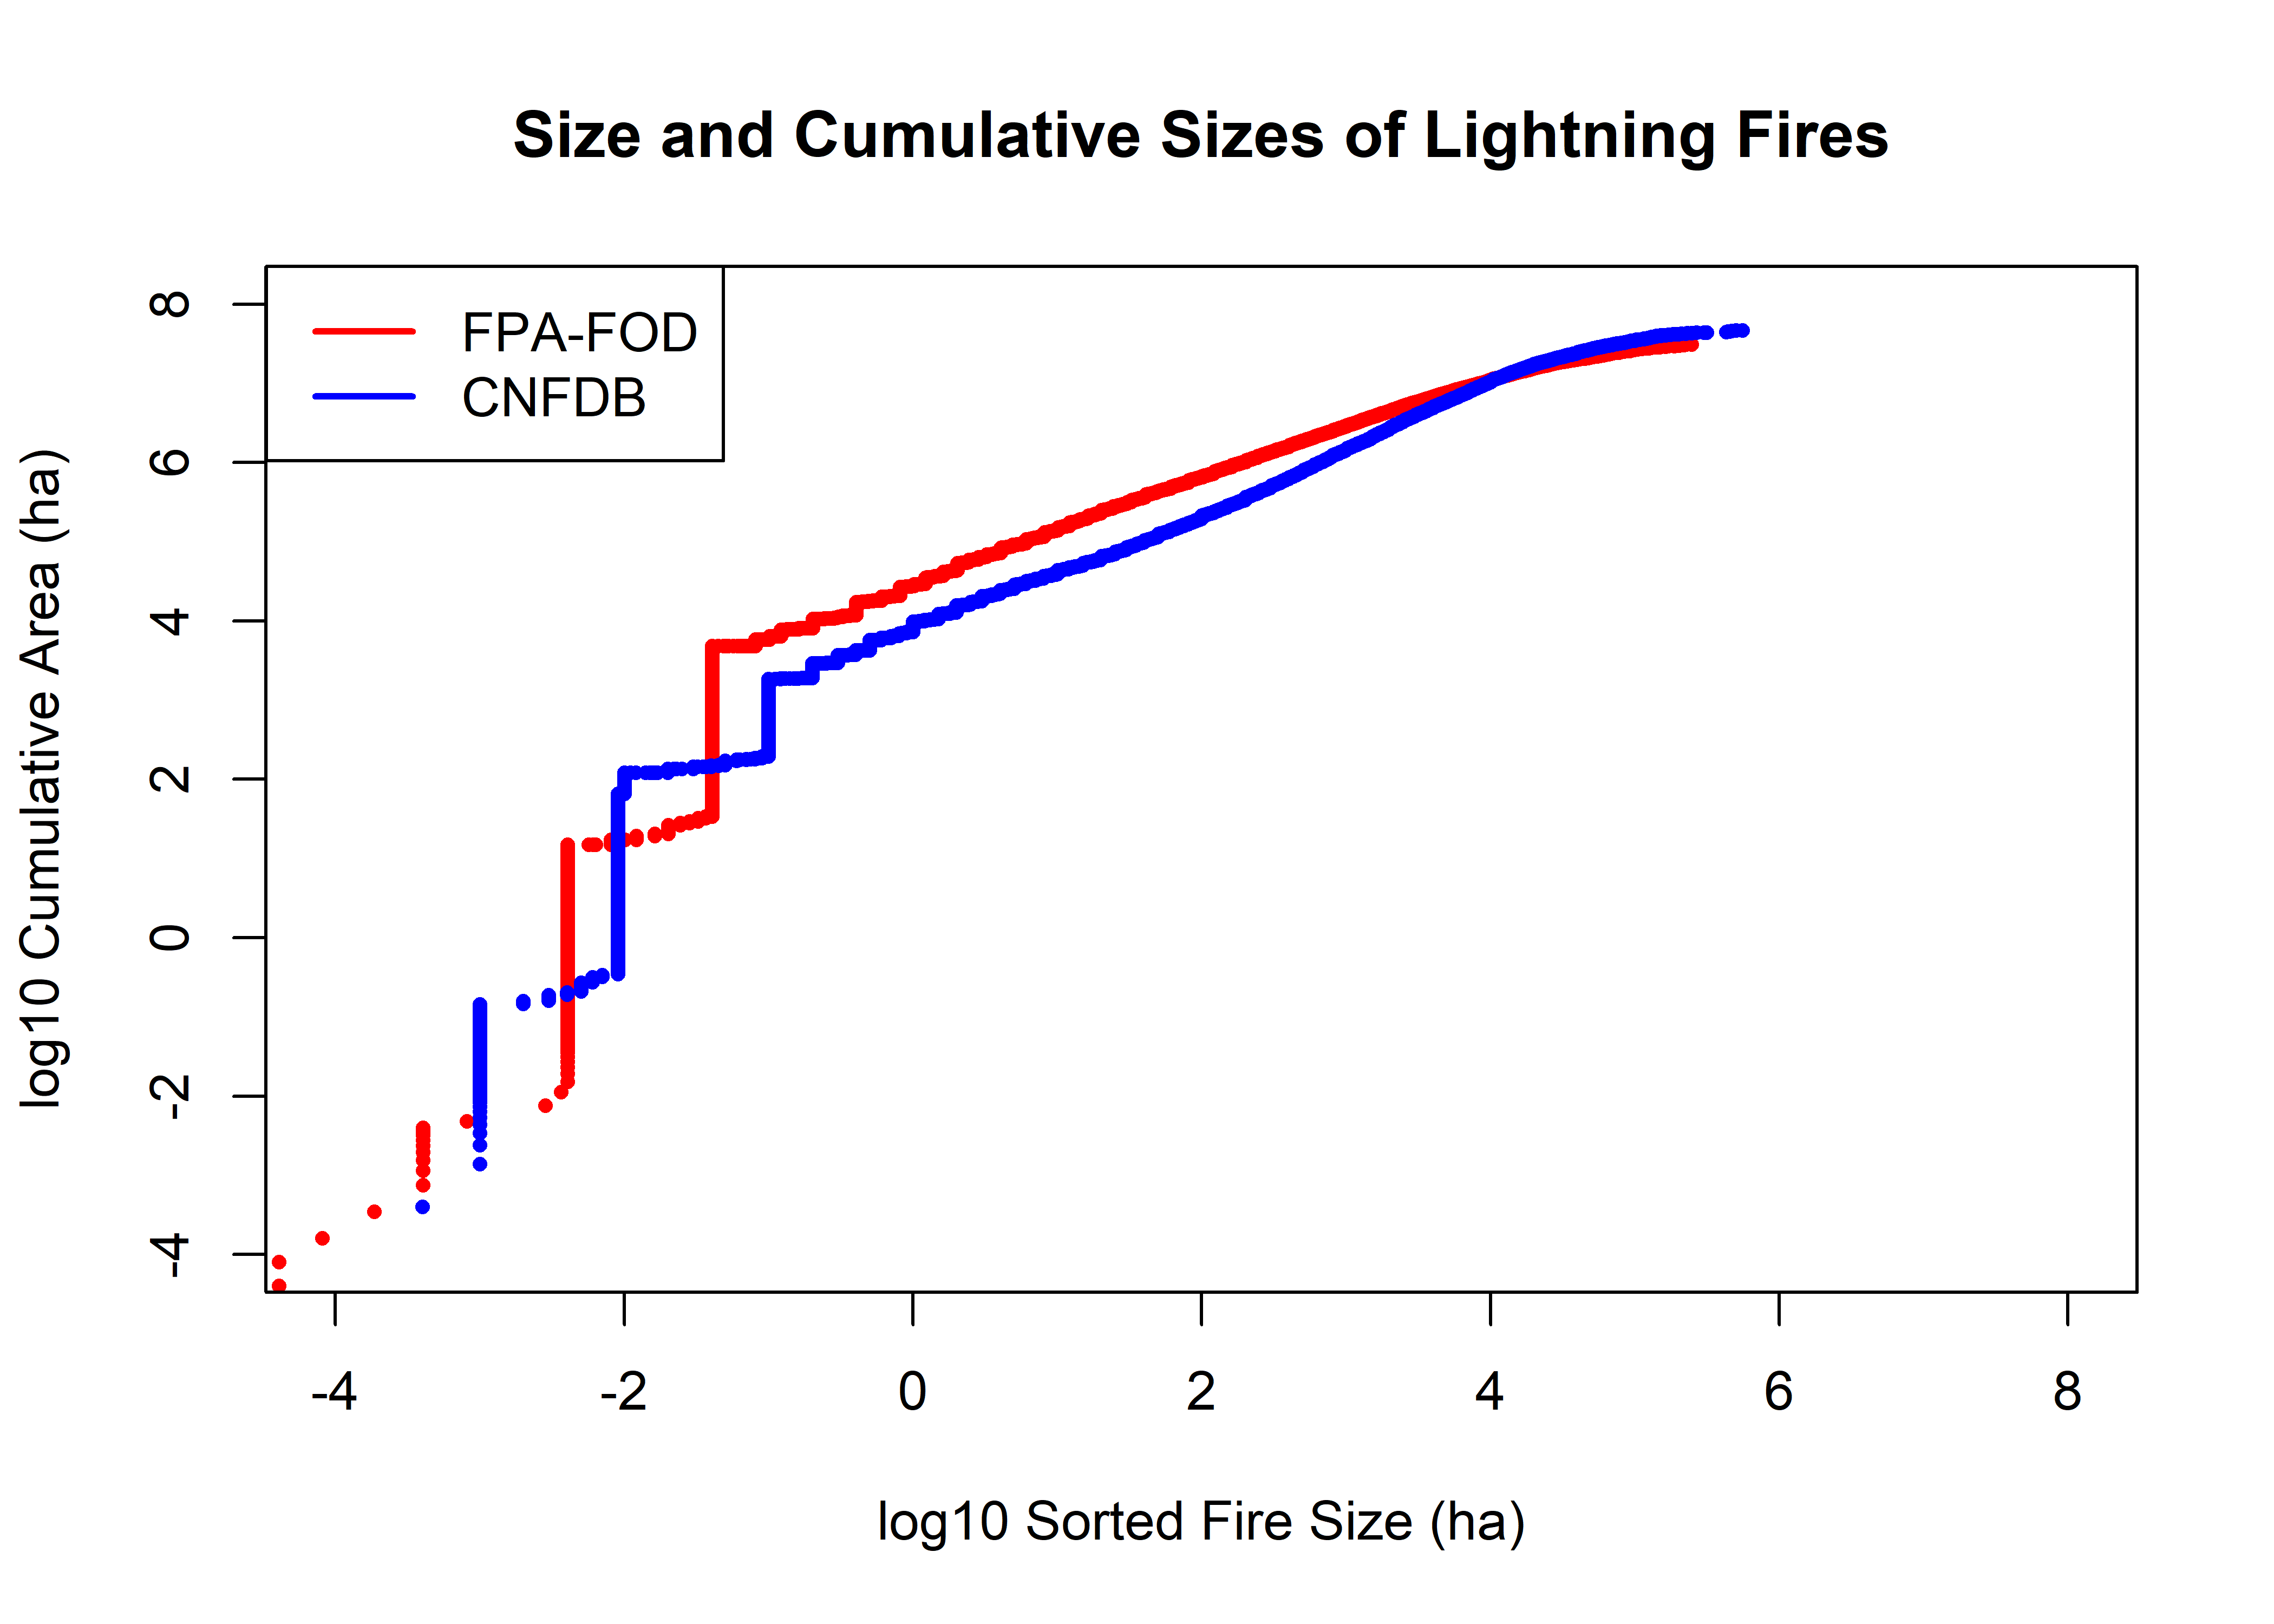
log10.fpafod.max.sort <- max(log10(fpafod_lt$AREA_HA)); log10.fpafod.max.cumsum <- max(log10(fpafod_lt$cumsum))
log10.cnfdb.max.sort <- max(log10(cnfdb_lt$SIZE_HA)); log10.cnfdb.max.cumsum <- max(log10(cnfdb_lt$cumsum))
log10.fpafod.min.sort <- min(log10(fpafod_lt$AREA_HA)); log10.fpafod.min.cumsum <- min(log10(fpafod_lt$cumsum))
log10.cnfdb.min.sort <- min(log10(cnfdb_lt$SIZE_HA)); log10.cnfdb.min.cumsum <- min(log10(cnfdb_lt$cumsum))
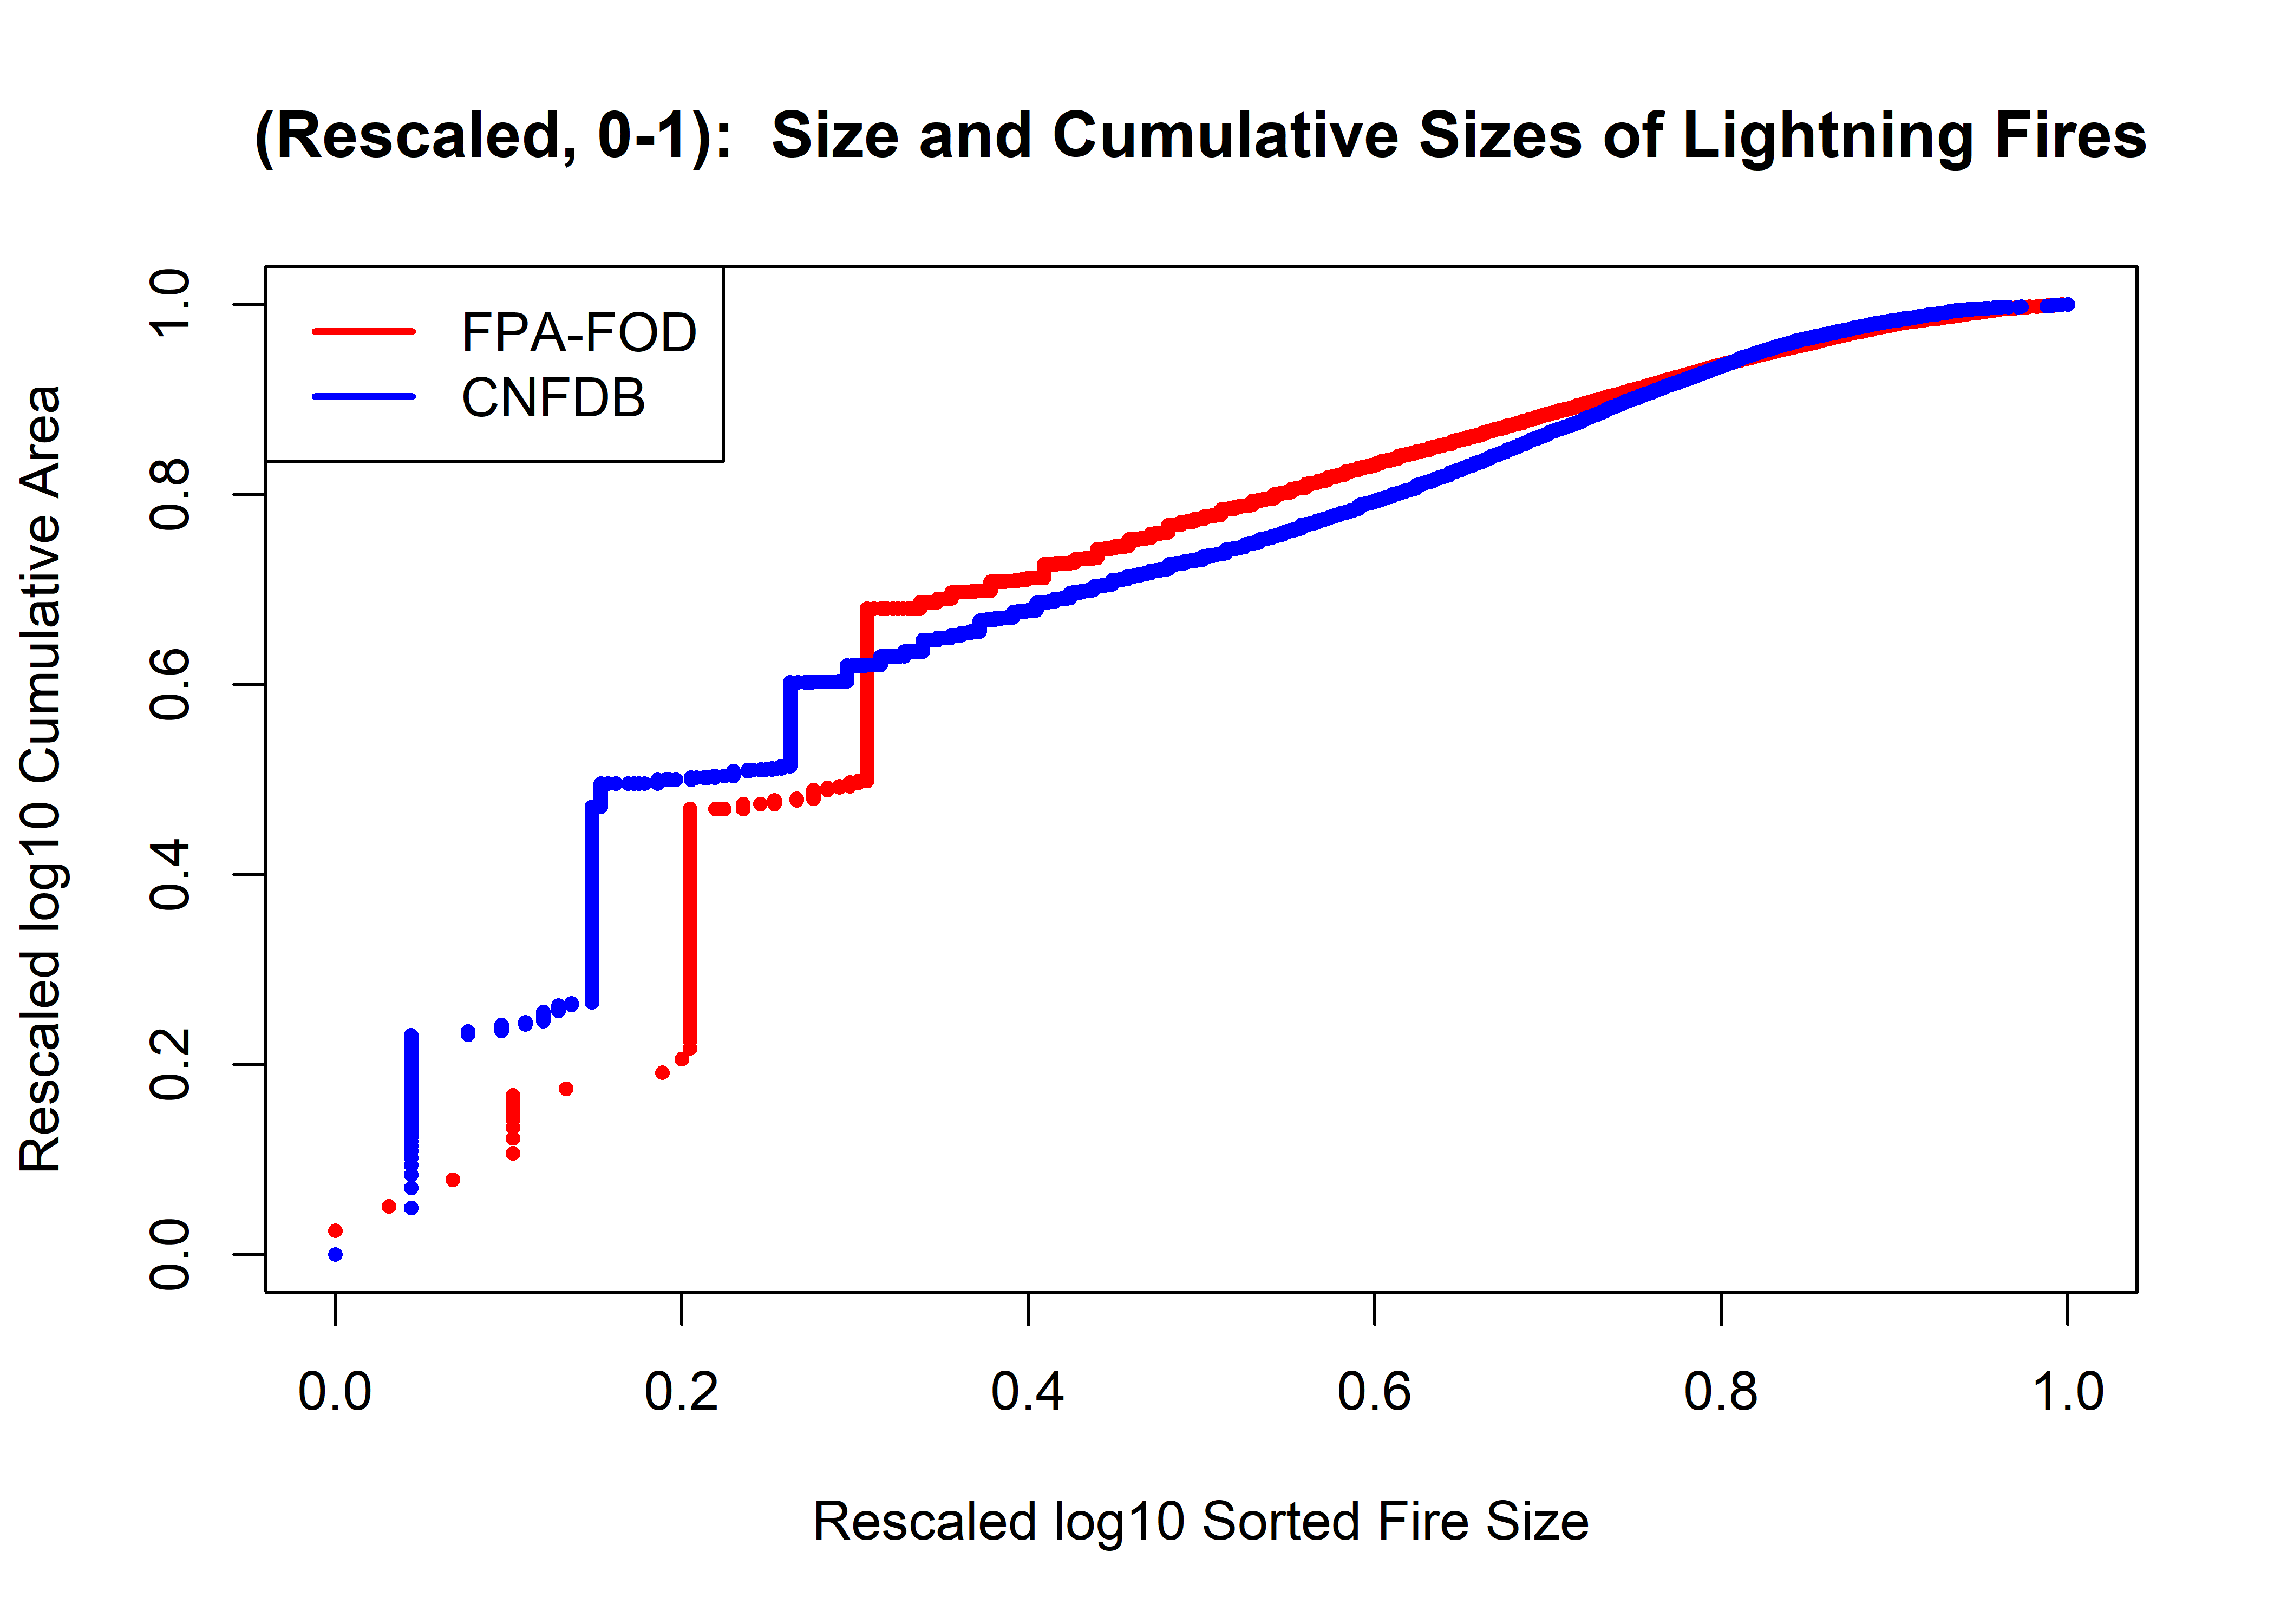
plot((log10(fpafod_lt$AREA_HA)-log10.fpafod.min.sort)/(log10.fpafod.max.sort-log10.fpafod.min.sort),
  (log10(fpafod_lt$cumsum)-log10.fpafod.min.cumsum)/(log10.fpafod.max.cumsum-log10.fpafod.min.cumsum),
  pch=16, cex=0.6, col="red", xlim=c(0,1), ylim=c(0, 1),
  xlab="Rescaled log10 Sorted Fire Size", ylab="Rescaled log10 Cumulative Area",
  main="(Rescaled, 0-1):  Size and Cumulative Sizes of Lightning Fires")
points((log10(cnfdb_lt$SIZE_HA)-log10.cnfdb.min.sort)/(log10.cnfdb.max.sort-log10.cnfdb.min.sort),
  (log10(cnfdb_lt$cumsum)-log10.cnfdb.min.sort)/(log10.cnfdb.max.cumsum-log10.cnfdb.min.cumsum),
  pch=16, cex=0.6, col="blue")
legend("topleft", legend=c("FPA-FOD","CNFDB"), lwd=2, col=c("red","blue"))