Development and Characterization of a Daily Fire-Start Data Set for the
United States and Canada (1986-2013)
1 General issues
The objective of the analyses described here is to produce a merged data set of fire-start records for the U.S. and Canada, for as long an interval as possible. Although seemingly quite straightforward, that task is complicated by several things, including the relatively short length of the most comprehensive U.S. data set, the different fire-size reporting units between the U.S. and Canada, heterogeneity in the description of the causes of fires, and general data-quality and artifact issues in the individual data sets. Moreover, all fire databases become increasingly attenuated before 1990, to the extent that year-to-year variations in numbers and sizes of fires could be dependent more on reporting intensity than on climate- or human-generated variations.
There are several components of the analyses described here:
- an initial review and characterization of the individual candidate data sets, including some basic clean up of bad data;
- an examination of the statistical distributions of the fire-size information to guide the actual merger of the data and the subsequent interpretations; and
- some further analysis of the merged data set to describe the spatial and temporal patterns in the data.
2 Data sources
There are a number of different fire-start data sets for the U.S. and Canada, of varying length, spatial coverage, and completeness. All of these data are fire-start reports–direct observations, not satellite remote-sensing data.
2.1 U.S.
The U.S. data sets examined here include the:
Federal Wildland Fire Occurrence Data (FWFOD) – http://wildfire.cr.usgs.gov/firehistory/data.html. This is the longest U.S. data set, spanning the interval 1980-2012, but has two major issues: 1) underreporting/underrepresentation of fire starts in the first 9 days of each month in some individual agency data sets, which carry over into the “all agencies” data; and 2) fewer than typical record numbers from 1980 through 1985 (and possibly also fewer than might be expected from 2008 through 2012) The data were retrieved from the file
firehistory_1980_2014_all_agencies.dbf(2013-02-22) http://wildfire.cr.usgs.gov/firehistory/data/fh_all.zipNational Fire Occurrence Data, Federal and State Lands, 1986-1996, v1999 (NFO) – http://www.firelab.org/document/national-fire-occurrence-federal-and-state-lands-1986-1996-v1999. This is the current name and location for the “Coarse-Scale Spatial Data Set” (or sometimes, “fuelman” i.e. http://www.firelab.org/sites/default/files/images/downloads/fuelman.pdf) that was analyzed in Bartlein et al. (2008). The data come from three shapefiles (
fedfire.shp,stcofire.shp, andstptfire.shp). The filestptstates.shpon the current web page is damaged and cannot be unpacked, and so I reverted to a set of files that were merged and cleaned up by Sarah Shafer for points in the coterminous U.S. west of 102W (allfireb.dat, 2005-11-20, but the accompanying readme file is dated 2002-04-16).“NIFC Fire History Data 1980-2003” (NIFC) – ftp://ftp.nifc.gov/pub/FireHistoryData/ These data are not well documented, but the URL has appeared in several publications. There never seems to have been a web page for the data, just the
ftp://based URL. The data were downloaded on 6 July 2014 and extracted from the filefirehistory_1980_2003.dbf(with a file date of 2004-09-21).Spatial wildfire occurrence data for the United States, 1992-2013/Fire Program Analysis Fire-Occurrence Database [FPA_FOD_20150323] (3nd Edition) ( see Short, K.C., 2014, Earth Syst. Sci. Data, 6:1-27) (FPA-FOD) – http://www.fs.usda.gov/rds/archive/Product/RDS-2013-0009.3/. This is the best-documented data set, and no clean up was necessary, but it begins only in 1992. Despite that, it includes 1,673,403 records. The data were obtained from the file
FPA_FOD_20150323.accdb(2015-04-17).
2.2 Canada
There is a single candidate data set for Canada:
- Canadian National Fire Database (CNFDB) – http://cwfis.cfs.nrcan.gc.ca/datamart. This is the main Canadian data set, and is the successor to the (Canadian) Large-Fire Data Base. The data come from the file
NFDB_point_20141222.dbf(2014-12-22). Some cleanup was necessary.
3 Analysis and characterization of individual data sets
The objective here is to clean up and examine the individual data sets with a view towards assembling a merged data set with as much coverage as possible between 1980 and 2013.
Federal Wildland Fire Occurrence Data (FWFO) The salient characteristic of this data set is the underrepresentation of fires for the first nine days of each month for the first nine months of the year; likely due to a day-and-month transposition issue. The good thing is that Forest Service data are not affected (nor is FWS data, but they are a small proportion of the total number of fires), and while these data seem identical to that in the “NIFC” data set after 1986, they do go back to 1980. However, both all and lightning-started fires seem severely underrepresented in frequency in the 1980 through 1985 interval, total and mean area burned are low too. A further discussion of the start-day issue can be found here: Federal Wildland Fire Occurrence Data (FWFOD) – Start-Day Features.
National Fire Occurrence Data, Federal and State Lands, 1986-1996, v1999 (NFO) The data that were analyzed here are almost exactly what we looked at before (Bartlein et al., 2008, IJWF), and so there are few surprises. Because the data include only the conterminous U.S. (and not AK, HI or PR), there is probably nothing worth extracting. Still, it’s good to know that the data we analyzed previously are consistent with later releases.
“NIFC Fire History Data 1980-2003” (NIFC) As just mentioned, the data from 1980 through 1985 seem anomalously low, and Forest Service data are essentially zero prior to 1986. Overall, mean fire size seems consistent with that for later years, but any mapped display prior to 1986 would look strange. The three data sets (FPA-FOD, FWFOD and NIFC) are nearly identical for U.S. Forest Service records after 1986. So, this looks like the the best data set for providing data for the 1986-1991 interval. If there’s a need for data before 1986, it would be best to use the FWFO data, at least for FS and FWS subsets, but only at annual resolution.
Spatial wildfire occurrence data for the United States, 1992-2013 (FPA-FOD) This is easily the “best” documented U.S. data set. There are several things about it, however. For natural/lightning fires, the overall time series of number of fires by year is quite similar in terms of pattern with the NIFIC and FWFO data sets, but there are more fires present in this data set. It generally looks like it’s an “expanded” data set, relative to the earlier ones, and in terms of interannual variability and so on, it’s fine, there would be a little discontinuity in shifting from it to NIFC (before 1992) and to FWFO (before 1986). For human-started fires, there is a lot going on (see below) inasmuch as there are two-to-three times more human-started fires than lightning-started fires; the vast majority of the human-started fires are quite small, however.
Canadian National Fire Database (CNFDB) After cleanup, this is easily the best-behaved data set of the lot, however, the various causes of human-started fires are not as finely differentiated as the are in the U.S. data set.
3.1 Summary
The first-order conclusion from the inspection of the individual data sets is that the U.S. FPA-FOD and (after cleanup) the Canadian CNFDB would provide a comprehensive U.S./Canada data set, with some limitations or issues:
- The FPA-FOD data set only begins in 1992, and so the merged data set would only span 21 years.
- The CNFDB does not differentiate among specific causes of human-started fires.
- There is a difference in reporting units (acres vs. hectares) leading to large differences in the statistical distributions of the smallest fires.
Among the U.S. data sets, only the FPA-FOD does not suffer from record-length, spatial-coverage, or severe mechanical issues (e.g. the “startday” problem in the FWFO data set). The best option for extending the FPA-FOD data set is therefore the (relatively poorly documented) NIFC data set.
4 Merging data sets
There are two aspects of fires and the records that describe their occurrence and size that complicate the simple combination of data sets: fires are inherently spatially and temporally variable, while the records suffer from incompleteness, size-related recording biases, imperfect information, and wholesale mechanical errors. Our objective is to characterize these sources of variability and distinguish among them when combining data sets, in order to preserve as much of the natural variability as possible, while minimizing “mechanical” issues. First, we examined the three main U.S. data sets, with the objective of extending the FPA-FOD data set into the 1980s. Next we examined the size distributions of the FPA-FOD and CNFDB data sets in order to assess the impact on the distributions of different units for expressing area (hectares and acres). (Because most fires are small and generally recorded as whole-number values of the base unit, it’s not simply an acres-to-hectares unit-coversion issue.) Third, we examine the mapped patterns of the merged U.S. and Canadian sets.
4.1 Intercomparison of U.S. data sets
The issues that make the task of merging U.S. data sets less-than-straightforward are 1) the problems with the FWFO data set; 2) the truncated time ranges of all the data sets (FPA-FOD before 1992, NIFC after 2003), and 3) the fact that the FPA-FOD data set contains a lot more fires (in particular, small fires) than earlier data sets.
In comparing the data sets with a view toward merging them [Intercomparison of U.S. Data], there are two things to focus on: 1) bias, or over- or under-representation of fires in one data set or another, and 2) interannual variations and the correlations among the annual values of different variables, such as the total number of fires, total area and mean area. One overarching observation that can be made is that there are many more fires in general, and human-started fires in particular, in the FPA-FOD data set than in the NIFC or FWFOD data sets, and those additional fires are generally small. Other observations include:
All fires:
- The much larger number of fires in the FPA-FOD data set makes it difficult to compare the different data sets. If the FPA-FOD data are regarded as definitive, the NIFC and FWFOD data sets are greatly biased downward.
- Where the series overlap, the NIFC total area burned data are better correlated with the FPA-FOD data than are the FWFOD data, although for mean area burned, both the NIFC and FWFOD data have a large positive bias, related to the large number of fires in the 0.1 - 1 ha size range in the FPA-FOD data.
Lightning-started fires:
- For lightning-started fires, the individual annual time series are much better correlated than those for all fires, but there is still a noticeable negative bias in total number of fires and and postitive bias in mean fire area for the NIFC and FWFOD data relative to the FPA-FOD.
- Two years in the FWFOD data set, 2004 and 2005, seem to have anomalously large total areas burned relative to the FPA-FOD data. Otherwise, the series are well correlated.
Human-started fires:
- The number of human-started fires is quite different across the data set with the FPA-FOD data set recording the most fires, and the NIFC data set the least. In contrast, interannual variations among the series is reasonably well correlated.
- For annual total area burned, the FPA-FOD and NIFC records are fairly well correlated, while the FWFOD record is not well correlated with either, and also appears to be systematically lower.
- For mean area burned by human-started fires, as for all fires the FPA-FOD the NIFC and FWFOD data have a large positive bias, related to the large number of fires in the FPA-FOD data. The interannual variations of the FPA-FOD and NIFC data are again highly correlated.
Overall, the annual values NIFC total area burned and mean area burned data are better correlated with the FPA-FOD across all, lightning-started and human-started fires and show similar or lower biases relative to the FPA-FOD data than do the FWFOD data. In the case of numbers of fires across all fire types, the NIFC and FWFOD are roughly similar in their correlation with or bias relative to the FPA-FOD data.
4.2 Merging U.S. data sets
Merging the U.S. data sets (FPA-FOD and NIFC) involves two steps: 1) creating a common set of variables, which basically involves simple copying and renaming, and 2) reconciling the different fire-cause variables [Merging U.S. Data Sets].
The two data sets use different systems for indentifying the causes of the individual fire starts. The FPA-FOD data include 13 categories of causes (in the numeric variable STAT_CAUSE_CODE), while the NIFC data contain 10 categories (in the factor variable GENERAL_CA). The categories do not have a one-to-one relationship, but are close. We created two new cause categorizations, cause1 and cause2 where cause1 is a coarse-resolution categorization (lightning/natural, human, and unknown), and cause2 is a finer, 10-category list of causes:
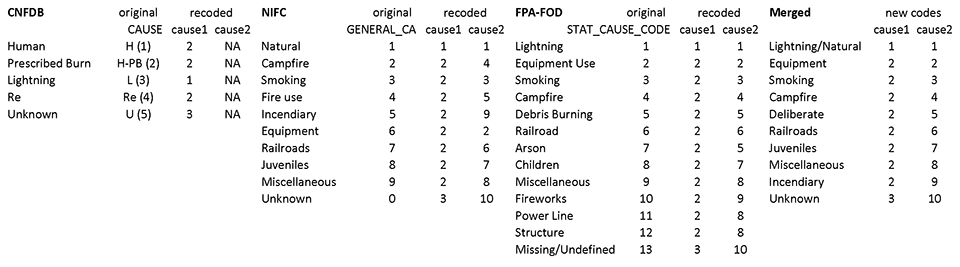
The specific remappings of causes to the merged set are shown in the table, where GENERAL_CA and STAT_CAUSE_CODE are the fire-cause variables in the the original, and for each data set cause1 and cause2 indicate how those values are recoded. Note that this system also accommodates the CNFDB data, which contains only a course-resolution categorization of causes.
4.3 Fire-size distributions in the U.S. and Canadian data sets
An issue that arises in merging the fire-start data from the U.S. and Canada is related to the reporting units used, acres in the case of the U.S. fires, hectares in the case of the Canadian fires. Ignoring zeros, and a few values with extremely small fires-sizes in both data sets, the typical minimum value is 0.01 acres in the U.S. FPA-FOD data set (n = 27,027) and 0.01 hectares in the Canadian CNFDB data set (n = 21,099). (There are also 120 fires = 0.001 acres in FPA-FOD data set, and 446 fires = 0.001 hectares in CNFDB data set). Given that 1 acre = 0.4047 hectares, there will automatically be a differential in the number of small-sized fires between the U.S. and Canada (with more very small fires appearling in the U.S.), which could naively be assigned to environmental variations. To avoid such interpretations it may be desirable to establish some minimum threshold of fire size below which interpretations of the temporal and spatial variations in fire occurrence will not be attempted.
The impact of the reporting-unit difference will show up in the frequency distributions (i.e histograms) of the data for the U.S. and Canada, with more “noise” likely in the frequency of occurrence of the small-fire size classes (when the U.S. data is expressed in units of hectares). There could also be a “built-in” difference in the frequency of large fires in the two data sets related to human population distributions and fire-suppression activities, where fires in Canada might be expected to attain larger ultimate sizes.
There are two strategies for detecting non-environmental influences on the size distributions, 1) simple inspection of the frequency distributions, and 2) a more-formal evaluation of the fit of a theoretical distribution to the data, where lack of fit could be interpreted as a indication of “non-natural” influences on fire-size distributions. Wildfire size distributions are often claimed to display “power-law” properties, which motivates the use of the Pareto distribution as a theoretical distribution to describe the fire-size distributions.
- Introduction and strategy
- Look at distributions.
- Pareto distribution fitting
- summary
4.4 Mapped patterns of the U.S. and Canadian data sets
- continent-wide
- regional
- summary
5 Further analyses of the merged data sets
Characterize the merged data set